

happyphoton/iStock via Getty Images
ZIM Integrated Shipping Services (NYSE:ZIM) has been a massive outperformer since its IPO in 2021 and has been hyped multiple times for its outstanding dividend. Although the company had a favorable business environment as a consequence of the pandemic, this may be coming to an end, and institutional investors have been dumping the stock for the past few months, while the stock’s short ratio significantly increased. ZIM is not a stock I want to buy in these circumstances and as I will show in this article, the likelihood of lower lows is overshadowing the short-term chances, which leads me to rate the stock as a higher-risk hold position.
A quick look at the big picture
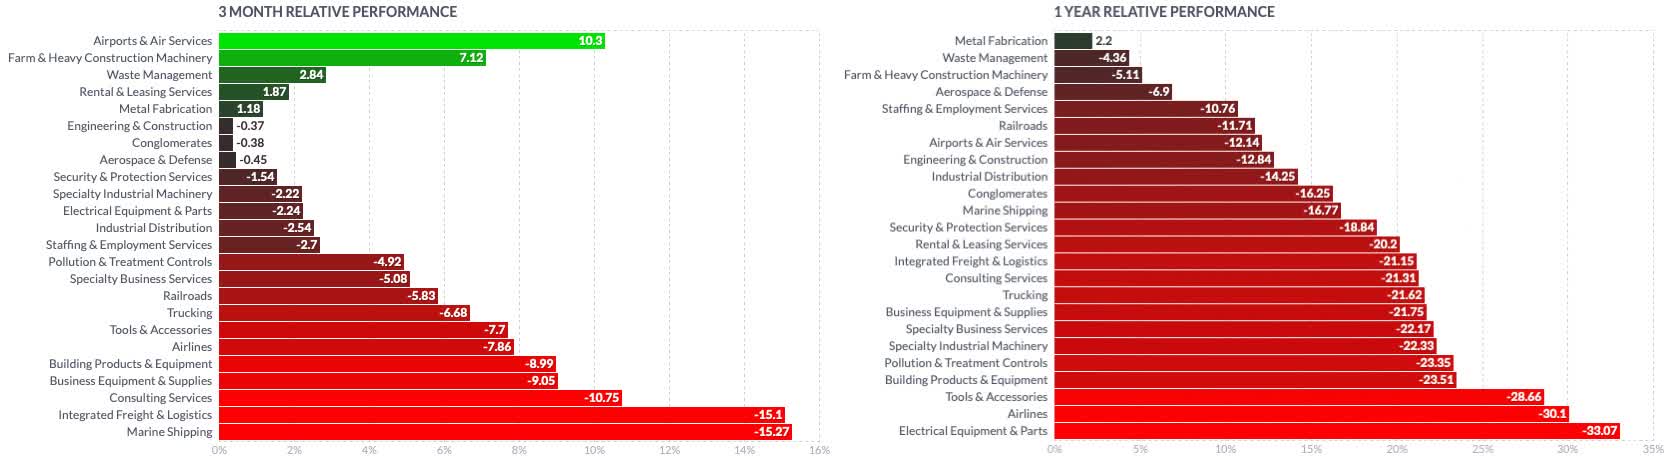
The industrial sector in the US has not been among the major losers in the economy in the past year and, even though still in a downtrend, has shown some signs of strength in the past 3 months. While the sector is led by the airport and air services industry, farm and heavy construction machinery manufacturers, as well as rental and leasing services, companies in the integrated freight and logistics industry have rather been laggards in the past few months, after the industry experienced a massive expansion after the initial shock caused by the recent pandemic.
finviz finviz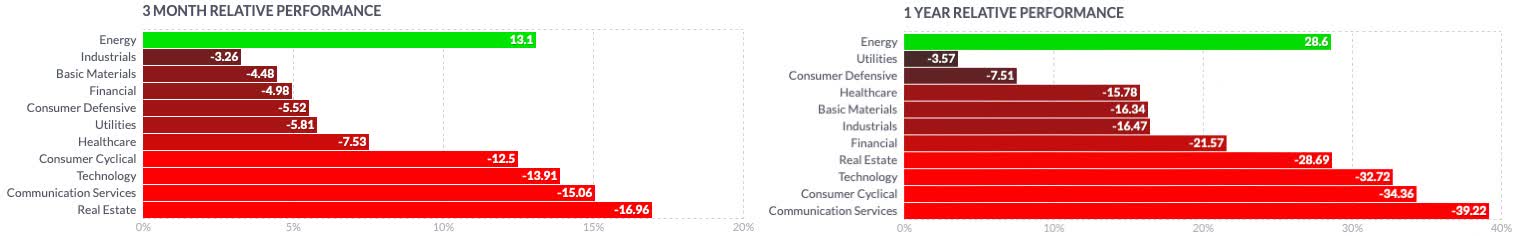
Looking at more specific groups of the industry, the SPDR S&P Transportation ETF (XTN) marked its All-Time High (“ATH”) on November 2, 2021, and has since massively corrected, losing 37% until bottoming on September 26, 2022, and was since hovering sideways. Despite the benchmark seemingly being quite extended, it’s still in a long-term downtrend as can be seen in its weekly chart, and no concrete sign of an inversion can be identified until now.
Author, using TradingView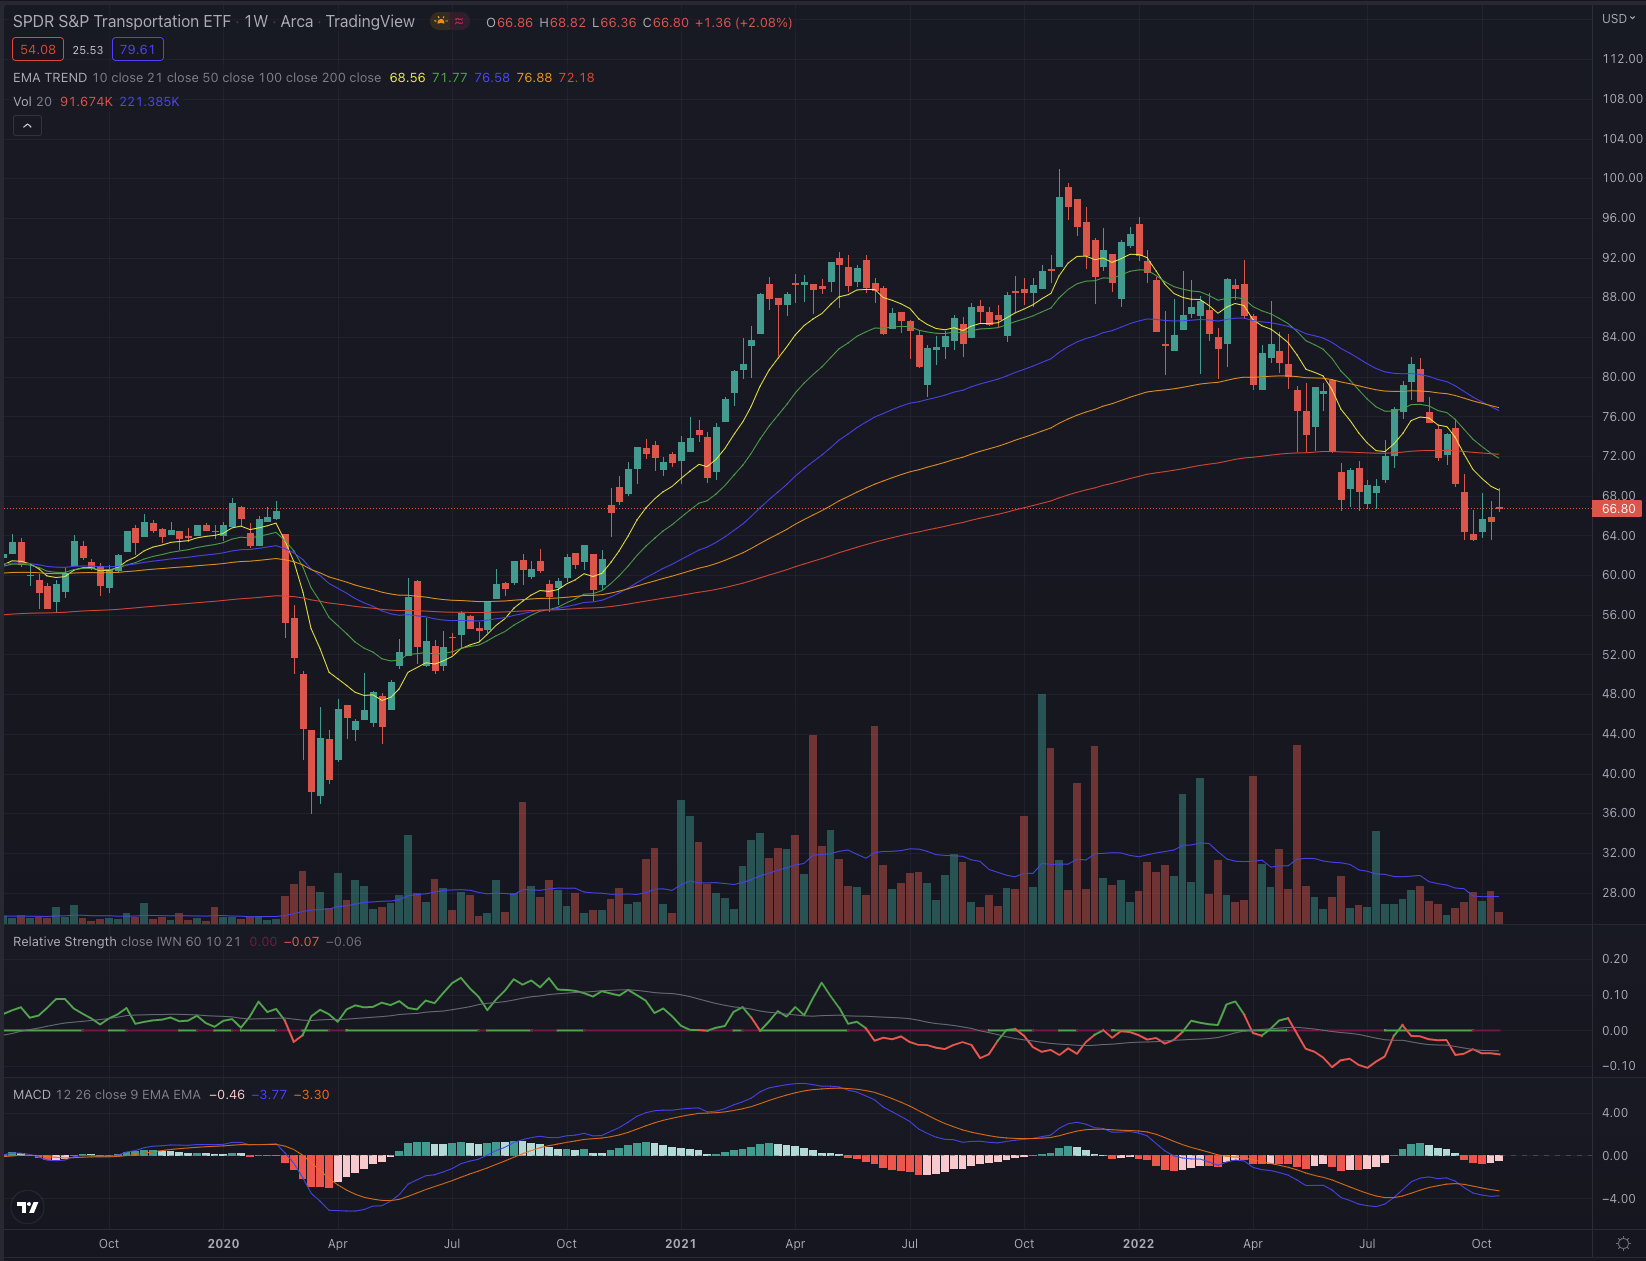
Looking at ZIM’s stock performance, the stock has massively outperformed all its references, resulting in a performance of 113.25% since its IPO in January 2021, while the S&P 500 (SP500) and the more diversified iShares Russell 2000 ETF (IWM), as well as the industry reference XTN performed much worse. Despite performing better than the market and industry references, the analyzed peer stocks Matson (NYSE:MATX) and Kirby Corporation (KEX) both are reporting a rather shy performance over the analyzed time.
Author, using SeekingAlpha.com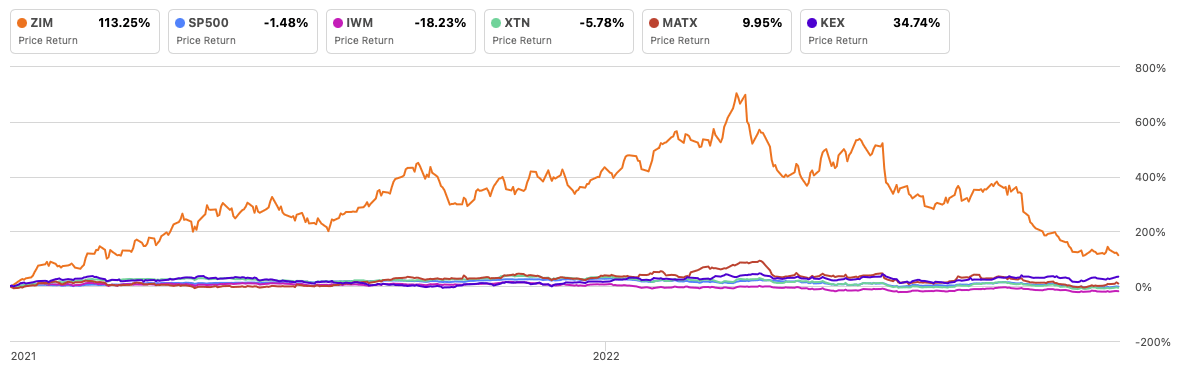
Where are we now?
ZIM reached its ATH on March 17, 2022, and after an initial retracement during May, entered its long-term downtrend at the beginning of June, until just recently bottoming on September 29. Since its last attempt to break out of its EMA50 and its ex-dividend date on August 22, the stock has suffered substantial distribution days, causing it to further extend negatively by crashing through all support levels and losing 75% of its value from its ATH.
Author, using TradingView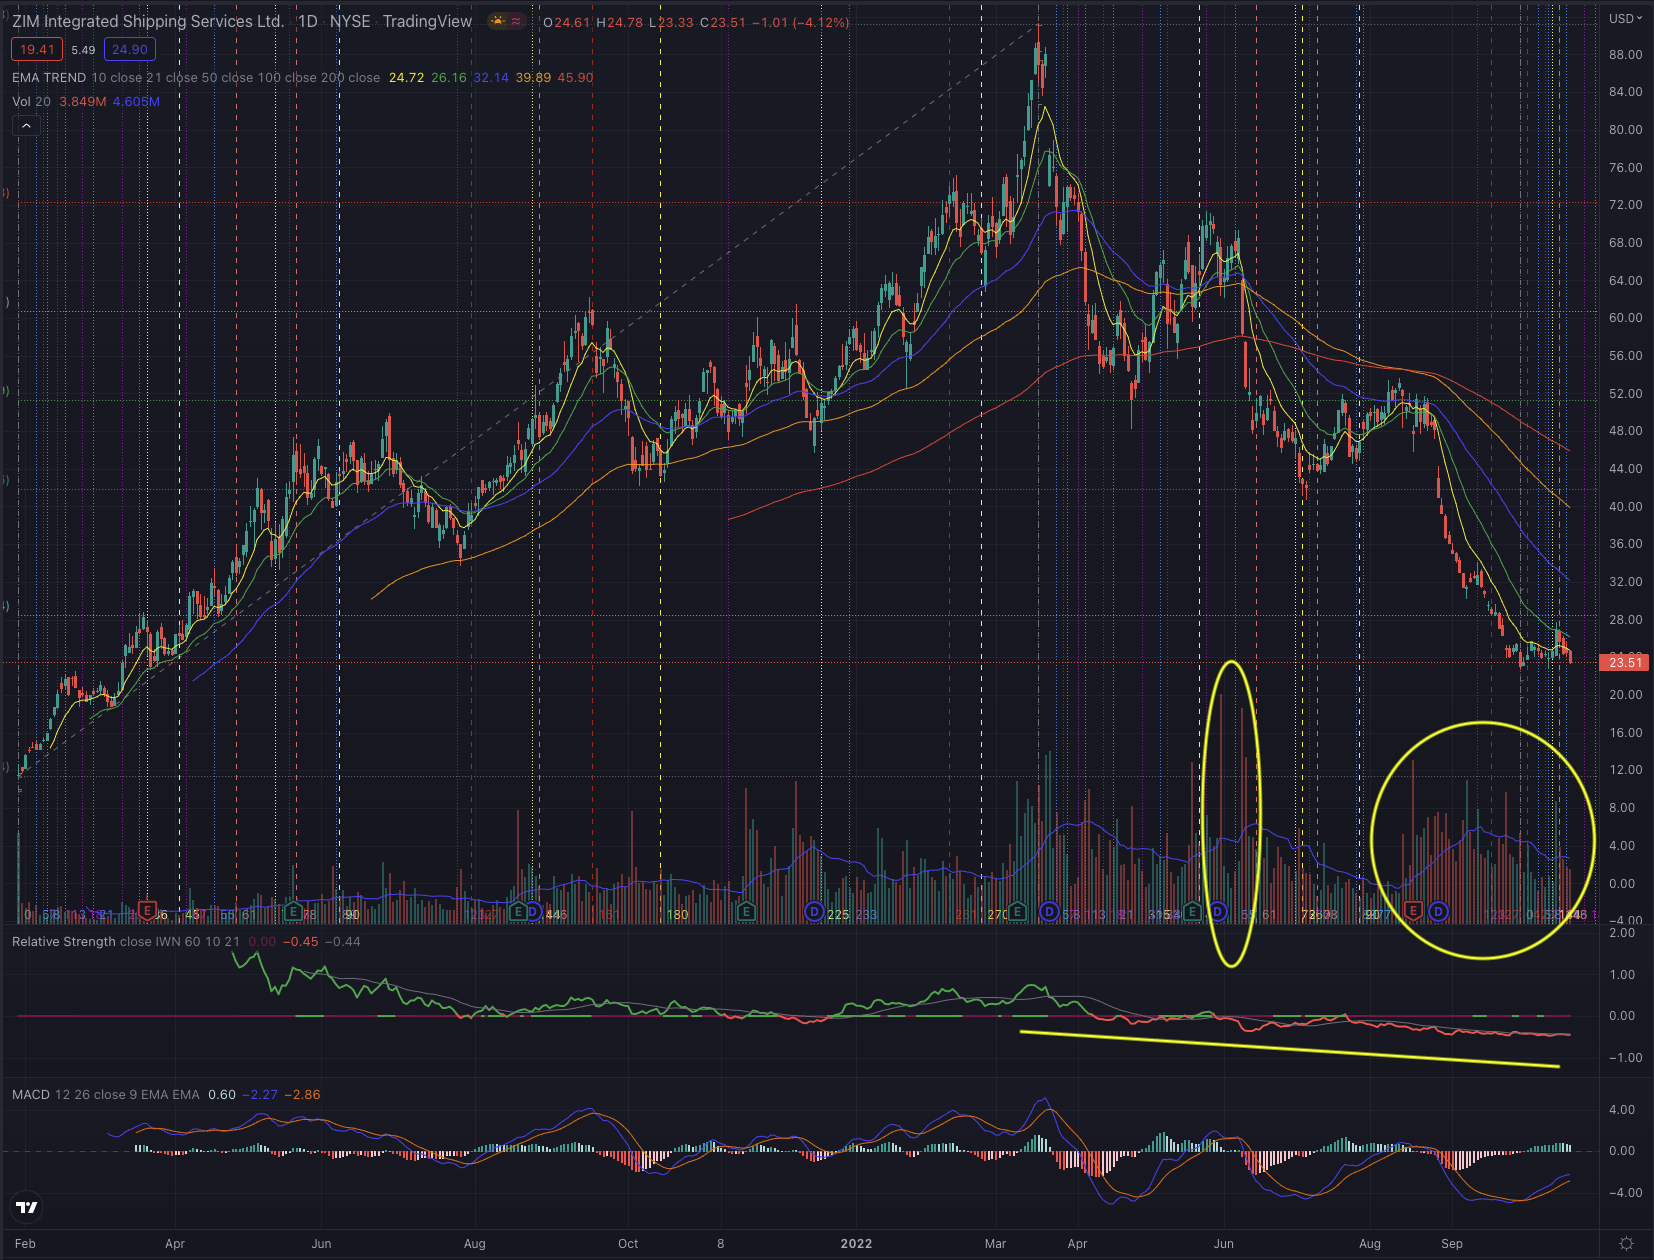
ZIM has reported significant relative weakness compared to both the broader market and the relevant industry since setting up for its long-term downtrend in June 2022, as the stock has been dumped by many institutional investors, such as Renaissance Capital, Evermore Global Advisors, Cambridge Investment Research Advisors, or the National Bank of Canada, the latter exiting almost its entire position until September 30, while only Mackenzie Financial Corp has been substantially increasing its position during the same period.
What is coming next?
I expect the stock to continue performing poorly in the short term, as it is a falling knife, and other than possible support offered by the extended trading channel and at $18.70, technically there is not much that could lead to thinking a reversal is coming up anytime soon. Although in this article I focus on technical aspects, a quick look at the forecasted financials through 2024 gives an even more gloomy picture, as the street is on average expecting 13.7% CAGR lower revenue, a drop of 59% CAGR in EPS, and 33% CAGR less cash from operations, while the often loudly cherished dividend is expected to drop by over 56% CAGR. The company is finally expected to report negative free cash flow and negative net income by the end of the analyzed period, which is not exactly a bright outlook.
Author, using TradingView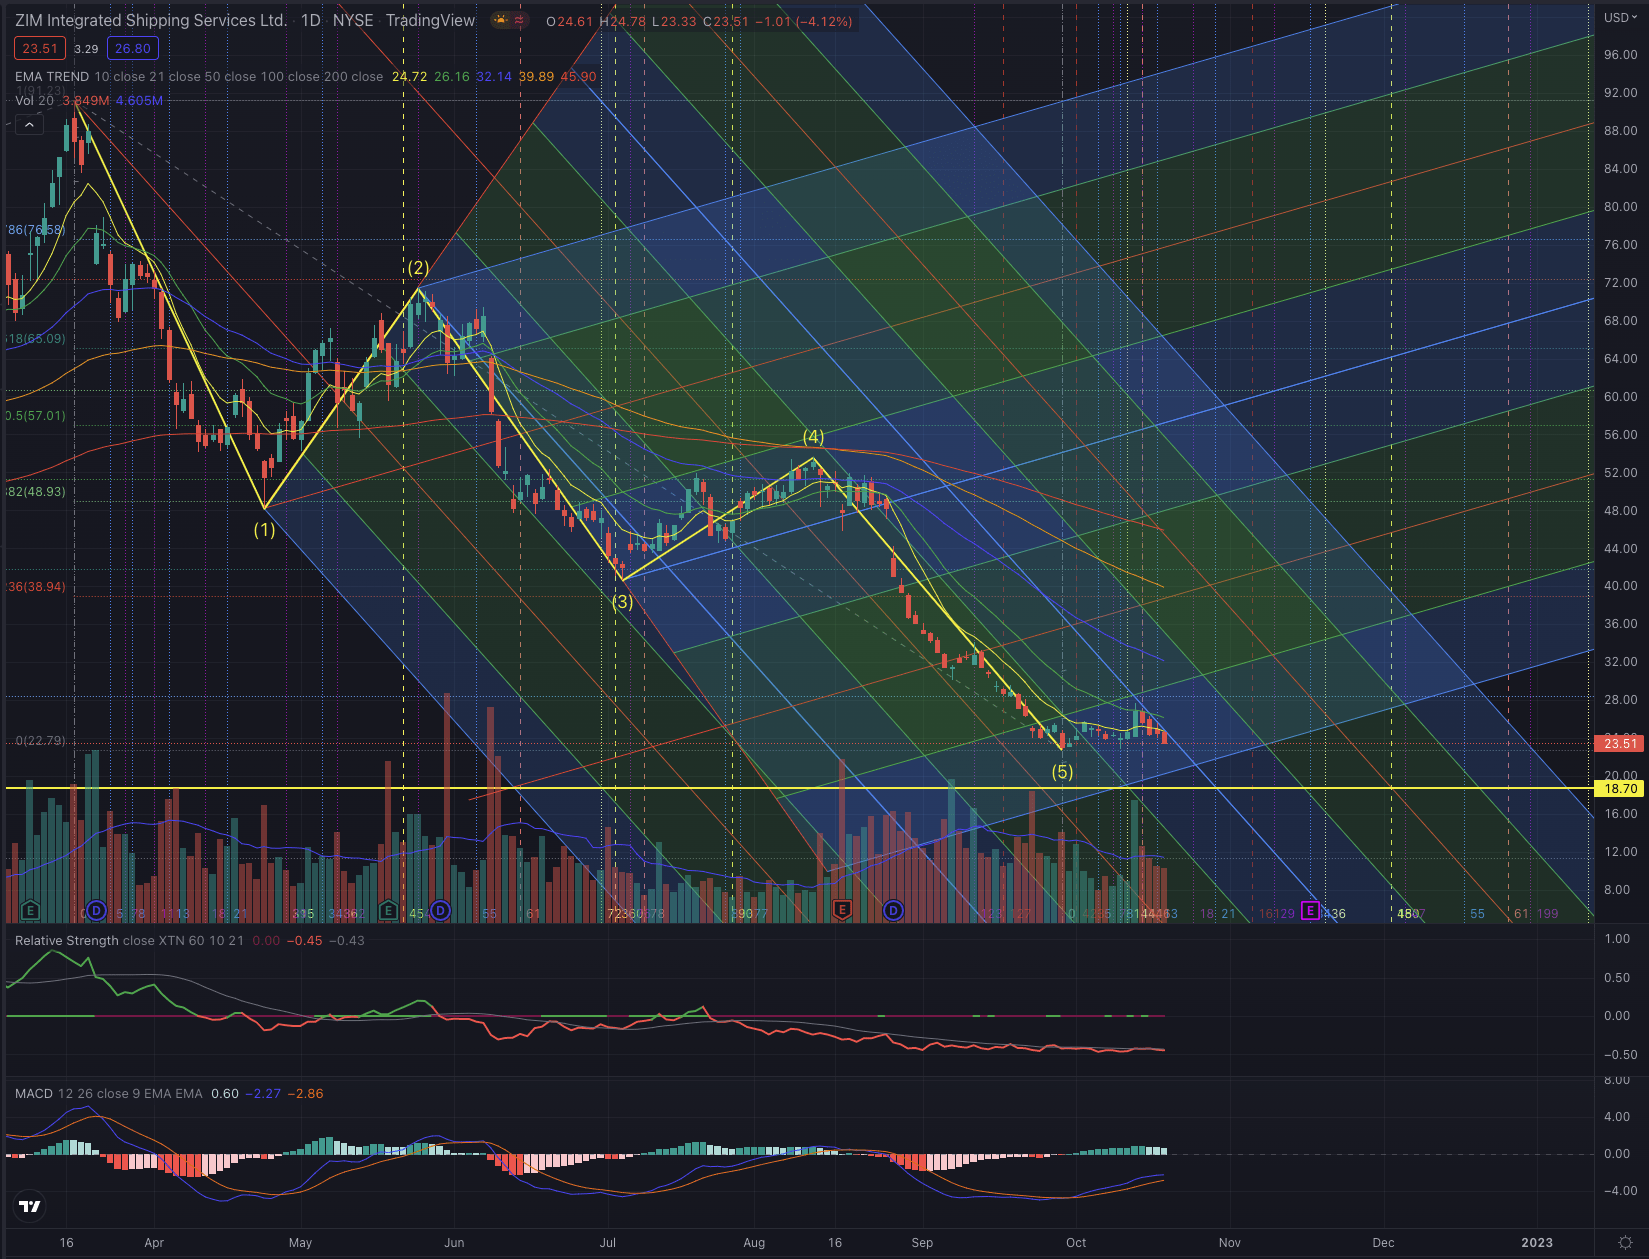
Technically the stock has failed in its Elliott Wave formation, as wave 4 overlapped the territory of wave 1, a situation that will probably lead the stock to continue in its movement after the last wave, signaling a higher likelihood of seeing new lows. The stock has also massive overhead resistance to overcome in case of an unlikely reversal, as basically broke under all most relevant support levels and has repeatedly been rejected by its moving averages as its trailing resistances. ZIM is definitely in its stage four, a stage no investor wants to see if not on the short side, and it’s most certainly not the right time to begin and build a position at this point, as the bottom fishing could continue for an unforeseeable time.
Investors interested in this stock could observe the price action next to the recent low, as the stock is now very close to it, or further down at $18.70. Although a possible short-term reversal cannot be excluded, most likely because some short positions may be covered at some point, as the short ratio exploded by more than 325% in the past 6 months, it is more likely that this stock would need an extended amount of time before it would form a sound base, and attempt to enter a new uptrend.
The bottom line
Technical analysis is not an absolute instrument, but a way to increase investors’ success probabilities and a tool allowing them to be oriented in whatever security. One would not drive towards an unknown destination without consulting a map or using a GPS. I believe the same should be true when making investment decisions. I consider techniques based on the Elliott Wave Theory, as well as likely outcomes based on Fibonacci’s principles, by confirming the likelihood of an outcome contingent on time-based probabilities. The purpose of my technical analysis is to confirm or reject an entry point in the stock, by observing its sector and industry, and most of all its price action. I then analyze the situation of that stock and calculate likely outcomes based on the mentioned theories.
ZIM Integrated Shipping Services may have been hyped since its IPO, massively outperforming its references and offering handsome returns to its investors, as the macroeconomic environment and the consequences of the pandemic have been favorable to the stock. This situation may have come to an end and investors are suffering huge performance losses since March 2022. From a technical point of view, the stock doesn’t offer any positive outlook, which is also confirmed by a quick look at the forecasted financials. The short-term risks are at this point higher than the chances, and long-term oriented investors may want to observe the price action close to the recent lows or around $18.70 before deciding to open or close their long position. It’s more likely that the stock would need an extended time before forming a solid base, and lower lows are in my opinion likely, leading me to rate this stock as a higher-risk hold position.
Be the first to comment