

Jose Luis Pelaez Inc
For most investors bear markets are scary, or even downright terrifying. But according to studies from Bank of America, JPMorgan, Citigroup, and Fidelity, between 80% and 99.9% of all long-term returns are generated from bear markets.
Specifically, 80% to 99.9% of long-term market gains are generated by the market’s single best days almost all of which occur during periods of maximum volatility meaning bear markets.
Or to put it another way, stocks don’t generate the best returns of any asset class despite bear markets, but precisely because of them.
And that’s why I get excited whenever we’re lucky enough to get a historically normal, healthy, and expected bear market like this.
Ycharts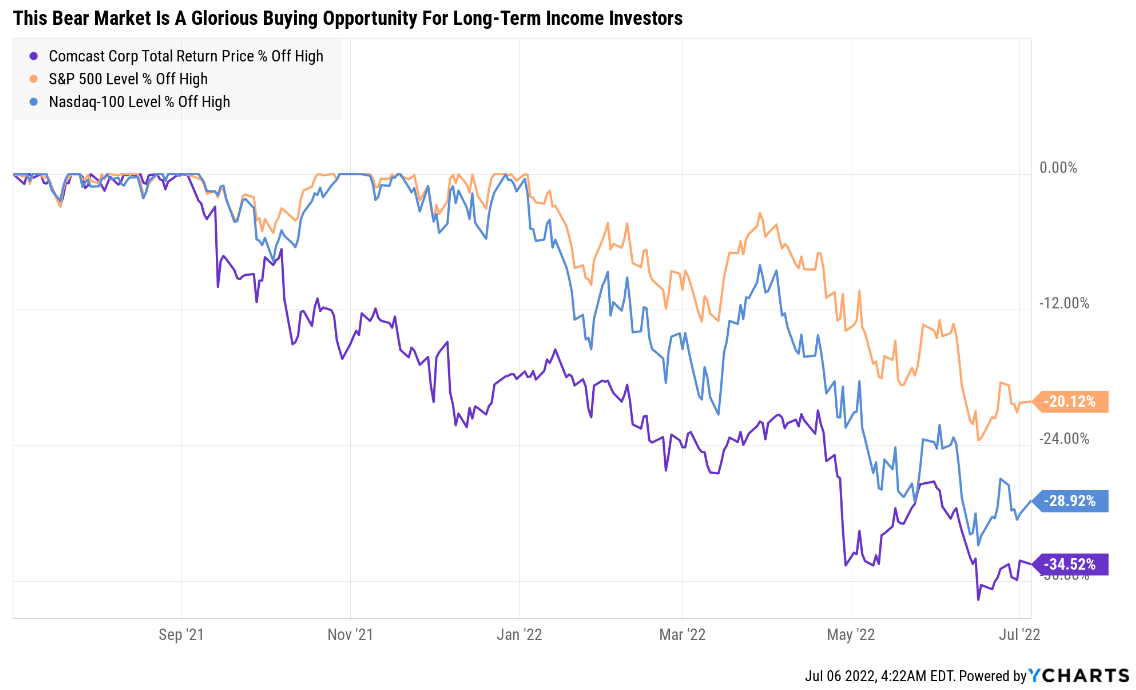
Because in times like these even the world’s best companies go on sale. And I don’t just mean reasonable valuations, I mean table-pounding, Buffett-style “fat pitch” anti-bubble blue-chip bargains.
That’s exactly what Comcast (NASDAQ:CMCSA) is today, and I wanted to share with you why I recently recommended it for Dividend Kings members, and bought some more for my retirement portfolio.
In fact, there are four reasons, in my opinion, why Comcast is one of the best fast-growing dividend blue-chips you can buy today, one of which is its potential to deliver 250% total returns in the next five years.
Reason One: Comcast Is The Complete Package
Here is the bottom line upfront on Comcast
Reasons To Potentially Buy CMCSA Today
- 87% quality medium-risk 12/13 Super SWAN telecom
- 118th highest quality company on the Master List (76th percentile)
- 95% dividend safety score
- 14-year dividend growth streak (every year since it began paying one)
- 2.7% very safe yield
- 0.5% average recession dividend cut risk
- 1.3% severe recession dividend cut risk
- 38% conservatively undervalued (potential very strong buy)
- Fair Value: $63.83 (16.7X earnings)
- 10.4X forward earnings vs 17.5X to 18.5X historical
- 7.5X cash-adjusted earnings = anti-bubble blue-chip priced for -2% growth
- A- stable outlook credit rating = 2.5% 30-year bankruptcy risk
- 57th industry percentile risk management consensus = average
- 12% to 20% CAGR margin-of-error growth consensus range
- 13.7% CAGR median growth consensus
- 5-year consensus total return potential: 24% to 27% CAGR
- base-case 5-year consensus return potential: 25% CAGR (4X more than the S&P consensus)
- consensus 12-month total return forecast: 35%
- Fundamentally Justified 12-Month Returns: 63% CAGR
CMCSA is in a 35% bear market but not because of fundamentally justified reasons.
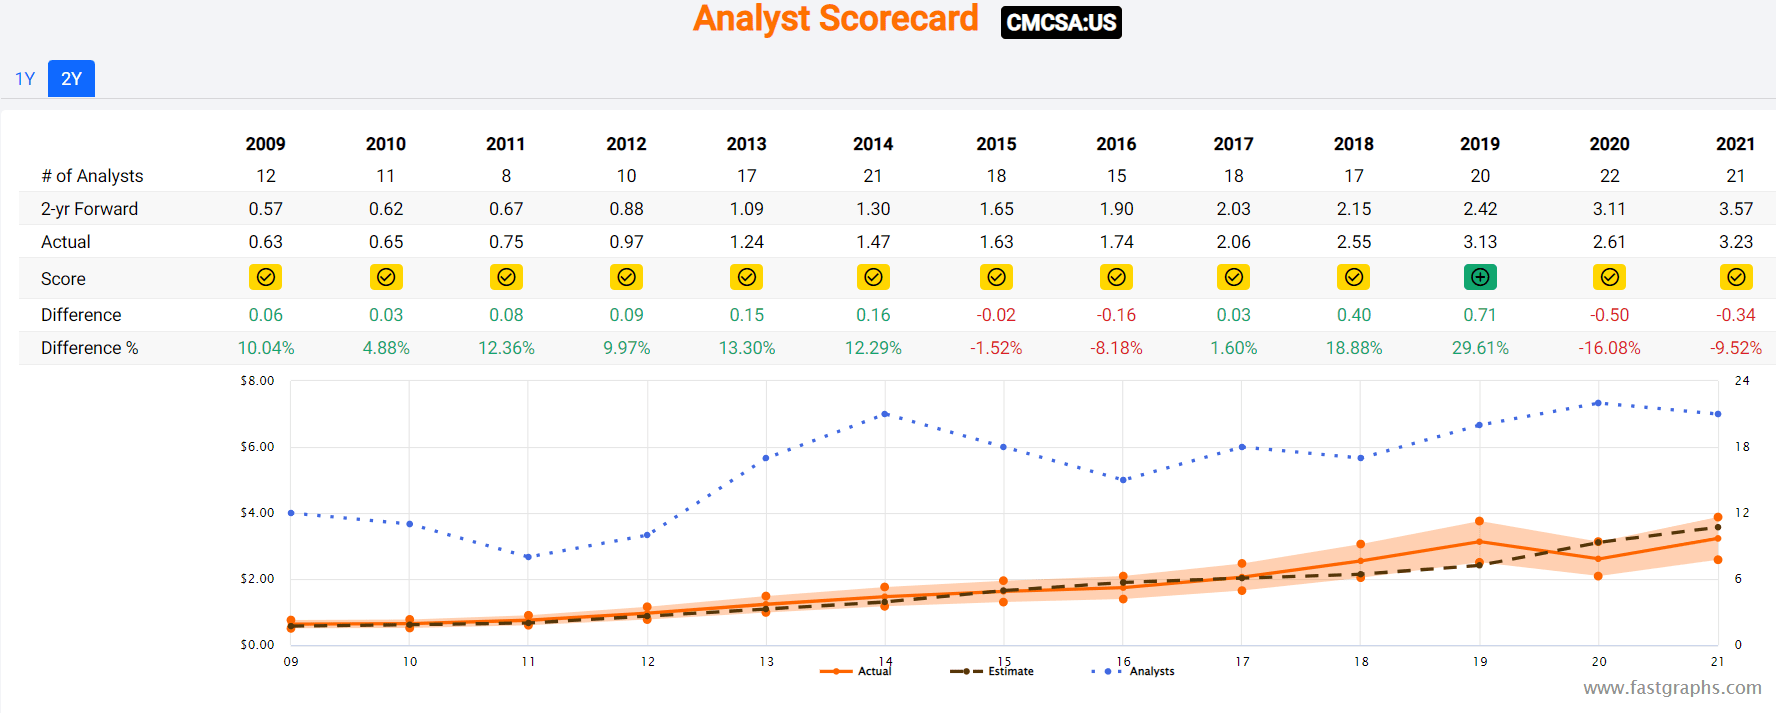
CMCSA Long-Term Growth Outlook Is Intact
| Metric | 2021 Growth Consensus | 2022 Growth Consensus | 2023 Growth Consensus | 2024 Growth Consensus | 2025 Growth Consensus | 2026 Growth Consensus |
2027 Growth Consensus |
| Sales | 12% | 7% | 2% | 3% | 2% | 4% | 4% |
| Dividend | 9% | 8% (Official) | 7% | 9% | 6% | 1% | 9% |
| EPS | 24% | 11% | 11% | 17% | 14% | 21% | 15% |
| Operating Cash Flow | 17% | -1% | 8% | 9% | NA | NA | NA |
| Free Cash Flow | 28% | -8% | 9% | 10% | 16% | 28% | 29% |
| EBITDA | 12% | 9% | 4% | 6% | NA | NA | NA |
| EBIT (operating income) | 17% | 13% | 7% | 8% | NA | NA | NA |
(Source: FAST Graphs, FactSet)
CMCSA is a strongly growing company with a dividend streak that’s expected to hit 19 years by 2027.
Rolling Returns Since August 1988
(Source: Portfolio Visualizer Premium)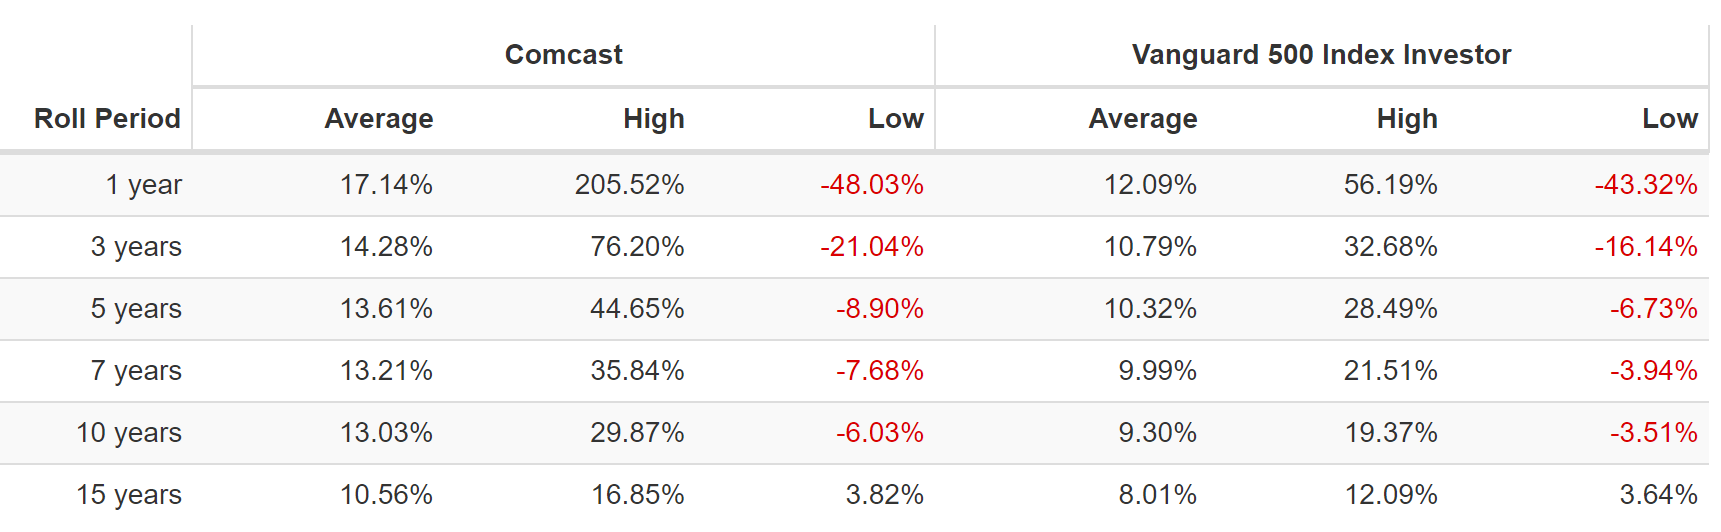
CMCSA is a very consistent market beater, with average rolling returns of 11% to 17% but from bear market lows as high as 17% over the next 15 years and 30% over the next 10 years.
- 10.3X return in 15 years
- 13.6X return in 10 years
CMCSA 2024 Consensus Total Return Potential
(Source: FAST Graphs, FactSet) (Source: FAST Graphs, FactSet)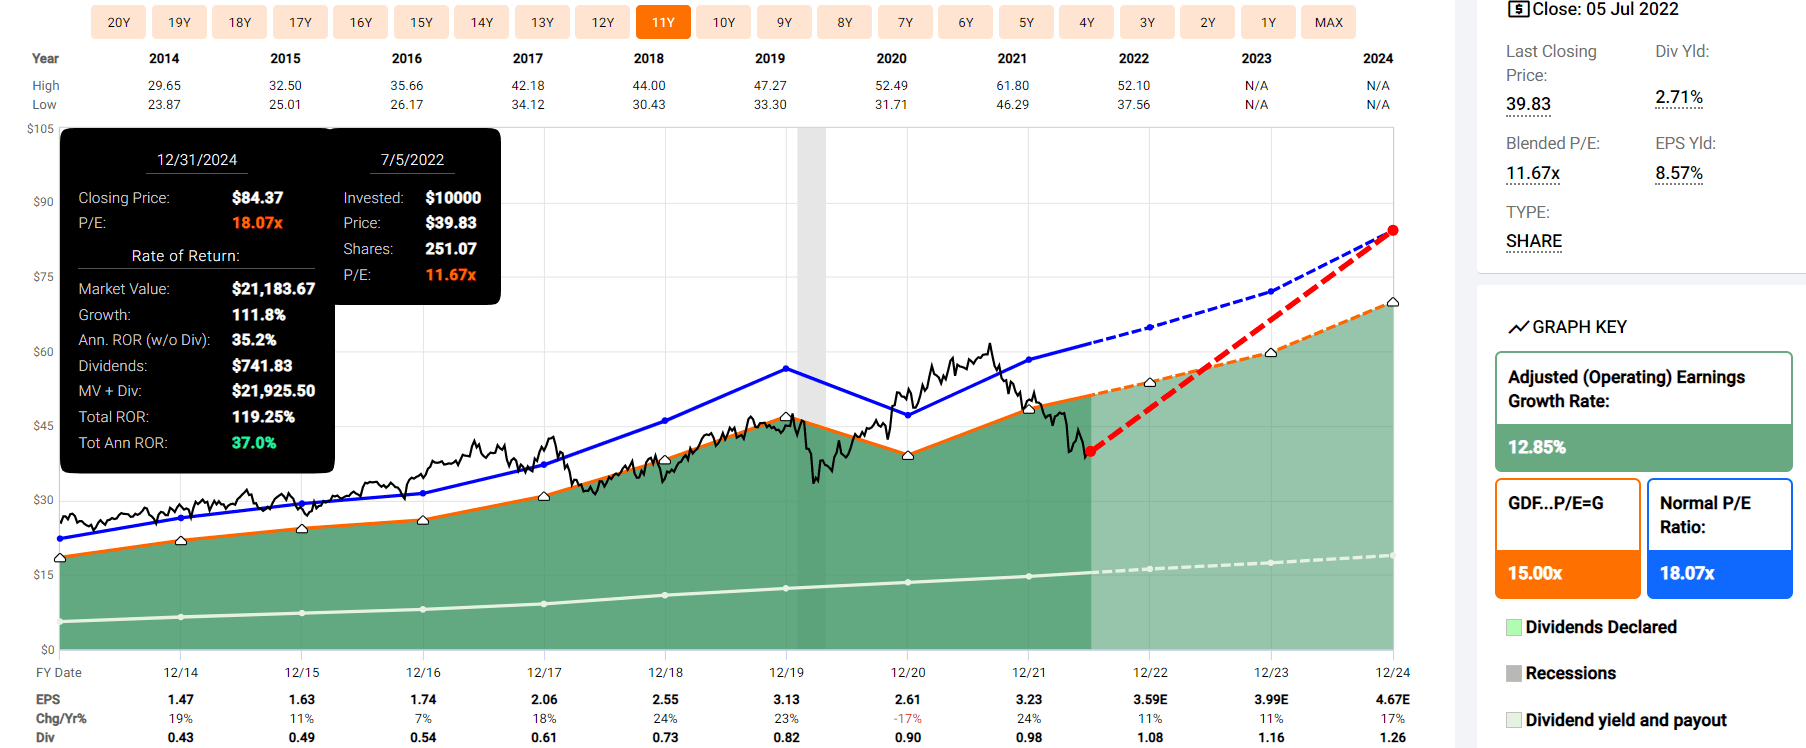
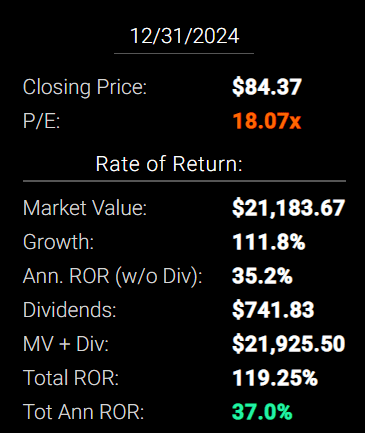
If CMCSA grows as analysts expect by 2024 and returns to historical mid-range fair value, it could potentially deliver 119% total returns or 37% annually.
- 4X the S&P 500 consensus
- Buffett and Joel Greenblatt-like returns from an anti-bubble blue-chip bargain hiding in plain sight
CMCSA 2027 Consensus Total Return Potential
(Source: FAST Graphs, FactSet) (Source: FAST Graphs, FactSet)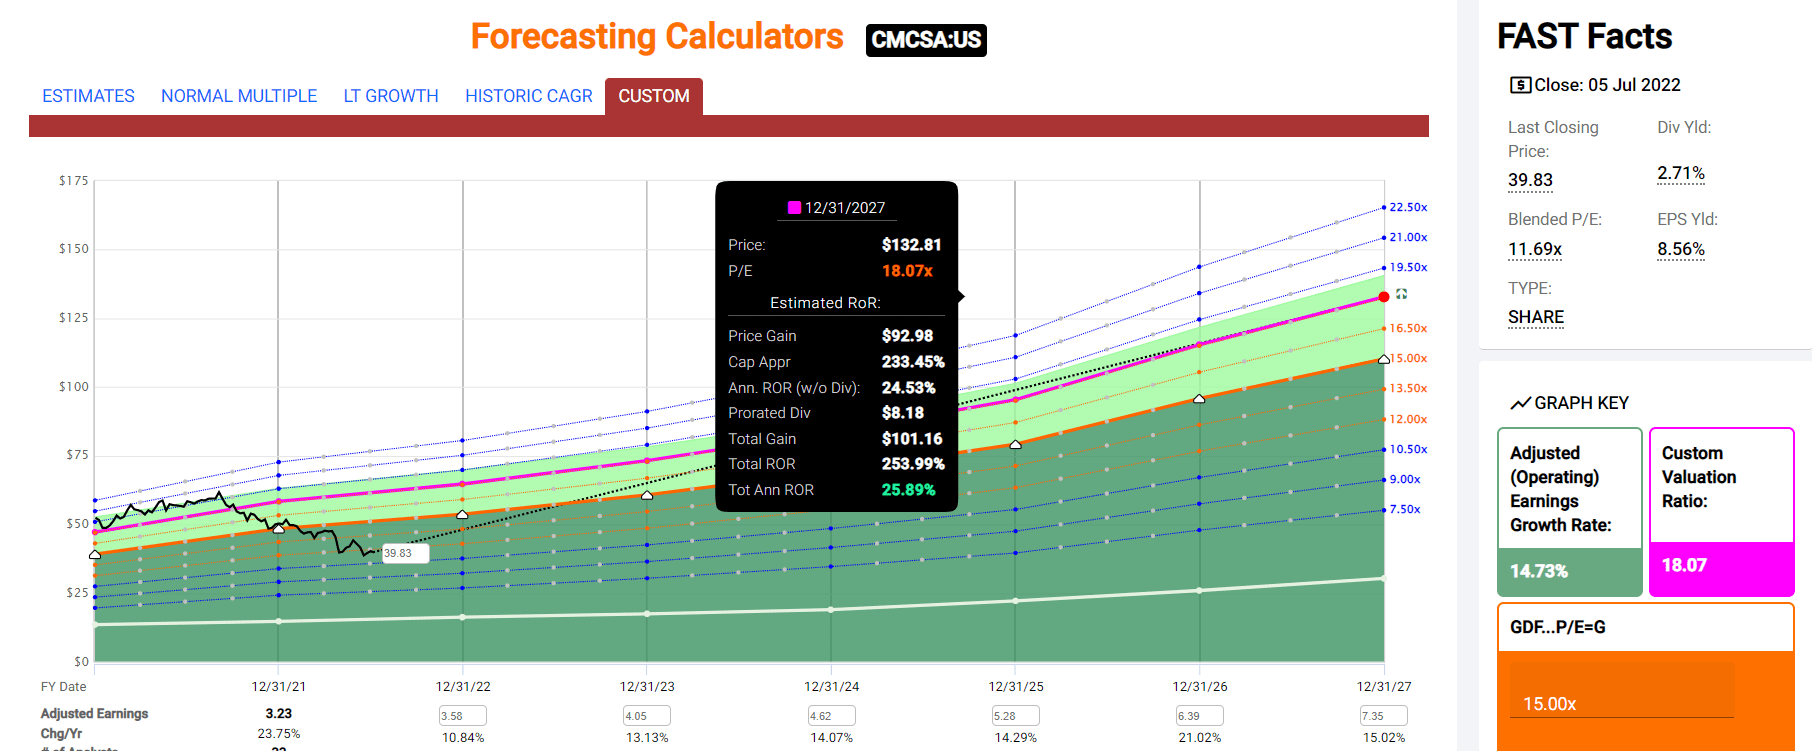
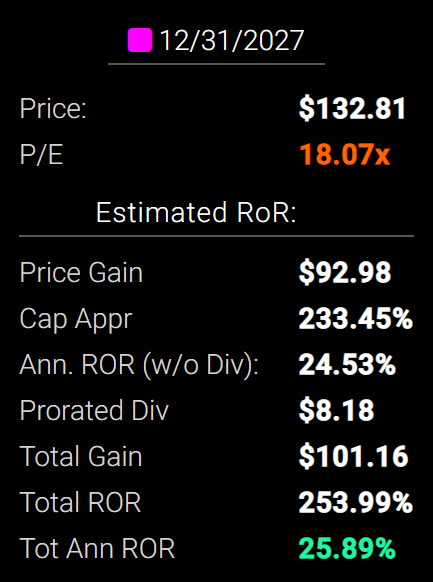
By 2027 if CMCSA grows as expected and returns to historical mid-range fair value, it could deliver 254% total returns or 26% annually.
- over 4X more than the S&P 500 consensus
- Buffett and Peter Lynch-like returns from an anti-bubble blue-chip bargain hiding in plain sight
CMCSA Long-Term Consensus Total Return Potential
| Investment Strategy | Yield | LT Consensus Growth | LT Consensus Total Return Potential | Long-Term Risk-Adjusted Expected Return | Long-Term Inflation And Risk-Adjusted Expected Returns | Years To Double Your Inflation & Risk-Adjusted Wealth |
10-Year Inflation And Risk-Adjusted Expected Return |
| Comcast | 2.7% | 13.7% | 16.4% | 11.5% | 9.0% | 8.0 | 2.37 |
| Nasdaq | 1.0% | 12.7% | 13.7% | 9.6% | 7.1% | 10.1 | 1.99 |
| Dividend Aristocrats | 2.4% | 8.5% | 10.9% | 7.6% | 5.2% | 14.0 | 1.65 |
| S&P 500 | 1.8% | 8.5% | 10.3% | 7.2% | 4.7% | 15.2 | 1.59 |
(Sources: Morningstar, FactSet, Ycharts)
- analysts expect CMCSA to deliver 16.4% long-term returns, similar to what it’s done historically (17% average annual return since 1988)
- more than most popular investment strategies such as the aristocrats, S&P and even the Nasdaq
CMCSA Total Returns Since August 1988
(Source: Portfolio Visualizer Premium) (Source: Portfolio Visualizer Premium)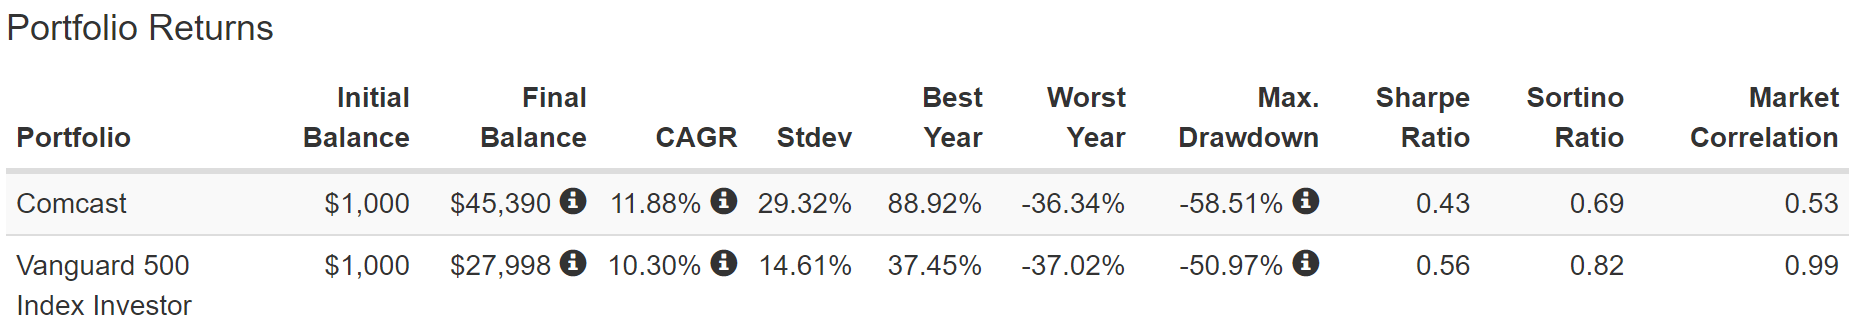
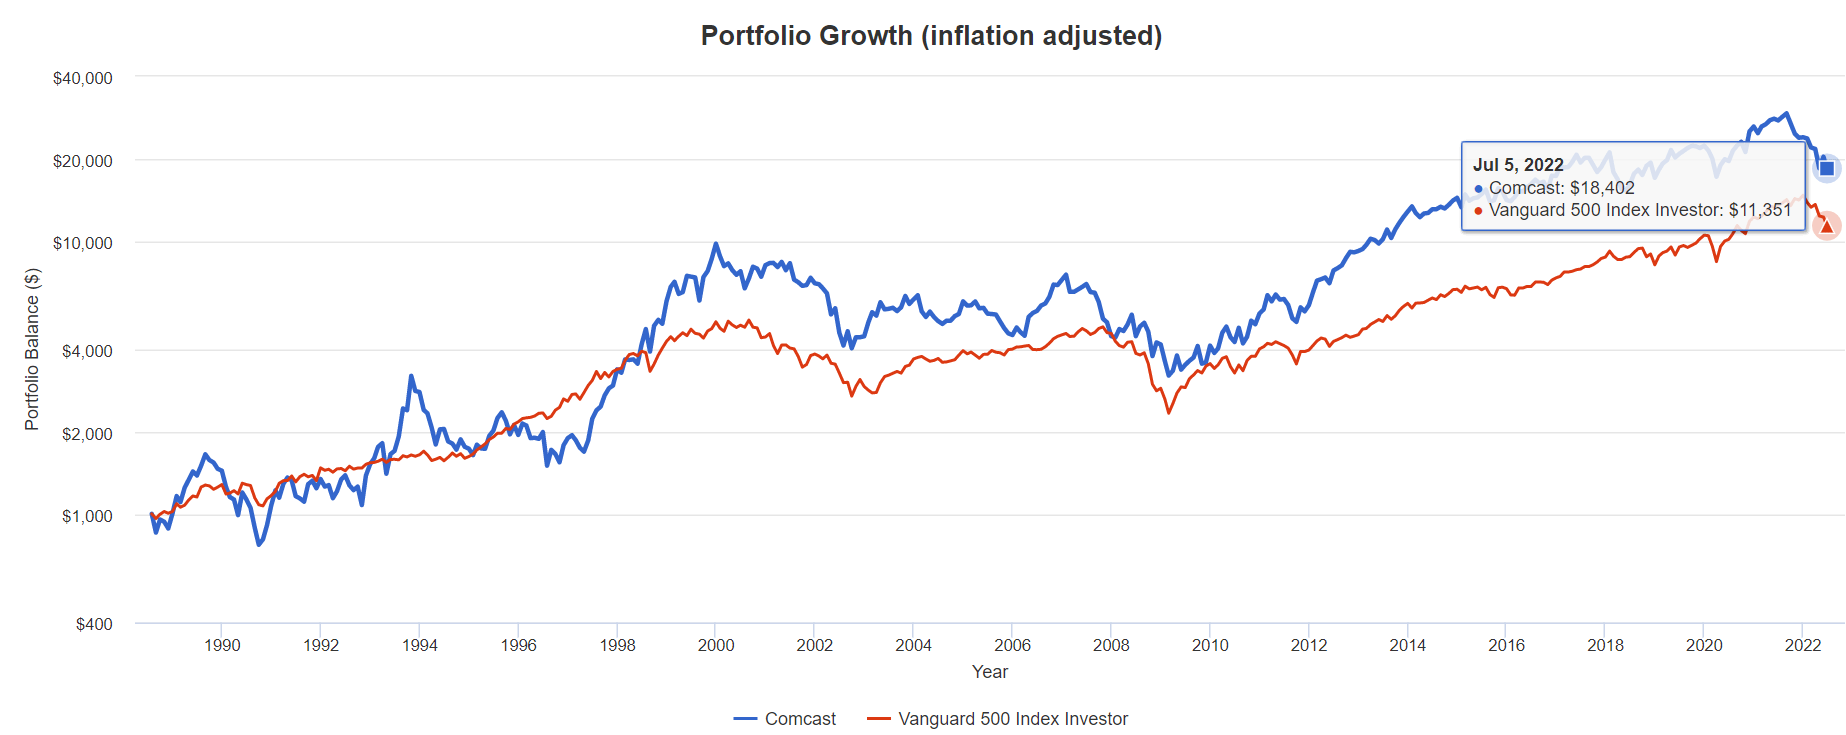
CMCSA’s historical 12% CAGR total return includes the current 35% bear market.
- 45X return since 1988
- 18X adjusted for inflation
- almost 2X more than the S&P 500
A Dividend Growth Blue-Chip You Can Trust
(Source: Portfolio Visualizer Premium) special dividends in several years, no cuts in the regular dividend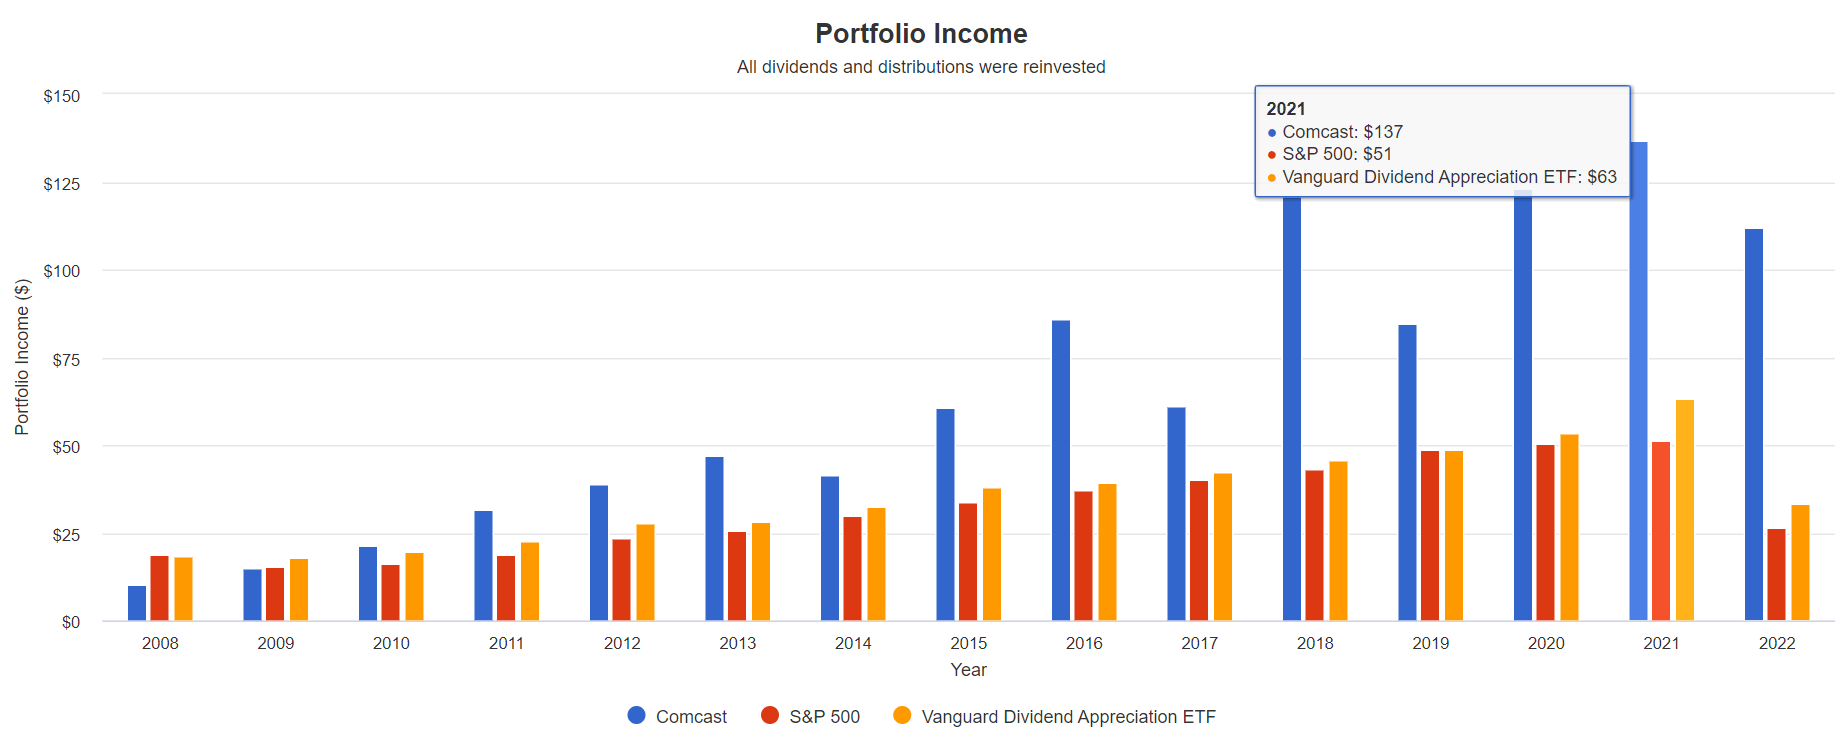
| Portfolio | 2008 Income Per $1,000 Investment | 2021 Income Per $1,000 Investment | Annual Income Growth | Starting Yield |
2021 Yield On Cost |
| Nasdaq | $27 | $374 | 22.41% | 2.7% | 37.4% |
| S&P 500 | $19 | $51 | 7.89% | 1.9% | 5.1% |
| Vanguard Dividend Appreciation ETF | $18 | $63 | 10.12% | 1.8% | 6.3% |
| Comcast | $10 | $137 | 22.30% | 1.0% | 13.7% |
(Source: Portfolio Visualizer Premium)
CMCSA’s dividend growth over the last 13 years has been an incredible 22% per year, matching the Nasdaq’s incredible dividend growth and running circles around the S&P 500 and VIG‘s 10%.
VIG is the gold standard of fast dividend growth ETFs, no annual dividend cuts since inception.
What about the future?
| Analyst Consensus Income Growth Forecast | Risk-Adjusted Expected Income Growth | Risk And Tax-Adjusted Expected Income Growth |
Risk, Inflation, And Tax Adjusted Income Growth Consensus |
| 21.4% | 15.0% | 12.8% | 10.2% |
(Source: DK Research Terminal, FactSet)
Analysts expect 21% income growth from CMCSA in the future, which adjusted for the risk of it not growing as expected, inflation, and taxes are about 10.2% real expected income growth.
Now compare that to what they expect from the S&P 500.
| Time Frame | S&P Inflation-Adjusted Dividend Growth | S&P Inflation-Adjusted Earnings Growth |
| 1871-2021 | 1.6% | 2.1% |
| 1945-2021 | 2.4% | 3.5% |
| 1981-2021 (Modern Falling Rate Era) | 2.8% | 3.8% |
| 2008-2021 (Modern Low Rate Era) | 3.5% | 6.2% |
| FactSet Future Consensus | 2.0% | 5.2% |
(Sources: S&P, FactSet, Multipl.com)
What about a 60/40 retirement portfolio?
- 0.5% consensus inflation, risk, and tax-adjusted income growth.
In other words, CMCSA is expected to generate 5X faster real income growth than the S&P 500 and 20X faster income growth than a 60/40.
- and with a 1% higher yield from day one
What inflation-adjusted returns do analysts expect in the future?
Inflation-Adjusted Consensus Return Potential: $1,000 Initial Investment
| Time Frame (Years) | 7.6% CAGR Inflation-Adjusted S&P Consensus | 8.4% Inflation-Adjusted Aristocrats Consensus | 13.9% CAGR Inflation-Adjusted CMCSA Consensus | Difference Between Inflation-Adjusted CMCSA Consensus Vs S&P Consensus |
| 5 | $1,445.67 | $1,493.29 | $1,919.51 | $473.84 |
| 10 | $2,089.97 | $2,229.92 | $3,684.52 | $1,594.55 |
| 15 | $3,021.42 | $3,329.92 | $7,072.48 | $4,051.06 |
| 20 | $4,367.98 | $4,972.54 | $13,575.69 | $9,207.71 |
| 25 | $6,314.67 | $7,425.45 | $26,058.68 | $19,744.01 |
| 30 | $9,128.95 | $11,088.36 | $50,019.91 | $40,890.96 |
(Source: DK Research Terminal, FactSet)
Even if CMCSA only grows as expected for a decade that’s still a nearly 4X inflation-adjusted return.
- ignoring its anti-bubble valuation entirely
| Time Frame (Years) | Ratio Aristocrats/S&P Consensus | Ratio Inflation-Adjusted CMCSA Consensus vs S&P consensus |
| 5 | 1.03 | 1.33 |
| 10 | 1.07 | 1.76 |
| 15 | 1.10 | 2.34 |
| 20 | 1.14 | 3.11 |
| 25 | 1.18 | 4.13 |
| 30 | 1.21 | 5.48 |
(Source: DK Research Terminal, FactSet)
Which is potentially 76% more than the S&P 500 and 70% more than the dividend aristocrats
CMCSA Investment Decision Score
DK
(Source: DK Automated Investment Decision Tool)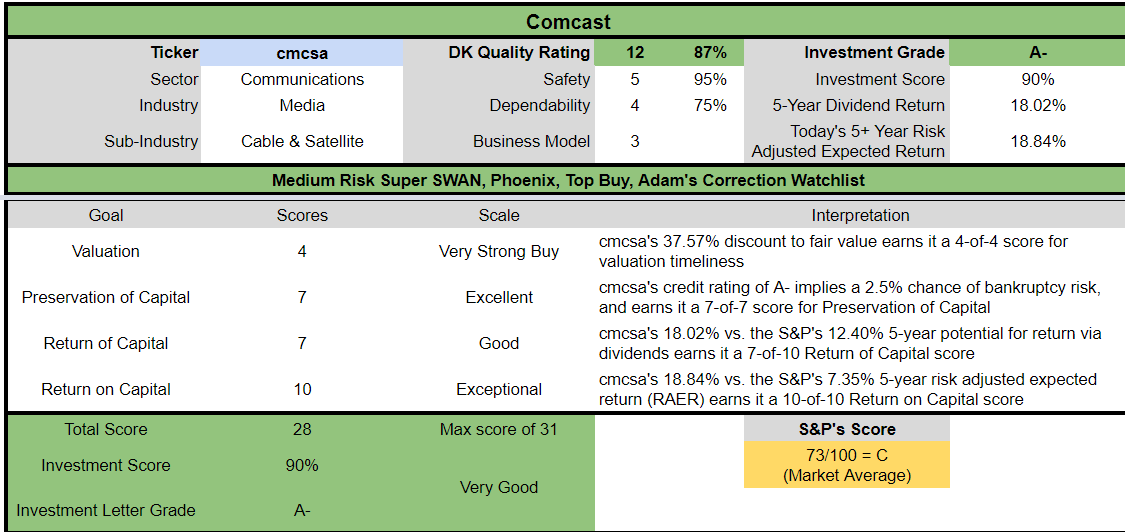
For anyone comfortable with its risk profile, CMCSA is one of the most reasonable and prudent fast-growing dividend blue-chips you can buy, in my opinion.
- 38% discount vs 5% market discount = 33% better valuation
- 2.7% yield vs 1.7% yield (and a much safer yield at that)
- potentially 60% higher long-term return potential than S&P 500 overtime
- more than 2X better risk-adjusted expected return over the next five years
- 18% of your investment repaid in consensus dividends within five years, about 50% more than the S&P 500
Reason Two: One Of The World’s Highest Quality Companies
There are many ways to measure safety and quality and I factor in pretty much all of them.
The Dividend Kings’ overall quality scores are based on a 253-point model that includes:
-
Dividend safety
-
Balance sheet strength
-
Credit ratings
-
Credit default swap medium-term bankruptcy risk data
-
Short and long-term bankruptcy risk
-
Accounting and corporate fraud risk
-
Profitability and business model
-
Growth consensus estimates
-
Management growth guidance
-
Historical earnings growth rates
-
Historical cash flow growth rates
-
Historical dividend growth rates
-
Historical sales growth rates
-
Cost of capital
-
GF Scores
-
Long-term risk-management scores from MSCI, Morningstar, FactSet, S&P, Reuters’/Refinitiv, and Just Capital
-
Management quality
-
Dividend-friendly corporate culture/income dependability
-
Long-term total returns (a Ben Graham sign of quality)
-
Analyst consensus long-term return potential
In fact, it includes over 1,000 fundamental metrics including the 12 rating agencies we use to assess fundamental risk.
-
credit and risk management ratings make up 41% of the DK safety and quality model
-
dividend/balance sheet/risk ratings make up 82% of the DK safety and quality model
How do we know that our safety and quality model works well?
During the two worst recessions in 75 years, our safety model 87% of blue-chip dividend cuts, the ultimate baptism by fire for any dividend safety model.
How does CMCSA score on our comprehensive safety and quality models?
CMCSA Dividend Safety
| Rating | Dividend Kings Safety Score (162 Point Safety Model) | Approximate Dividend Cut Risk (Average Recession) |
Approximate Dividend Cut Risk In Pandemic Level Recession |
| 1 – unsafe | 0% to 20% | over 4% | 16+% |
| 2- below average | 21% to 40% | over 2% | 8% to 16% |
| 3 – average | 41% to 60% | 2% | 4% to 8% |
| 4 – safe | 61% to 80% | 1% | 2% to 4% |
| 5- very safe | 81% to 100% | 0.5% | 1% to 2% |
| CMCSA | 95% | 0.5% | 1.3% |
| Risk Rating | Medium-Risk (57th industry percentile risk-management consensus) | A- stable outlook credit rating 2.5% 30-year bankruptcy risk | 15% OR LESS Max Risk Cap Recommendation |
Long-Term Dependability
| Company | DK Long-Term Dependability Score | Interpretation | Points |
| Non-Dependable Companies | 21% or below | Poor Dependability | 1 |
| Low Dependability Companies | 22% to 60% | Below-Average Dependability | 2 |
| S&P 500/Industry Average | 61% (61% to 70% range) | Average Dependability | 3 |
| Above-Average | 71% to 80% | Very Dependable | 4 |
| Very Good | 81% or higher | Exceptional Dependability | 5 |
| CMCSA | 75% | Very Dependable | 4 |
Overall Quality
| CMCSA | Final Score | Rating |
| Safety | 95% | 5/5 Very Safe |
| Business Model | 90% | 3/3 Wide And Stable Moat |
| Dependability | 75% | 4/5 Very Dependable |
| Total | 87% | 12/13 Super SWAN |
| Risk Rating |
2/3 Medium-Risk |
|
| 15% OR LESS Max Risk Cap Rec |
10% Margin of Safety For A Potentially Good Buy |
CMCSA is the 118th highest quality company on the DK 500 Masterlist.
How significant is this? The DK 500 Master List is one of the world’s best watchlists including
- every dividend aristocrat (S&P companies with 25+ year dividend growth streaks)
- every dividend champion (every company, including foreign, with 25+ year dividend growth streaks)
- every dividend king (every company with 50+ year dividend growth streaks)
- every foreign aristocrat (every company with 20+ year dividend growth streaks)
- 40 of the world’s best growth stocks
In other words, even among the world’s best companies, CMCSA is higher quality than 76% of them.
Why I Trust Comcast And So Can You
Comcast was founded in 1963 in Philadelphia, PA.
Comcast is a global telecom giant with:
- a core cable and fiber internet business that 61 million US homes and businesses subscribe to.
- NBC Universal that 57% of homes subscribe to and watch (CNBC, MSNBC, USA, NBC, and Universal Studios and theme parks)
- Sky, which it acquired in 2018, giving it a strong position in pay-tv in the UK, Germany, Italy, and Austria
(Source: FactSet Research Terminal)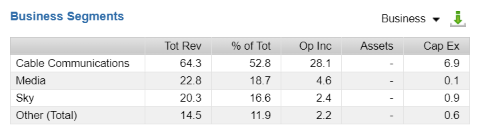
(Source: FactSet Research Terminal)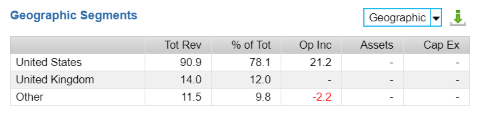
78% of revenue is from the US with 22% from the UK and the rest of Europe.
Investment Thesis Summary
Comcast is a wide moat business with significant scale and competitive advantages in most of its business units.
Its market share in broadband in the areas it operates in is about 67%, up from 52% 10 years ago. Morningstar believes CMCSA’s geographic and scale advantages should it remain the dominant fiber leader for the foreseeable future.
Comcast’s management of its content library has been excellent, as seen by its doubling of cash flows over the past 11 years.
Morningstar believes that the Sky acquisition for $50 billion in 2018 was a bit pricey but a strategically sound move, with solid execution.
SKY has 13 million subscribers in the UK or 45% of the entire population. With Comcast’s war chest backing it, Sky was able to obtain exclusive rights to the English Premier League.
Rolling Sky into the Comcast family promises to further enhance this content position, helping Sky cement its position with customers even as distribution methods change.” – Morningstar
Content is king and over 50% of Sky’s content is exclusive, which should help it survive and thrive in the rapidly changing media environment of the future.
- Sky is also a leading pay-tv provider in Italy, Germany, and Austria
(Source: investor presentation)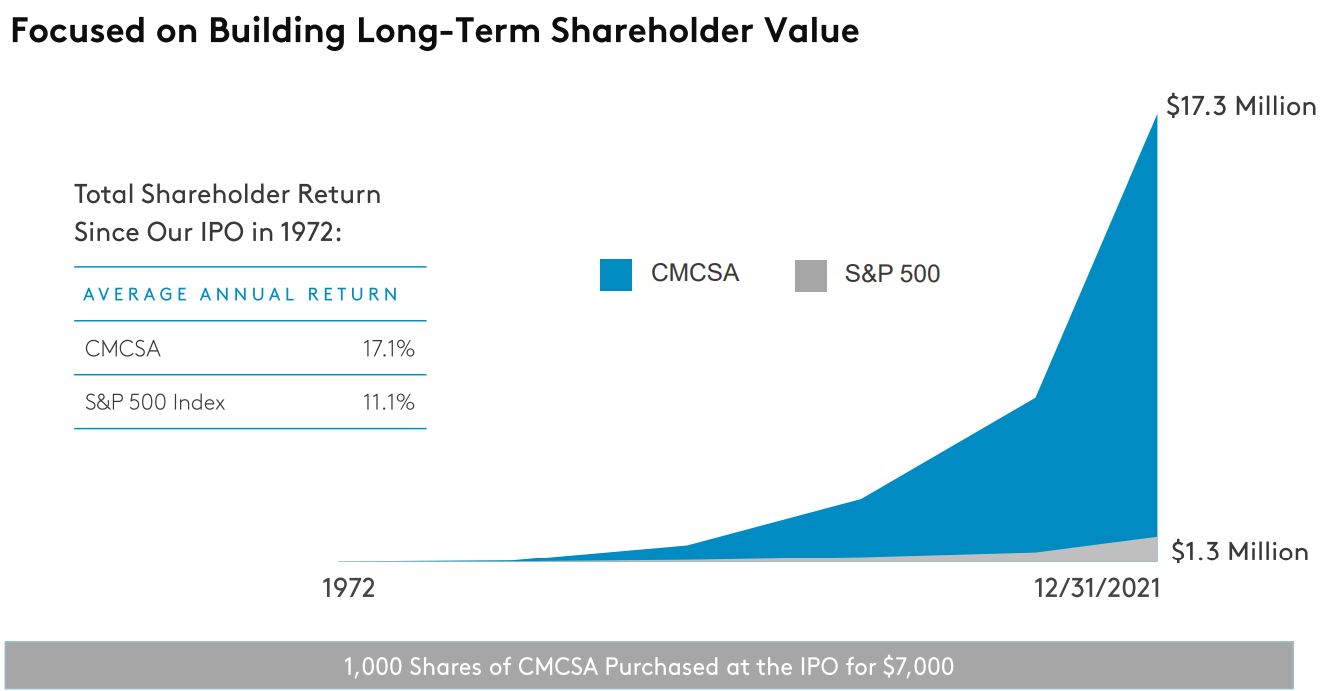
CMCSA is one of the greatest investments in history, delivering 17.1% annual returns since its 1972 IPO.
- $1,000 invested in CMCSA in 1972 is worth $2.5 million today
- S&P 500 just $186,000
- adjusted for inflation CMCSA delivered a 352X return vs the S&P 500’s 26X
- 13.5X better inflation-adjusted returns over 51 years
Quantitative Analysis: The Math Backing Up The Investment Thesis
Ben Graham recommended combining qualitative (the story) analysis with quantitative analysis looking at the past, present, and likely future.
CMCSA Credit Ratings
| Rating Agency | Credit Rating | 30-Year Default/Bankruptcy Risk | Chance of Losing 100% Of Your Investment 1 In |
| S&P | A- Stable Outlook | 2.50% | 40.0 |
| Fitch | A- Stable Outlook | 2.50% | 40.0 |
| Moody’s | A3 (A- equivalent) Stable Outlook | 2.50% | 40.0 |
| Consensus | A- Stable Outlook | 2.50% | 40.0 |
(Source: S&P, Fitch, Moody’s)
Rating agencies estimate CMCSA’s fundamental risk at 2.5% or a 1 in 40 chance of losing all your money over the next 30 years.
CMCSA Leverage Consensus Forecast
| Year | Debt/EBITDA | Net Debt/EBITDA (3.5 Or Less Safe According To Credit Rating Agencies) |
Interest Coverage (4+ Safe) |
| 2020 | 3.37 | 2.99 | 3.81 |
| 2021 | 2.73 | 2.48 | 4.86 |
| 2022 | 2.54 | 2.33 | 5.83 |
| 2023 | 2.45 | 2.28 | 6.16 |
| 2024 | 2.37 | 2.19 | 7.03 |
| 2025 | 2.21 | 2.11 | NA |
| 2026 | 1.98 | 1.92 | NA |
| 2027 | 1.85 | NA | NA |
| Annualized Change | -8.19% | -7.08% | 16.53% |
(Source: FactSet Research Terminal)
Leverage is coming down steadily while interest coverage is rising rapidly.
CMCSA Balance Sheet Consensus Forecast
| Year | Total Debt (Millions) | Cash | Net Debt (Millions) | Interest Cost (Millions) | EBITDA (Millions) | Operating Income (Millions) |
| 2020 | $103,760 | $11,740 | $92,020 | $4,588 | $30,826 | $17,493 |
| 2021 | $94,850 | $8,711 | $86,139 | $4,281 | $34,707 | $20,819 |
| 2022 | $94,560 | $7,062 | $86,731 | $4,044 | $37,167 | $23,590 |
| 2023 | $95,036 | $6,750 | $88,419 | $4,046 | $38,807 | $24,920 |
| 2024 | $97,252 | $7,559 | $89,976 | $3,910 | $41,098 | $27,490 |
| 2025 | $96,057 | $6,909 | $91,412 | $3,799 | $43,374 | NA |
| 2026 | $96,764 | $7,865 | $93,681 | $4,051 | $48,756 | NA |
| 2027 | $94,850 | $21,001 | NA | $4,123 | $51,266 | NA |
| Annualized Growth | -1.27% | 8.66% | 0.30% | -1.52% | 7.54% | 11.96% |
(Source: FactSet Research Terminal)
CMCSA’s debt is expected to remain stable over time around $90 billion net, with cash flows growing steadily.
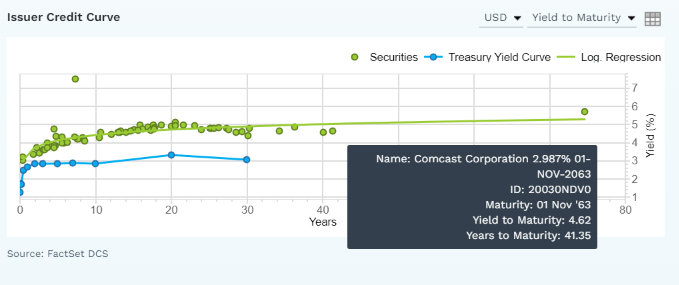
CMCSA Bond Profile
(Source: FactSet Research Terminal) (Source: FactSet Research Terminal)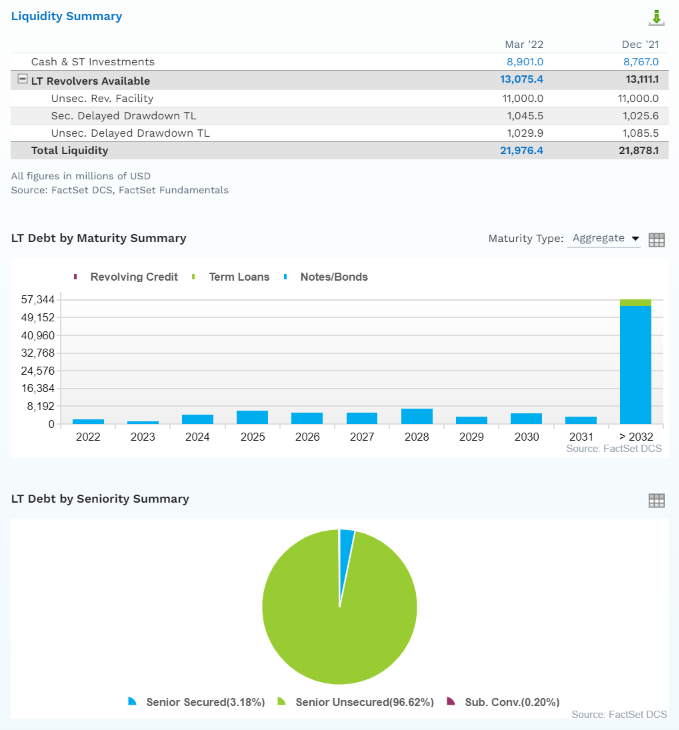
- $22 billion in liquidity
- well-staggered bond maturities (no problem refinancing maturing debt)
- 97% unsecured bonds for maximum financial flexibility
- bond investors so confident in CMCSA’s long-term prospects they are willing to lend to it for 41 years at 4.6% (3% originally)
- the average borrowing cost is 4.2%
- 1.7% after the bond market’s 30-year inflation expectations
- 1.7% real borrowing costs vs 8.5% cash returns on invested capital
CMCSA Credit Default Swaps: Real-Time Fundamental Risk Analysis From The Bond Market
(Source: FactSet Research Terminal)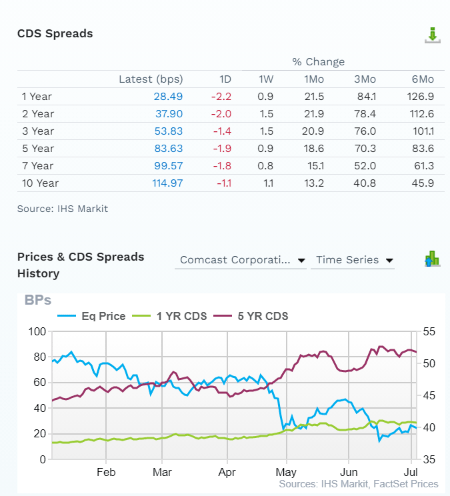
Credit default Swaps are the insurance policies bond investors take out against default.
- they represent real-time fundamental risk assessment from the “smart money” on Wall Street
- CMCSA’s fundamental risk has increased modestly in the last six months
- the bond market is pricing in a 3.45% 30-year default risk, which is consistent with its credit ratings
- basically, analysts, rating agencies, and the bond market all agree
- CMCSA’s thesis is intact
- 37 analysts, 8 rating agencies, and the bond market make up our CMCSA expert consensus
- 45 expert consensus + the bond market monitoring CMCSA’s risk profile
- how we track fundamental risk in real-time
- to ensure high-probability/low-risk investment recommendations
CMCSA GF Score: The Newest Addition To The DK Safety And Quality Model
The GF Score is a ranking system that has been found to be closely correlated to the long-term performances of stocks by backtesting from 2006 to 2021.” – Gurufocus
GF Score takes five key aspects into consideration. They are:
- Financial Strength
- Profitability
- Growth
- Valuation
- Momentum
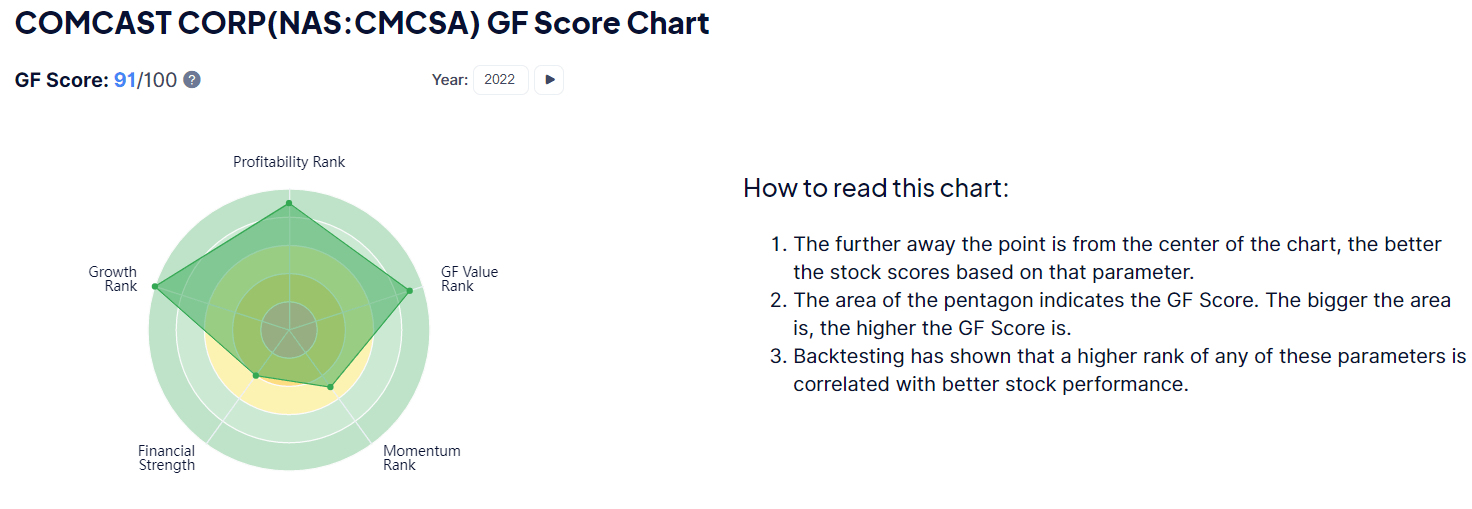
CMCSA’s excellent score of 91/100 confirms its very strong fundamental quality and very attractive valuation.
CMCSA Profitability: Wall Street’s Favorite Quality Proxy
(Source: GuruFocus Premium)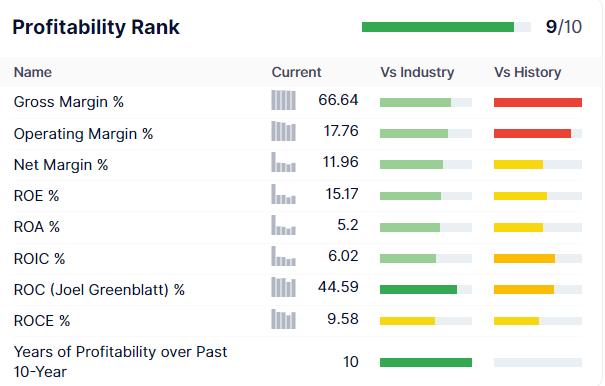
CMCSA’s profitability is historically in the top 10% of peers.
CMCSA Trailing 12-Month Profitability Vs Peers
| Metric | TTM | Industry Percentile | Major Communications Companies More Profitable Than CMCSA (Out Of 409) |
| Gross Margins | 66.64% | 76.41 | 96 |
| Operating Margin | 17.76% | 73.07 | 110 |
| Net Margin | 11.96% | 68.08 | 131 |
| Return On Equity | 15.17% | 66.58 | 137 |
| Return On Assets | 5.20% | 64.79 | 144 |
| Returns On Invested Capital | 6.02% | 60.93 | 160 |
| Return On Capital (Greenblatt) | 44.59% | 83.21 | 409 |
| Return On Capital Employed | 9.58% | 59.44 | 409 |
| Average | 22.12% | 68.31 | 130 |
(Source: GuruFocus Premium)
Profitability has taken a hit in the last year but return on capital is still in the top 17% of its peers.
Ycharts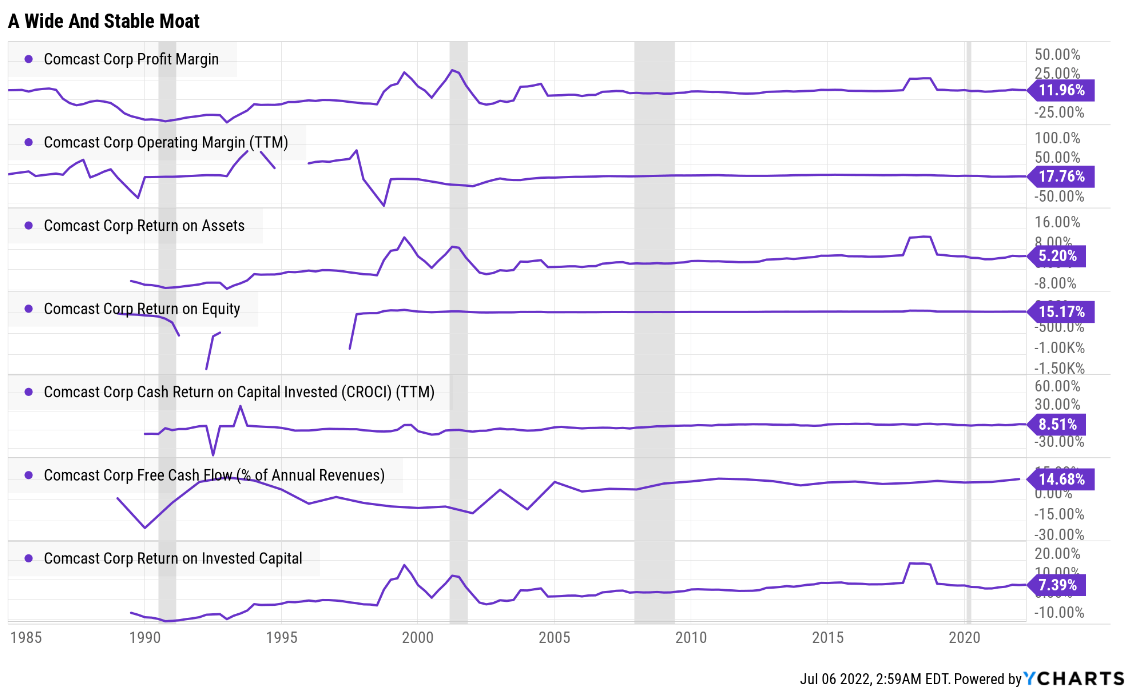
Over the last 30+ years, OKE’s profitability has been relatively stable.
- confirming a wide and stable moat
- FCF margin has been rising for over 20 years
- almost 15%
CMCSA Profit Margin Consensus Forecast
| Year | FCF Margin | EBITDA Margin | EBIT (Operating) Margin | Net Margin | Return On Capital Expansion |
Return On Capital Forecast |
| 2020 | 12.8% | 29.8% | 16.9% | 10.2% | 1.19 | |
| 2021 | 14.7% | 29.8% | 17.9% | 12.2% | TTM ROC | 44.59% |
| 2022 | 13.0% | 30.3% | 19.3% | 11.9% | Latest ROC | 42.70% |
| 2023 | 13.6% | 31.1% | 20.0% | 12.8% | 2024 ROC | 53.27% |
| 2024 | 14.5% | 31.9% | 21.4% | 13.5% | 2024 ROC | 51.01% |
| 2025 | 15.5% | 32.9% | NA | 14.0% | Average | 52.14% |
| 2026 | 16.5% | 35.7% | NA | 14.9% | Industry Median | 14.10% |
| 2027 | 17.6% | 36.1% | NA | 16.0% | CMCSA/Industry Median | 3.70 |
| Annualized Growth | 4.64% | 2.78% | 6.06% | 6.69% | Vs S&P | 3.57 |
| Annualized Growth (Post Pandemic) | 3.08% | 3.22% | 6.11% | 4.68% |
(Source: FactSet Research Terminal)
CMCSA’s margins are expected to steadily improve over time, with FCF margins rising to almost 18% by 2027.
Returns on capital are expected to grow 19% over the next three years, to 52%.
- return on capital is Joel Greenblatt’s gold standard proxy for quality and moatiness
- annual pretax profit/the money it takes to run the business
- 40% annual returns for 21 years
- one of the greatest investors in history
- S&P 500 ROC is 14.6%
- the average S&P investment takes about 7 years to pay for itself
- CMCSA’s ROC is expected to grow to 52%
- investment payback 2 years
- almost 4X better than the S&P and median industry peers
(Source: GuruFocus Premium)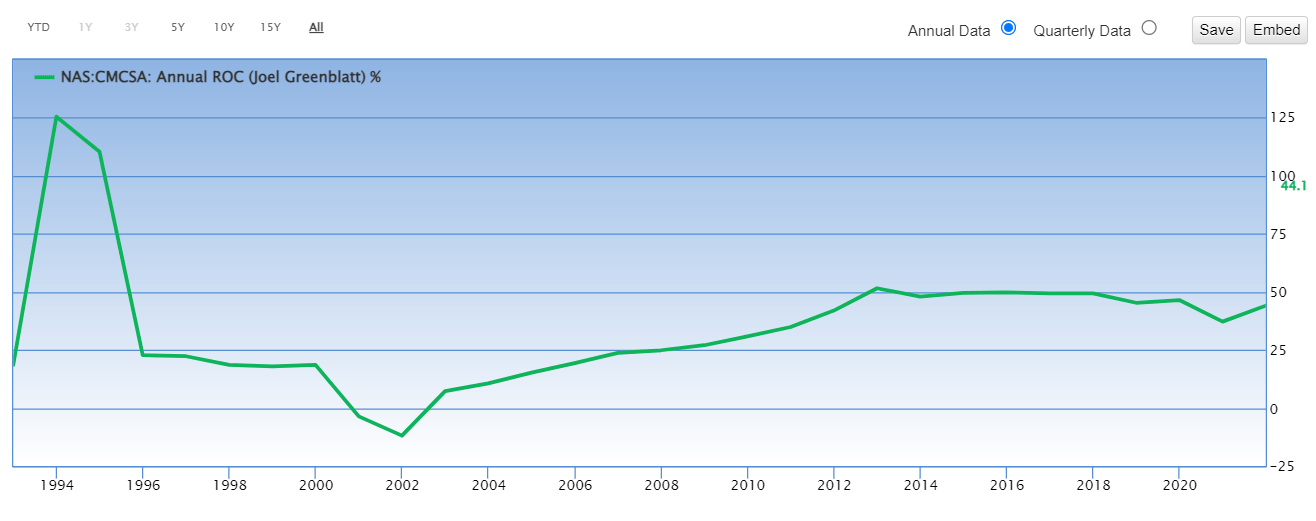
CMCSA’s ROC has been stable for 30 years, confirming its wide and stable moat.
Reason Three: Strong Growth Prospects As Far As The Eye Can See
Comcast is trading at 7.5X cash-adjusted earnings, which means, according to the Graham/Dodd fair value formula, it’s priced for about -2% growth.
Here’s what analysts actually expect.
CMCSA Medium-Term Growth Consensus Forecast
| Year | Sales | Free Cash Flow | EBITDA | EBIT (Operating Income) | Net Income |
| 2020 | $103,564 | $13,280 | $30,826 | $17,493 | $10,534 |
| 2021 | $116,385 | $17,089 | $34,707 | $20,819 | $14,159 |
| 2022 | $122,514 | $15,936 | $37,167 | $23,590 | $14,622 |
| 2023 | $124,584 | $16,940 | $38,807 | $24,920 | $15,956 |
| 2024 | $128,641 | $18,596 | $41,098 | $27,490 | $17,373 |
| 2025 | $131,774 | $20,381 | $43,374 | NA | $18,470 |
| 2026 | $136,730 | $22,540 | $48,756 | NA | $20,342 |
| 2027 | $142,167 | $25,039 | $51,266 | NA | $22,757 |
| Annualized Growth | 4.63% | 9.48% | 7.54% | 11.96% | 11.63% |
| Annualized Growth (Post Pandemic) | 3.39% | 6.57% | 6.72% | 9.71% | 8.23% |
| Cumulative Over The Next 6 Years | $786,410 | $119,432 | $260,468 | $76,000 | $109,520 |
(Source: FactSet Research Terminal)
CMCSA is growing its top line at a modest 3%, though its bottom line is growing at high single digits.
$119 billion in total free cash flow is expected through 2027.
CMCSA Dividend Growth Consensus Forecast
| Year | Dividend Consensus | FCF Consensus | FCF Payout Ratio | Retained (Post-Dividend) Free Cash Flow | Buyback Potential | Debt Repayment Potential |
| 2022 | $1.08 | $3.48 | 31.0% | $10,754 | 6.03% | 11.4% |
| 2023 | $1.16 | $3.96 | 29.3% | $12,547 | 7.03% | 13.2% |
| 2024 | $1.27 | $4.68 | 27.1% | $15,280 | 8.56% | 16.1% |
| 2025 | $1.35 | $5.41 | 25.0% | $18,193 | 10.20% | 18.7% |
| 2026 | $1.36 | $6.92 | 19.7% | $24,914 | 13.96% | 25.9% |
| 2027 | $1.48 | $8.89 | 16.6% | $33,204 | 18.61% | 34.6% |
| Total 2022 Through 2027 | $7.70 | $33.34 | 23.1% | $114,892.84 | 64.39% | 120.89% |
| Annualized Rate | 6.50% | 20.63% | -11.71% | 25.29% | 25.29% | 24.90% |
(Source: FactSet Research Terminal)
70% is the safety guideline for FCF payout ratios for telecoms according to rating agencies.
CMCSA is expected to grow the dividend at 6% to 7% annually over the next five years.
Comcast’s payout ratio this year is 31% and it’s expected to fall by 50% by 2027 to just 17%.
Post dividend retained free cash flow through 2027 is expected to be $115 billion, enough to pay off 120% of current debt or buy back as much as 64% of its stock at current valuations.
CMCSA Buyback Consensus Forecast
| Year | Consensus Buybacks ($ Millions) | % Of Shares (At Current Valuations) | Market Cap |
| 2022 | $12,130.0 | 6.8% | $178,439 |
| 2023 | $13,195.0 | 7.4% | $178,439 |
| 2024 | $14,665.0 | 8.2% | $178,439 |
| 2025 | $15,958.0 | 8.9% | $178,439 |
| 2026 | $16,000.0 | 9.0% | $178,439 |
| 2027 | $16,000.0 | 9.0% | $178,439 |
| Total 2022-2024 | $87,948.00 | 49.3% | $178,439 |
| Annualized Rate | 10.62% | Average Annual Buybacks | $14,658.00 |
(Source: FactSet Research Terminal)
Analysts expect CMCSA to buy back $88 billion worth of stock in the next six years, averaging almost $15 billion per year.
- at current valuations potentially up to 11% of shares repurchased each year
Ycharts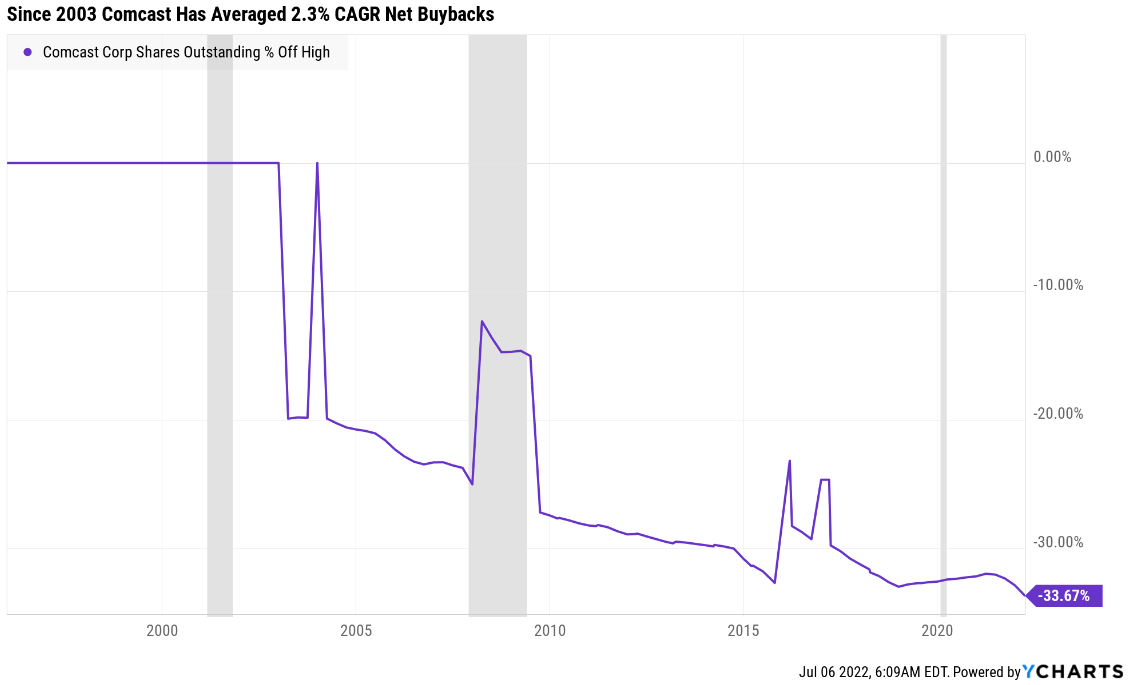
For the last 19 years, CMCSA has averaged 2.3% annual net buybacks.
| Time Frame (Years) | Net Buyback Rate | Shares Remaining | Net Shares Repurchased | Each Share You Own Is Worth X Times More (Not Including Future Growth And Dividends) |
| 5 | 2.3% | 88.93% | 11.07% | 1.12 |
| 10 | 2.3% | 79.08% | 20.92% | 1.26 |
| 15 | 2.3% | 70.32% | 29.68% | 1.42 |
| 20 | 2.3% | 62.53% | 37.47% | 1.60 |
| 25 | 2.3% | 55.61% | 44.39% | 1.80 |
| 30 | 2.3% | 49.45% | 50.55% | 2.02 |
(Source: DK Research Terminal, Ycharts)
If CMCSA continues its historical buyback rate, it will potentially repurchase 50% of its stock in the next 30 years, doubling the intrinsic value of your shares not counting EPS or dividend growth.
| Time Frame (Years) | Net Buyback Rate | Shares Remaining | Net Shares Repurchased | Each Share You Own Is Worth X Times More (Not Including Future Growth And Dividends) |
| 5 | 10.6% | 57.04% | 42.96% | 1.75 |
| 10 | 10.6% | 32.54% | 67.46% | 3.07 |
| 15 | 10.6% | 18.56% | 81.44% | 5.39 |
| 20 | 10.6% | 10.59% | 89.41% | 9.44 |
| 25 | 10.6% | 6.04% | 93.96% | 16.56 |
| 30 | 10.6% | 3.45% | 96.55% | 29.03 |
(Source: DK Research Terminal, FactSet)
At current valuations, if CMCSA buys back stock as aggressively as analysts expect, it could repurchase 97% of its stock, increasing the intrinsic value of your shares by 29X not counting EPS or dividend growth.
CMCSA Long-Term Growth Outlook
(Source: FactSet Research Terminal)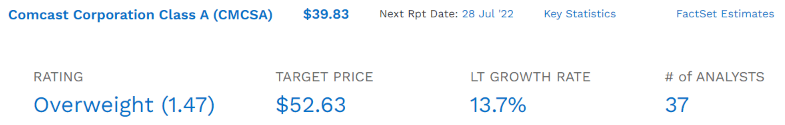
- 13.0% to 17.0% growth consensus range (five sources)
- the median consensus from all 37 analysts is 13.7%
FAST Graphs, FactSet FAST Graphs, FactSet
- Smoothing for outliers historical analyst margins-of-error are 5% to the downside and 15% to the upside
- margin-of-error adjusted consensus growth range: 12% to 20% CAGR
- 70% statistical probability that CMCSA grows 12% to 20% over time
FAST Graphs, FactSet FAST Graphs, FactSet FAST Graphs, FactSet
CMCSA’s historical growth rates are low to mid-double-digits and analysts think it will grow at a similar rate as the last eight years in the future.
Reason Four: A Wonderful Company At A Wonderful Price
(Source: FAST Graphs, FactSet)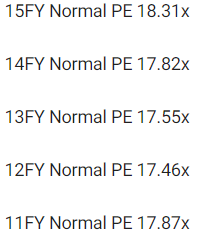
(Source: FAST Graphs, FactSet)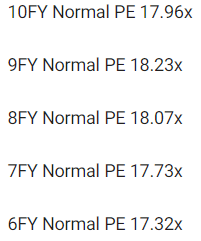
Over statistically significant time periods, CMCSA has been valued by hundreds of millions of income growth investors at 17.5X earnings to 18.5X earnings outside of bear markets and bubbles.
- 90% statistical probability the intrinsic value is within this range
| Metric | Historical Fair Value Multiples (11-Years) | 2021 | 2022 | 2023 | 2024 |
12-Month Forward Fair Value |
| 5-Year Average Yield | 1.99% | $50.25 | $54.27 | $54.27 | $63.82 | |
| 13-Year Median Yield | 1.70% | $58.82 | $63.53 | $63.53 | $74.71 | |
| 13-Year Average Yield | 1.51% | $66.23 | $71.52 | $71.52 | $84.11 | |
| Earnings | 18.07 | $58.37 | $64.69 | $73.18 | $83.48 | |
| Average | $57.86 | $62.89 | $64.71 | $75.58 | $63.83 | |
| Current Price | $39.83 | |||||
|
Discount To Fair Value |
31.16% | 36.66% | 38.45% | 47.30% | 37.60% | |
|
Upside To Fair Value (NOT Including Dividends) |
45.27% | 57.89% | 62.47% | 89.76% | 60.27% (62% including dividend) | |
| 2022 EPS | 2023 EPS | 2021 Weighted EPS | 2022 Weighted EPS | 12-Month Forward EPS | 12-Month Average Fair Value Forward PE |
Current Forward PE |
| $3.58 | $4.05 | $1.72 | $2.10 | $3.82 | 16.7 | 10.4 |
I conservatively estimate that CMCSA is historically worth about 16.7X earnings and today trades at 10.4X.
- 7.5X cash-adjusted PE
- an anti-bubble bargain by even private equity standards
|
Analyst Median 12-Month Price Target |
Morningstar Fair Value Estimate |
| $52.63 (13.0 PE) | $60.00 (15.7 PE) |
|
Discount To Price Target (Not A Fair Value Estimate) |
Discount To Fair Value |
| 24.32% | 33.62% |
|
Upside To Price Target (Not Including Dividend) |
Upside To Fair Value (Not Including Dividend) |
| 32.14% | 50.64% |
|
12-Month Median Total Return Price (Including Dividend) |
Fair Value + 12-Month Dividend |
| $53.71 | $61.08 |
|
Discount To Total Price Target (Not A Fair Value Estimate) |
Discount To Fair Value + 12-Month Dividend |
| 25.84% | 34.79% |
|
Upside To Price Target ( Including Dividend) |
Upside To Fair Value + Dividend |
| 34.85% | 53.35% |
Morningstar’s discounted cash flow valuation model estimates CMCSA is worth a more modest 15.7X earnings but still estimates a 34% discount to fair value with a 53% upside to fair value.
Analysts expect CMCSA to deliver 35% total returns in the next year and that only requires the PE to return to 13.
I don’t make recommendations based on 12-month forecasts but on whether the margin of safety is sufficient to compensate you for a company’s risk profile.
| Rating | Margin Of Safety For Medium-Risk 12/13 Super SWAN quality companies | 2022 Price | 2023 Price |
12-Month Forward Fair Value |
| Potentially Reasonable Buy | 0% | $62.89 | $64.71 | $63.83 |
| Potentially Good Buy | 10% | $56.60 | $58.24 | $57.45 |
| Potentially Strong Buy | 20% | $50.31 | $51.77 | $51.07 |
| Potentially Very Strong Buy | 30% | $39.62 | $45.30 | $44.68 |
| Potentially Ultra-Value Buy | 40% | $37.73 | $38.83 | $38.30 |
| Currently | $39.83 | 36.66% | 38.45% | 37.60% |
| Upside To Fair Value (Not Including Dividends) | 57.89% | 62.47% | 60.27% |
CMCSA is a potentially very strong buy and not far from an Ultra Value buy for anyone comfortable with its risk profile.
Risk Profile: Why Comcast Isn’t Right For Everyone
There are no risk-free companies and no company is right for everyone. You have to be comfortable with the fundamental risk profile.
What Could Cause CMCSA’s Investment Thesis To Break
- safety falls to 40% or less
- balance sheet collapses (highly unlikely, 2.5% probability according to rating agencies)
- the core business is disrupted by things like 5G internet
- growth outlook falls to less than 7.3% for six years
- CMCSA’s role in my portfolio is to deliver long-term 10+% returns with minimal fundamental risk
- 8+% total return requirement for defensive sectors (including midstream)
- 10+% for non-defensive (cyclical) sectors – like industrials
How long it takes for a company’s investment thesis to break depends on the quality of the company.
| Quality |
Years For The Thesis To Break Entirely |
| Below-Average | 1 |
| Average | 2 |
| Above-Average | 3 |
| Blue-Chip | 4 |
| SWAN | 5 |
| Super SWAN | 6 |
| Ultra SWAN | 7 |
| 100% Quality Companies (MSFT, LOW, and MA) | 8 |
These are my personal rule of thumb for when to sell a stock if the investment thesis has broken. CMCSA is highly unlikely to suffer such catastrophic declines in fundamentals.
Risk Profile Summary
- regulatory risk (potentially increasing costs and decreasing pricing power)
- disruption risk: T-Mobile is investing heavily into 5-G ultra-fast home internet, SpaceX and Amazon are investing in low-cost satellite internet
- M&A execution risk
- changing consumer tastes: cord-cutting
- talent retention risk in the tightest job market in 50 years
- cyber-security risk: hackers and ransomware
- currency risk: growing over time
(Source: FactSet Research Terminal)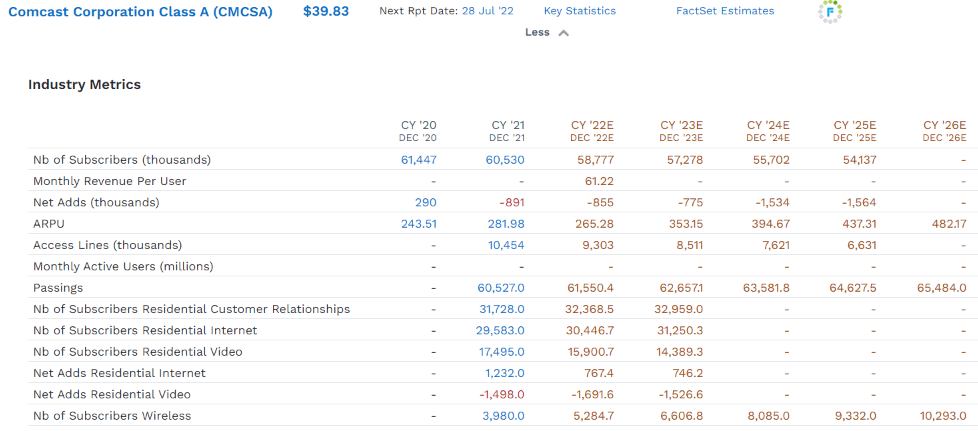
Analysts fully expect CMCSA’s subscriber base to shrink over time due to cord-cutting.
The average revenue per user growth of 11.4% to $480 is the key to CMCSA’s ability to grow at the rate analysts expect.
There is no guarantee that CMCSA can actually achieve this ARPU growth.
- buybacks are a strong growth booster but will face a headwind from falling subscribers over time
How do we quantify, monitor, and track such a complex risk profile? By doing what big institutions do.
Long-Term Risk Analysis: How Large Institutions Measure Total Risk
- see the risk section of this video to get an in-depth view (and link to two reports) of how DK and big institutions measure long-term risk management by companies
CMCSA Long-Term Risk-Management Consensus
| Rating Agency | Industry Percentile |
Rating Agency Classification |
| MSCI 37 Metric Model | 70.0% |
BBB Average, Positive Trend |
| Morningstar/Sustainalytics 20 Metric Model | 67.9% |
24.8/100 Medium-Risk |
| Reuters’/Refinitiv 500+ Metric Model | 90.0% | Good |
| S&P 1,000+ Metric Model | 40.0% |
Below-Average, Stable Trend |
| Just Capital 19 Metric Model | 40.0% | Below-Average |
| FactSet | 30.0% |
Below-Average, Stable Trend |
| Morningstar Global Percentile (All 15,000 Rated Companies) | 57.8% | Average |
| Just Capital Global Percentile (All 954 Rated US Companies) | 57.4% | Average |
| Consensus | 57% |
Medium-Risk, Average Risk-Management, Stable Trend |
(Sources: MSCI, Morningstar, FactSet, S&P, Just Capital, Reuters)
CMCSA’s Long-Term Risk Management Is The 313th Best In The Master List (37th Percentile)
| Classification | Average Consensus LT Risk-Management Industry Percentile |
Risk-Management Rating |
| S&P Global (SPGI) #1 Risk Management In The Master List | 94 | Exceptional |
| Strong ESG Stocks | 78 |
Good – Bordering On Very Good |
| Foreign Dividend Stocks | 75 | Good |
| Ultra SWANs | 71 | Good |
| Low Volatility Stocks | 68 | Above-Average |
| Dividend Aristocrats | 67 | Above-Average |
| Dividend Kings | 63 | Above-Average |
| Master List average | 62 | Above-Average |
| Hyper-Growth stocks | 61 | Above-Average |
| Monthly Dividend Stocks | 60 | Above-Average |
| Comcast | 57 | Average |
| Dividend Champions | 57 | Average |
(Source: DK Research Terminal)
CMCSA’s risk-management consensus is in the bottom 37% of the world’s highest quality companies and similar to that of such other blue-chips as
- Realty Income (O) – dividend aristocrat
- Polaris (PII) – dividend champion
- Albemarle (ALB) – dividend aristocrat
- Raytheon (RTX) – dividend champion
- Church & Dwight (CHD) – dividend aristocrat
- Essex Property Trust (ESS) – dividend aristocrat
- Broadcom (AVGO)
- Norfolk Southern (NSC)
The bottom line is that all companies have risks, and Comcast is average at managing theirs.
How We Monitor CMCSA’s Risk Profile
- 37 analysts
- 3 credit rating agencies
- 8 total risk rating agencies
- 45 experts who collectively know this business better than anyone other than management
- and the bond market for real-time fundamental risk updates
“When the facts change, I change my mind. What do you do sir?” – John Maynard Keynes
There are no sacred cows at iREIT or Dividend Kings. Wherever the fundamentals lead we always follow. That’s the essence of disciplined financial science, the math behind retiring rich and staying rich in retirement.
Bottom Line: Comcast Is An Anti-Bubble Bargain That Could Potentially 3.5X In 5 Years
I can’t tell you when CMCSA will bottom, that’s likely to depend on a lot of macro and company-specific factors. If the stock market drops up to 25% more, as some blue-chip economist teams expect, I’d be surprised if CMCSA didn’t fall more.
But stocks don’t stop falling because bad news stops coming but when the bad news is fully priced in.
FAST Graphs, FactSet Research
But guess what? Comcast is already pricing in a severe recession and that’s not what most economists think is coming.
Deutsche Bank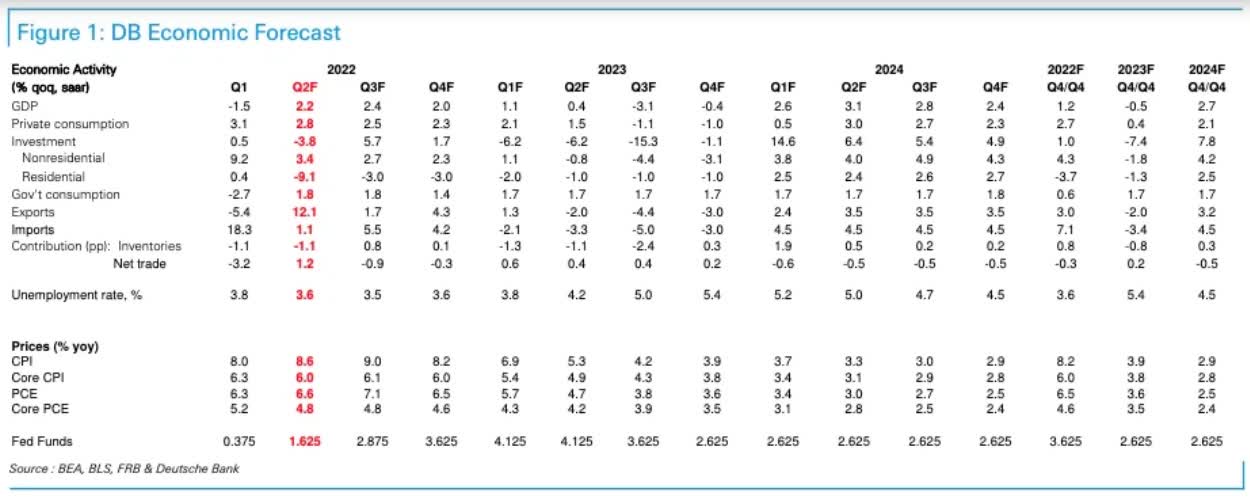
In fact, we’re likely facing a mild recession in 2023, the 2nd mildest in history according to Deutsche Bank’s latest forecast.
“The intelligent investor is a realist who buys from pessimists, and sells to optimists.” – Ben Graham, The Intelligent Investor
Here’s what I can tell you with high confidence about CMCSA right now.
- CMCSA is one of the world’s safest, most dependable, and highest quality companies on earth
- top 24% of the world’s best companies
- 2.7% steadily growing very safe yield
- 16.4% CAGR long-term total return potential
- 38% discount to fair value = potential reasonable buy
- 7.5X cash-adjusted earnings
- about 250% consensus return potential over the next five years, 25% CAGR, 4X more than the S&P 500
- More than 2X better risk-adjusted expected returns of the S&P 500 over the next five years
If you’re tired of praying for luck on Wall Street, how about making your own luck. Not with speculative tech stocks, crypto, or SPACs, but with potentially some of the world’s best anti-bubble blue-chip bargains, like Comcast.
When you entrust your hard-earned savings to the proven income and wealth compounders like CMCSA, retiring in safety and splendor doesn’t require like, but only time, discipline, and patience.
Be the first to comment