

RelaxFoto.de
Investment Summary
Shares of Collegium Pharmaceutical, Inc. (NASDAQ:COLL) have popped onto the radar after the stock rallied 86% of its October 52-week lows. Two, perhaps three main catalysts discussed here look to be responsible for the drive up the page. Investors have re-rated COLL back to multi-year highs as a result [Exhibit 1], begging the question as to whether it is now a buy. Having missed the rally, we sought to answer this with a data-driven approach, opting to look at numbers over narrative. Net-net, we rate COLL a buy, valuing the stock at just 3.6x forward earnings.
Exhibit 1. Investors have re-rated COLL back above multi-year highs following October-date rally
Data: Updata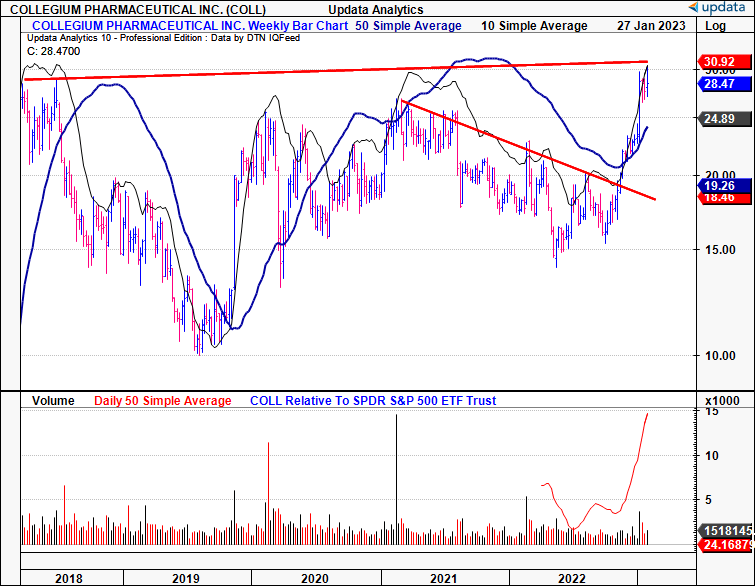
Catalysts driving COLL rally
The broad indices caught the last wave of a relief rally back in October last year, sending the bulk of equities with some level of correlation to the benchmark higher. This was the first catalyst for CALL to re-rate to the upside, and was largely beta-driven [Exhibit 2].
Exhibit 2. October–December rally driven by equity beta to the benchmark
Data: Updata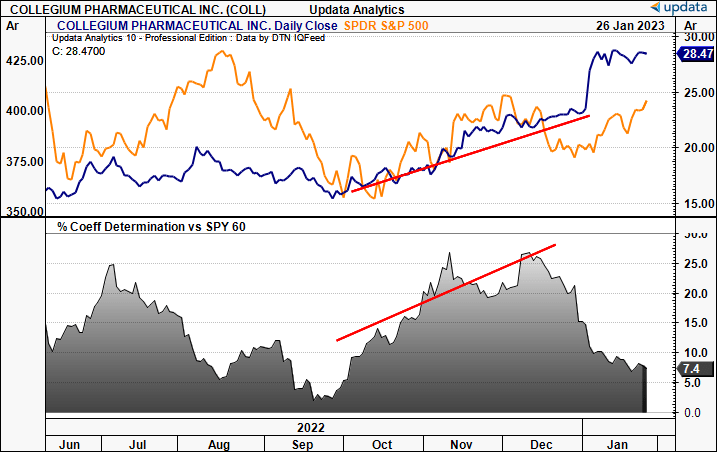
Second, the major uptick in late December was fuelled by COLL’s announcement that the U.S. District Court for the District of Delaware upheld its judgement regarding patent protection for COLL’s Belbuca label. The court found that Alvogen Pb Research & Development’s competitor to Belbuca is barred from entering the market until 2032. This opens up an interesting debate on patents in pharmaceuticals and biotech. On the one hand, the outcome is good for COLL in that it’s Belbuca revenues are protected, thereby retaining its market share. However, it also dampens innovation around the space, preventing competing labels to enter, along with the detrimental effects to competition.
Second driver came in January when the company released its FY23′ top-line and adjusted EBITDA estimates. This is a peculiar move, given that it hasn’t posted its full-year results for the previous year just yet. For the coming 12 months, COLL projects net product revenues of $580mm at the upper end of the range on adjusted EBITDA of $370mm at the upper end. This calls for 27% and 38% YoY growth from consensus FY22E’ estimates, respectively. Following the update, investors added ~$5 per share to COLL’s equity. Aside from this, management authorized a $100mm buyback over the coming $12 months, noting it has returned $4mm in repurchases since November 2022.
We argue this doesn’t change the fundamental backdrop for the company, nor the investment opportunity [or lack thereof].
We’d remind investors that a company generates value when its return on invested capital (“ROIC”) is high and exceeds the cost of capital, meaning it needs to reinvest a smaller portion of post-tax earnings to grow. In this regard, sales and EBITDA growth aren’t the best measures of value creation. The best companies can invest a small amount of capital at tremendously high returns, leaving the remaining cash available for shareholders. This inevitably increases the value of the firm. Take a closer look at the spread of COLL’s ROIC to the WACC hurdle since Q3 FY21′ – each subsequent quarter it was negative, leading to a cumulative negative $60mm in economic loss over this period [Exhibit 3, Exhibit 4]. Its upcoming full-year numbers are therefore crucial to reverse this.
Exhibit 3. Cumulative economic loss of $60mm since Q3 FY21′, upcoming full-year numbers are therefore crucial.
Data: Author, using data from COLL SEC Filings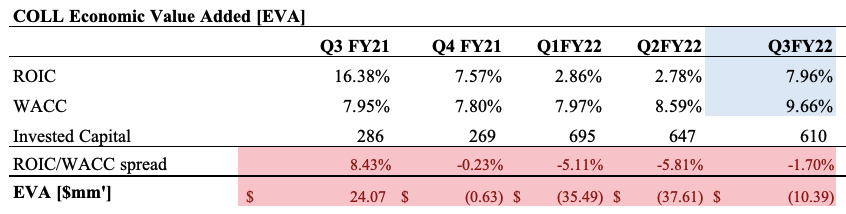
Exhibit 4.
Data: Author, using data from COLL SEC Filings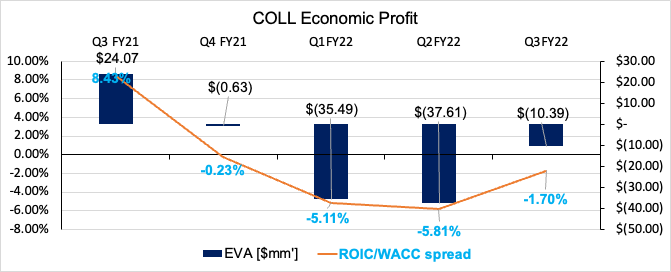
The above looks at what the returns on capital were for each respective quarter, using a rolling T12M basis. What about on a cumulative basis? Here, we looked back over the pandemic period to see how value’s been created to date. COLL needed to reinvest ~58% of its post-tax earnings (“NOPAT”) over this time in order to generate a cumulative $413mm. In effect, it had to invest an additional $240mm to generate an additional $44mm in NOPAT growth from Q1 FY20′, generating a return on incremental invested capital of 18.43% [Exhibit 6]. Both measures, that are also key drivers to value, led to a 10.67% growth rate over the testing period, not far behind the stock’s geometric growth over this period [Exhibit 6].
Exhibit 5.
Data: Author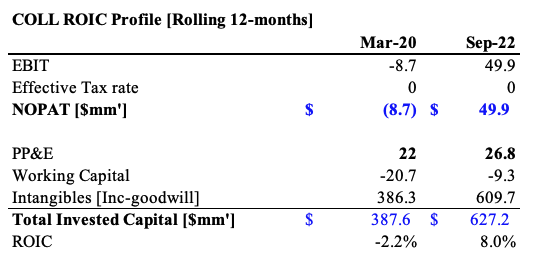
So, reinvesting 58% of post-tax earnings, leading to a ~10.7% growth rate over this time. This doesn’t seem like a strong value proposition, nor a company that can sustainably grow at 27–38%. We’d also note that NOPAT and ROIC are better measures to use for COLL as they ignore the effect of leverage to ROE, and the company has $732mm in total debt on the balance sheet, ~76.6% of total market cap, and more than 78% of total capital.
Exhibit 6.
Data: Author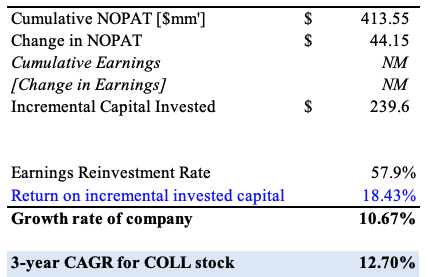
Market originated data for COLL
One key feature of the rally has been the tremendous surge in inflows to COLL’s equity since the rally began in October last year [Exhibit 7]. Relative strength against the benchmark has been notable as well.
Exhibit 7. Heavy inflows into COLL equity across rally
Data: Updata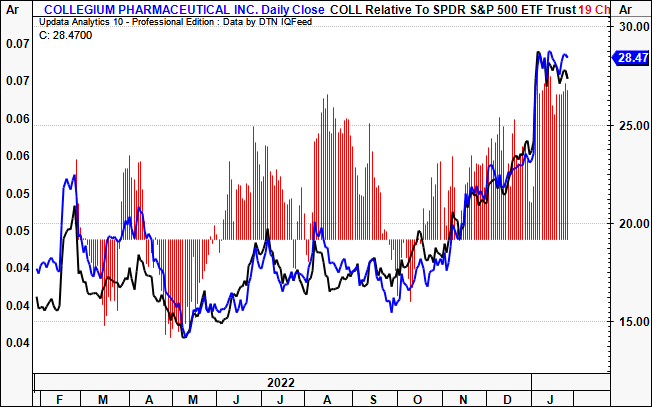
However, we’d also point out it’s the type of demand/buyer that matters in sustaining the rally beyond its recovery point. You’ll see below, via the negative volume index, that large/institutional buyers have been absent across the entire span of the rally. Instead, it’s been mainly retail inflows, as evidenced by uplift in the positive value index. Hence, we find the stock’s ability to extend this rally further to be suspicious.
Exhibit 8. Absence of large buyers participating across rally
Data: Updata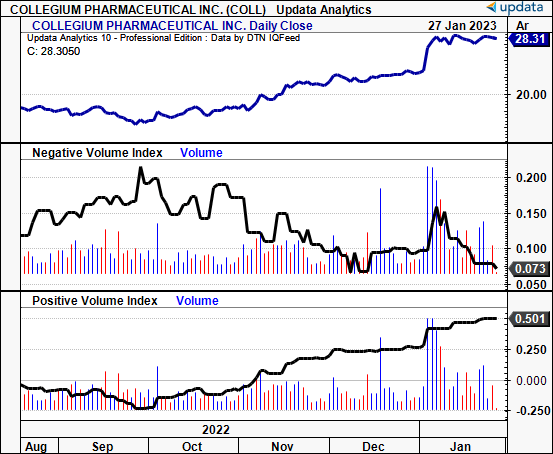
Valuation
It’s worth noting that COLL is trading at 5.9x forward earnings, 70% below the sector median. Immediately the question arises if we have a value proposition here.
Multiples are shorthand for the valuation process, and, if calculated correctly, represent what we should be paying for an equity investment. Market-based P/E’s also illustrate our payback period, assuming the company can pay 100% of its earnings to shareholders into perpetuity, and assuming no growth.
Let’s run through a very basic hypothetical example to highlight the conceptual importance, using COLL’s numbers in the process. Imagine a hypothetical company was up for sale and was asking a $955mm valuation, or $28.43 per share [COLL’s current market value]. Say it’s set to produce $174mm in earnings and $4.82 in EPS for FY22′ [COLL’s consensus non-GAAP estimates]. Said company is therefore valuing itself at 5.9x earnings.
Say we’re happy to pay this multiple, we’d need to command a rate of return to compensate for this. In effect, we are asking to pay $28.43 to get 16.9% per year in return [the earnings yield]. So, pay $28.43 at 5.9x P/E, get 16.9% return, for $4.82 net profit per share.
Imagine now, the company generates no future value – i.e., delivers a ROIC in-line with its cost of capital [hence, no earnings growth, $4.82 earnings per year into perpetuity]. How long until we breakeven from the distributable cash flows we are entitled to? Said another way, at a 5.9x multiple, it will take us 5.9 years to get our money back [ 100% of $4.82 profit per share x 5.9 = $28.43 return].
As you may well know, in the debate on valuation, it’s not just profitability that matters. It equally matters what we actually pay. Say a competing bid came in at $35 per share valuation. There’s no change to the EPS, only the price paid for the acquisition. The competitor would pay 35/4.82 = 7.26x earnings. Not only is it more expensive, but, ceteris paribus, the payback period is now 7.26 years. Arguably, they are overpaying as well.
Obviously, these rudimentary assumptions are unrealistic in the real world, and are suspect to change with different levels of profitability. Which is exactly why examining ROIC, reinvestment rate and growth is so essential in understanding the right price to pay. That way, we can understand if paying a high [or low] multiple is worth it or not. Remember, price is what you pay, value is what you get. So price really means nothing if we are getting the value to back this up.
As mentioned earlier, a high ROIC means a company needs to reinvest less of its profits [either NOPAT or earnings] to generate additional growth/value. We said COLL generated 18.43% in return on incremental capital and can sustainably grow NOPAT at 10.7%. But it requires a ~58% reinvestment into additional capital to sustain this growth rate, meaning 42% of earnings is left in free cash to equity holders. So, every additional dollar in NOPAT growth costs $0.58. Turning back to our example, that uses COLL’s numbers, suppose we wanted a better understanding of what our hypothetical investment will get us, to gauge what is the best price to pay.
We’d do this by estimating the free cash available to equity holders into perpetuity, and then discount these back at the cost of capital, this case, COLL’s WACC at 14%. At the stipulated figures above, the firm would be fairly valued at just $631mm – well below the asking price of $950mm – otherwise, 3.63x earnings, or $17.50/share, to make it worth our while [Exhibit 9]. Moreover, factoring in the required investment to grow 10.7%, the payback period moves to 9 years. Note, these calculations exclude any return of capital in the form of share buybacks.
Exhibit 9. If we hold the current levels of growth and reinvestment forward, we believe COLL is fairly valued at 3.63x earnings.
Data: Author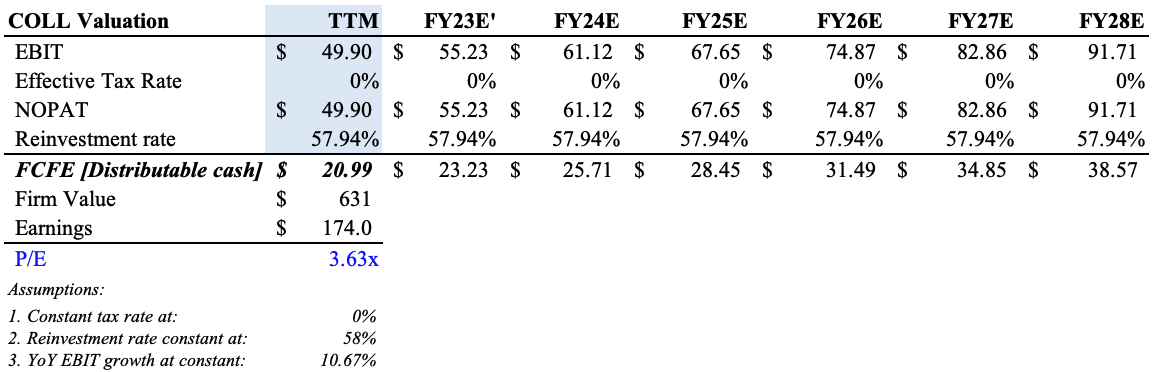
Say the ROIC was 25% to get 10.67% growth, then the reinvestment rate drops to 42.68% – then we’d be prepared to justify an 8x P/E at this level of growth, also meaning we’d be getting a good deal – market value of 5.9x earnings, when it’s worth 8x earnings. Problem is, COLL is forecasting substantial adjusted EBITDA growth in FY23′, and our calculations reveal this will come at a high cost, around 140% of NOPAT at an 18.4% ROIIC.
Hence, we believe it is currently overvalued, and, whilst the growth in P&L items is well received, as demonstrated, this doesn’t make it a good value proposition for investors.
In short
Revenue and adjusted EBITDA growth are really just two factors that illustrate momentum, not necessarily an increase in value. To generate value for equity holders, a company must earn a high ROIC above the cost of capital, to either: a). reinvest profits at high rates of return, or b). leave a high percentage of cash to distribute to equity holders. COLL doesn’t achieve this in our opinion, despite its projected growth percentages for 2023. It appears the projected growth rates will come at a substantial cost to shareholder value, and so we believe the stock deserves to trade at its low multiple of 5.9x FY22E’ EPS. Net-net, we rate COLL a hold.
Be the first to comment