

Sundry Photography/iStock Editorial via Getty Images
Price Action Thesis
Cloudflare, Inc. (NYSE:NET) has been a challenging call for us. We were very cautious in 2021, as we highlighted its steep valuation. Then, we turned bullish near the start of 2022, thinking the sell-off in NET stock was done soon. We were wrong! We turned bullish way too early and should not have upgraded our rating.
So, we asked ourselves what we got wrong that the market knew (Don’t argue with the market. Instead, learn from the market). We realized it was the same argument that we used in 2021: valuation! Nothing has changed. NET stock was overvalued in 2021, was overvalued at the start of 2022, and is still overvalued at the current levels.
Therefore, we think it’s crucial to regard any opportunity in NET stock as a speculative exposure. Investors should use price action as a critical basis to evaluate how the market intends to value NET stock. Also, put in place take-profit entries using sell-limit orders. Also, use stop-loss risk management with appropriate sell-stop orders to prevent outsized drawdowns. That approach we use when entering speculative opportunities should have been our approach with NET stock.
Therefore, we share the critical levels investors need to watch to assess an entry/add exposure opportunity in NET stock.
Given the current price action dynamics, we believe it’s appropriate to revise our rating from Buy to Hold. We will reassess our rating if the price action becomes more constructive or if it re-tests its near-term support with a bear trap.
Investors Must Pay Attention To The Bull Traps
NET price chart (monthly) (TradingView)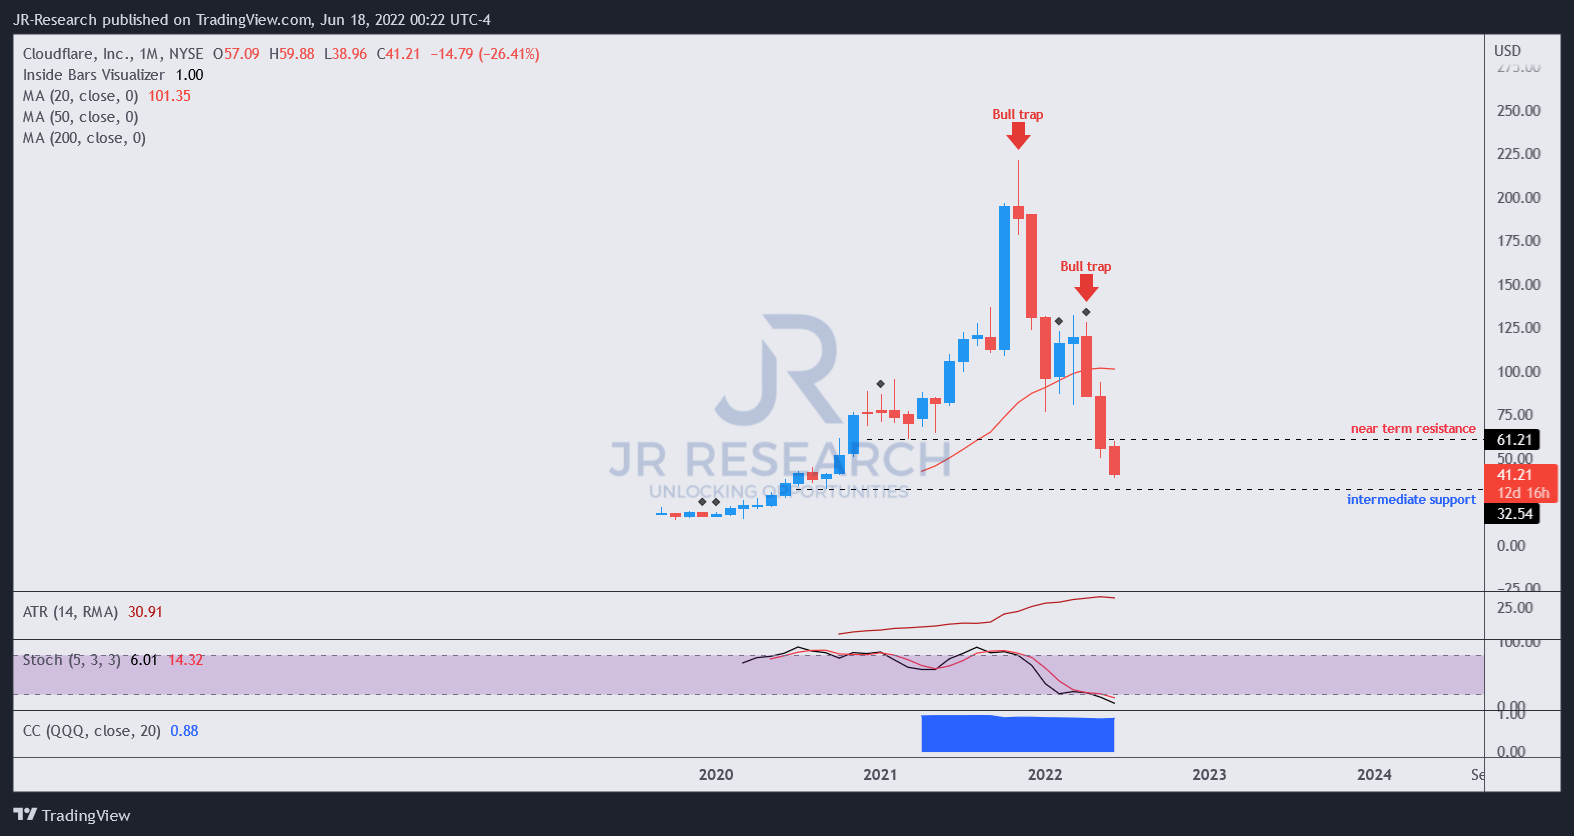
A cursory glance at its monthly chart unveils startling clues to the significant bull trap in November 2021. We saw the bull trap and were very cautious as we waited for the market to force a rapid liquidation.
Therefore, as expected, a steep selloff occurred in December, leading us to believe that the decline was over as the market crushed the greedy buyers at the top. However, we were wrong. We didn’t apply our price action discipline appropriately, as we should have waited for a re-test of support.
NET price chart (weekly) (TradingView)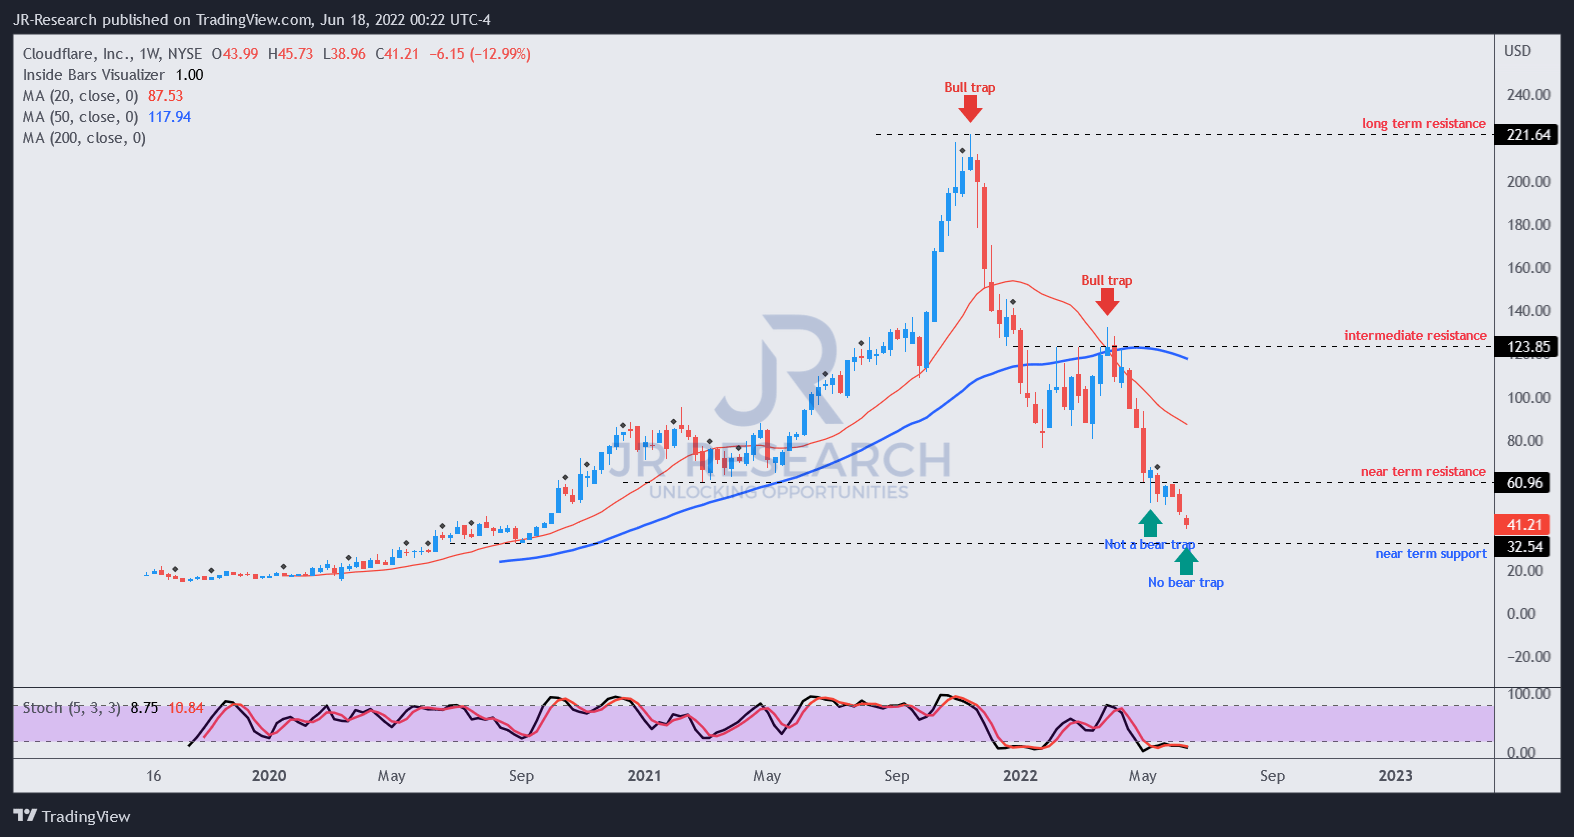
Zooming into its weekly chart, we can better glean the steep decline in December. The selldown brought NET stock to its 50-week moving average (blue line), which has sustained its advance over the past two years.
As a result, we turned bullish pre-maturely (and proven wrong by the market), thinking the selldown was over. But we should have known better. Our price action discipline has often espoused an effective re-test, creating a validated bear trap before considering adding exposure. Without it, a near-term bottom is unlikely to sustain as the market continues to draw in dip buyers astutely.
That was exactly what happened. The market continued its astute distribution phase from January to March, drawing in dip buyers astutely and quietly. Then, it formed another significant bull trap at the end of March (which we also missed previously) that confirmed the bearish bias in NET stock. Notably, that should have given us a warning sign to cut exposure from our earlier positions and bail out.
Otherwise, we should also have used a stop-loss risk management strategy to prevent deep drawdowns if a steeper sell-off occurs.
Consequently, another rapid liquidation occurred after its three-month distribution phase, as the market forced more selling.
Crucially, we have not observed any significant bear traps that could help stanch the selling pressure and reverse its momentum.
Cloudflare Stock Remains Overvalued
| Stock | NET |
| Current market cap | $13.44B |
| Hurdle rate (CAGR) | 30% |
| Projection through | CQ2’26 |
| Required FCF yield in CQ2’26 | 2% |
| Assumed TTM FCF margin in CQ2’26 | 10% |
| Implied TTM revenue by CQ2’26 | $7.68B |
NET stock reverse cash flow valuation model. Data source: S&P Cap IQ, author
It’s pretty simple to visualize why NET stock is still overvalued, even at the current levels. First, we used an aggressive hurdle rate of 30%, which we think is appropriate for a speculative growth stock. But, we applied a relatively lenient free cash flow yield (FCF) of 2%. Then, using an assumed FCF margin of 10% by CQ2’26, we require Cloudflare to post a TTM revenue of $7.68B by CQ2’26.
Before that, investors should note that Cloudflare is estimated to post an FCF margin of -5.7% in FY22. Its long-term model suggests a non-GAAP operating margin of more than 20%. But, we think it’s implausible for Cloudflare to reach the profitability guided by its long-term model by FY26.
Consequently, we require Cloudflare to deliver a revenue CAGR of 73.9% through CQ2’26. We think it’s safe to say that it’s an “impossible” task for Cloudflare, even for the most optimistic investor.
Is NET Stock A Buy, Sell, Or Hold?
We revise our rating on NET stock from Buy to Hold. Our saving grace was we applied prudent capital allocation to our exposure in NET, limiting it to just 2% of our portfolio average cost.
Therefore, we have not been significantly impacted, reminding us of the critical importance of disciplined capital allocation for “high-growth” opportunities. But, NET stock should never have been regarded as other highly FCF profitable high-growth stocks, given its weak FCF margins.
It should have been regarded as a speculative stock, and therefore we should use its price action to add/cut exposure, given its poor fundamentals and overvaluation.
NET stock is a sober reminder and lesson for us; we hope investors can learn from it.
Be the first to comment