

da-kuk
Introduction
Getting to the main pages of the Cornerstone Strategic Value Fund (NYSE:CLM) and the Cornerstone Total Return Fund (NYSE:CRF), a potential investor may have some of these questions:
- What is the fundamental difference between these two CEFs (closed-end funds)?
- What explains their high dividend yield of >24%?
- Is it worth buying these funds now, when their prices have fallen sharply since the beginning of the year?
In today’s article, I will try to address these questions.
CLM vs. CRF – What’s the difference?
First off, we need to decide what constitutes the essence of closed-end funds and how they fundamentally differ from, say, ETFs (exchange-traded funds).
According to Investopedia, a closed-end fund is a type of mutual fund that issues a fixed number of shares through a single initial public offering (IPO) to raise capital for its initial investments. Like many mutual funds, a closed-end fund has a professional manager who oversees the portfolio and actively buys, sells, and holds assets. ETFs, on the other hand, are free to create or redeem shares continuously through an Authorized Participant when AUM rises/falls, which is not the case with CEFs. Because of the latter feature, CEFs usually trade at a premium or discount to their NAV (net asset value) based on the market demand while ETFs trade more or less close to their NAVs.
Now that we understand the difference between CEFs and ETFs, let’s break down the difference between CLM and CRF.
| Metric/CEF’s Name | Cornerstone Strategic Value Fund or just “CLM” | Cornerstone Total Return Fund or just “CRF” |
| Description | Incorporated in Maryland on May 1, 1987. It seeks to invest in stocks of companies operating across diversified sectors. The fund primarily invests in value and growth stocks of companies. It also invests through other closed-end investment companies and ETFs. | Incorporated in New York on March 16, 1973. The fund seeks to invest in stocks of companies operating across diversified sectors. It primarily invests in value and growth stocks of companies across all market capitalizations. The fund also invests through other closed-end investment companies and ETFs. |
| Investment objective | To seek long-term capital appreciation through investment in equity securities of U.S. and non-U.S. companies. The Fund’s investment adviser uses a balanced approach, including “value” and “growth” investing by seeking out companies at reasonable prices, without regard to sector or industry, which demonstrate favorable long-term growth characteristics. | Capital appreciation with current income as a secondary objective. The Fund’s investment adviser uses a balanced approach, including “value” and “growth” investing by seeking out companies at reasonable prices, without regard to sector or industry, which demonstrate favorable long-term growth characteristics. |
| Limitations | May invest without limitation in other closed-end investment companies and ETFs, provided that the Fund limits its investment in securities issued by other investment companies so that not more than 3% of the outstanding voting stock of any one investment company will be owned by the Fund. | It may invest up to 10% of its assets in other closed-end investment companies. |
| # of holdings | 166 | 185 |
| % of top-10 holdings | 47.2% | 37.27% |
| Expense ratio | 1.12% | 1.15% |
| Benchmark | S&P 500 TR USD | S&P 500 TR USD |
Source: Author’s work based on Cornerstone’s official website and Seeking Alpha
I could not find any significant difference between these two funds: both have the same investment objectives and roughly similar instruments in their holdings structure; their expense ratios are roughly the same; and the management principles are similar.
What immediately catches the eye is the weight of the top 10 holdings in the structure of the fund portfolios. Here you can see how they look in detail:
Seeking Alpha’s data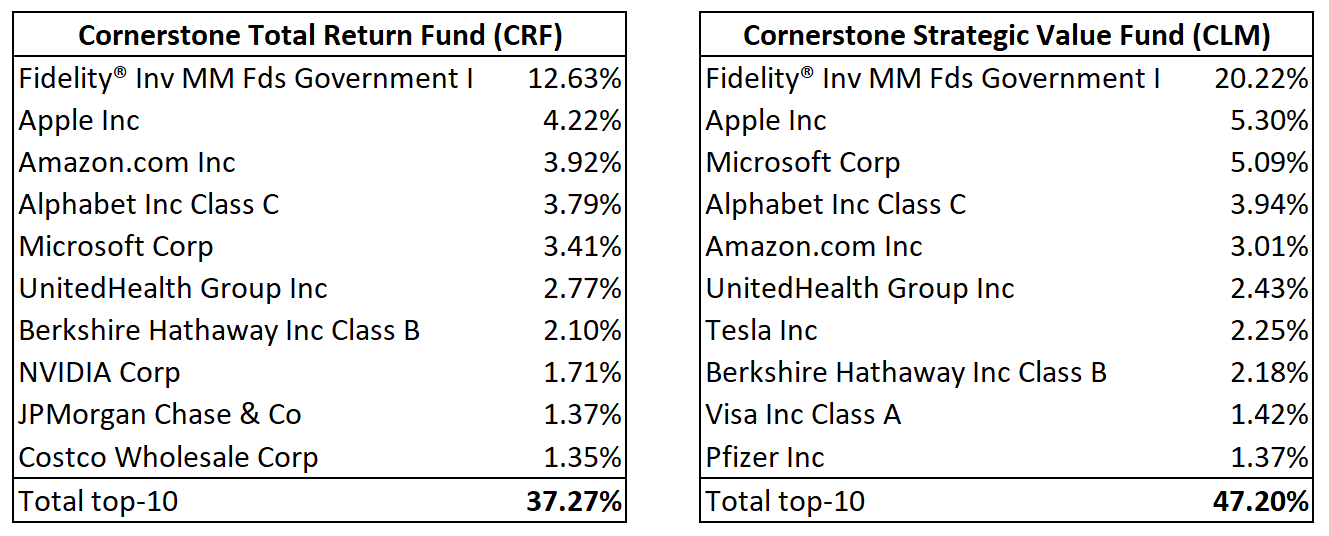
Structurally, I favor CLM because its portfolio is 20% invested in (FIGXX) – an open-ended equity mutual fund that typically invests at least 99.5% of its total assets in cash, U.S. government securities, and/or fully collateralized repurchase agreements. In today’s difficult times, CLM can thus hold its own better than its CRF cousin, both in terms of returns and volatility.
The difference in risk/return is insignificant, but it is there.
What explains these CEFs’ 20%+ dividend yield?
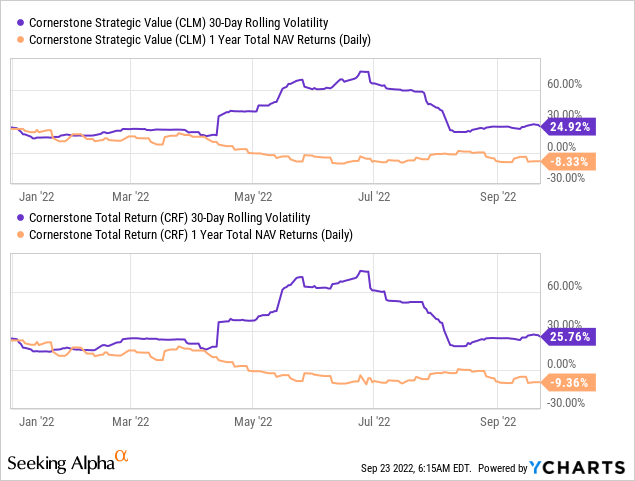
When chaos reigns – now the S&P 500 Index (SPY) and the NASDAQ 100 Index (QQQ) are down -17.81% and -26.96%, respectively, for the year – investors may be lured by the unusually high dividend yields of CLM and CRF.
Seeking Alpha’s data, author’s notes
According to Seeking Alpha, both funds offer dividend yields of over 24% per year. However, as I indicated above, the growth in dividend payments over 5 years is negative – the funds eat their NAV year after year, which is why they offer such a high yield. This approach has its justification, but over a longer period it does not offer any outperformance compared to the benchmark, which both funds try to beat:
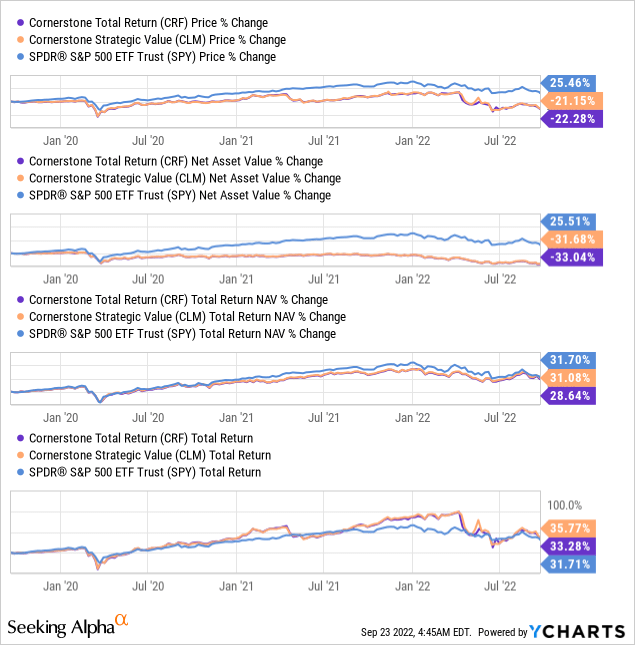
For long-term investors who take distributions from the funds every month, it makes no sense to hold them for the long term – NAV erosion is inevitable. Therefore, in my opinion, these CEFs should only be used as medium-term trading instruments – you need to focus on price action and the discounts/premiums at which these funds are trading.
So are these CEFs worth buying at current prices?
Based on the conclusion that a premium or discount is the main argument for buying these CEFs, I turned to several sources to find out what is currently happening with CLM and CRF on this issue.
I do not know about now, but a week ago, both CEFs were among the 10 “most expensive” funds in this regard in a sample of 413 CEFs, according to CEFChannel, because of the premium at which they traded:
CEFChannel.com, author’s notes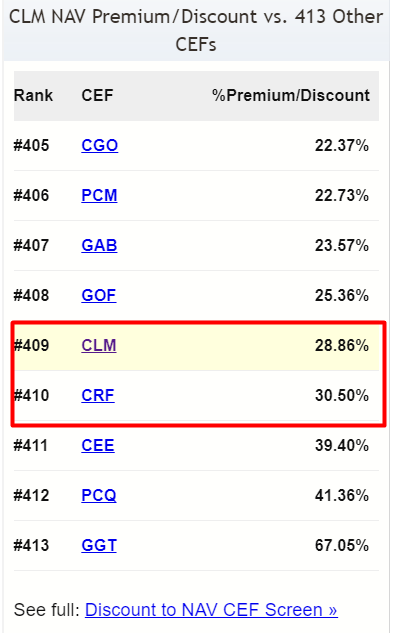
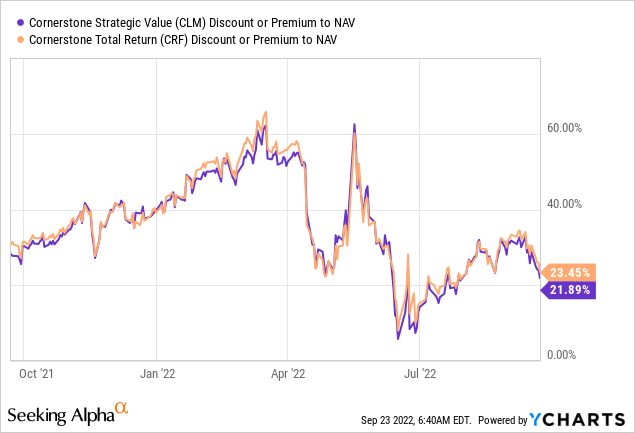
According to the YCharts’s data (shown above), these premiums have decreased somewhat in the meantime, but are still quite high compared to the historically most attractive purchase levels:
YCharts, author’s notes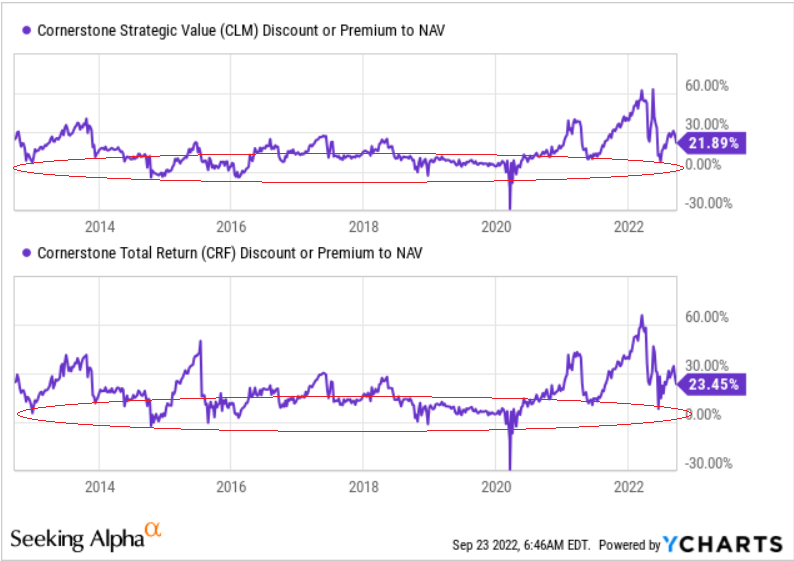
Historically, CLM has approached the premium range for NAV of -5% to 15%, and in the next few days, we saw a strong influx of buyers of this fund. The same is true for CRF, except that the premium range, in this case, is a bit higher – from 0% to about 15%.
Therefore, to the question of whether it is worth buying CLM and CRF now, I would answer unequivocally – no, it is not yet time. In my opinion, investors (rather speculators, because investing in CLM and CRF seems to be a suboptimal activity) should grab them when the dividend yield reaches 30%+.
Seeking Alpha, author’s notes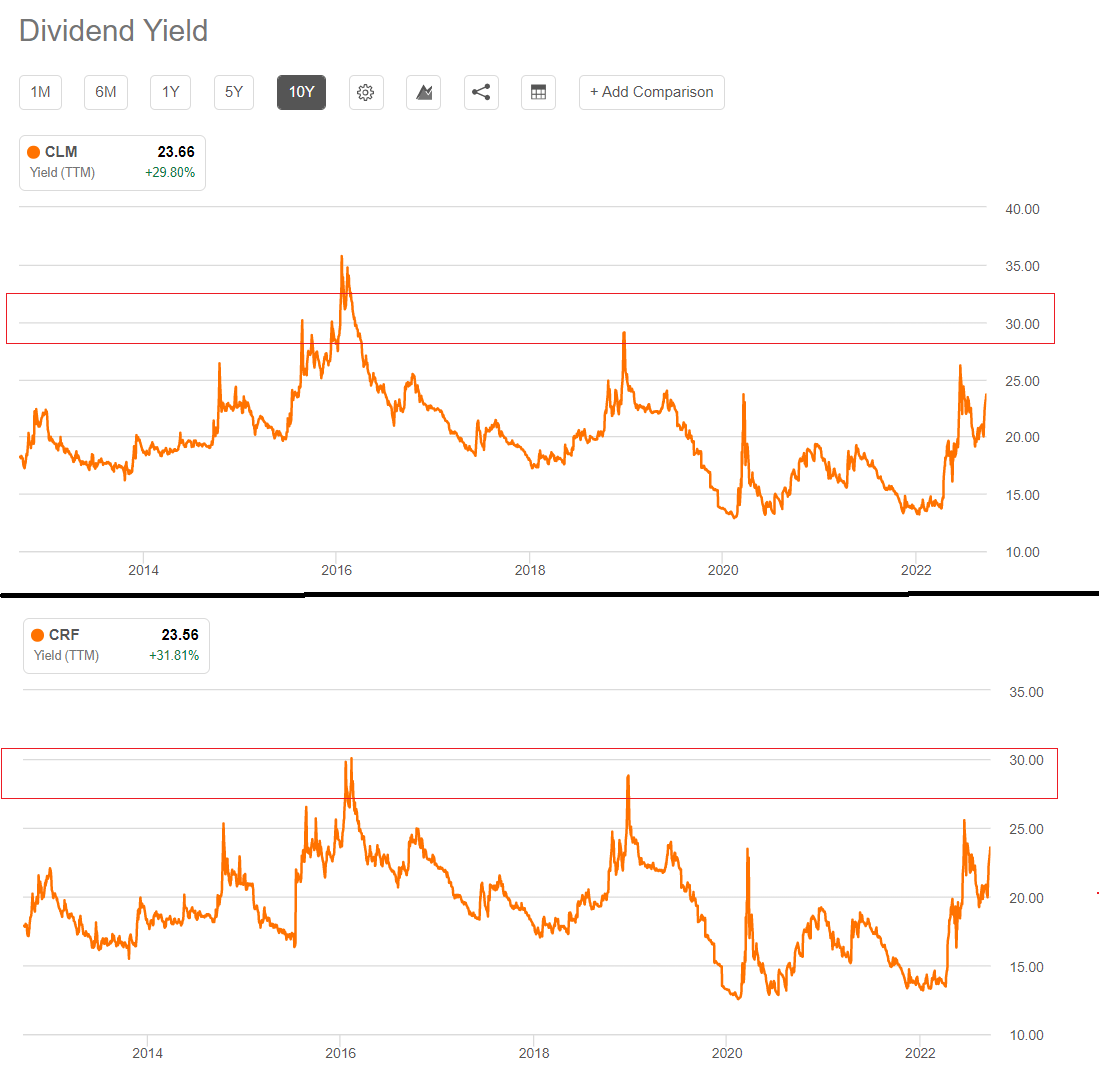
Both CEFs have yet to fall to these levels of dividend yields. So it remains only to wait and hope that the waiting time is not long.
Happy investing and stay healthy!
Final note: Hey, on September 27, we’ll be launching a marketplace service at Seeking Alpha called Beyond the Wall Investing, where we will be tracking and analyzing the latest bank reports to identify hidden opportunities early! All early subscribers will receive a special lifetime legacy price offer. So follow and stay tuned!
Be the first to comment