pcess609
By Rupert Watts
On Aug. 16, 2022, President Joe Biden signed the Inflation Reduction Act into law, which includes the largest ever climate-related investment by the U.S. federal government. Devoting USD 370 billion to climate and energy programs, the act commits the U.S. to a roughly 40% emissions reduction by 2030.
This landmark bill is the latest example of the global commitment to explore and embrace renewables. Launched in 2007, some might say the S&P Global Clean Energy Index was ahead of its time, but in recent years, many have come to consider this index to be the leading benchmark for this movement as it gains momentum worldwide.
In this blog, we will reexamine the S&P Global Clean Energy Index and explore its recent performance following the signing of this bill. Furthermore, we will look at how renewables, as a percentage of global energy production, are estimated to grow through 2050 as reported by the U.S. Energy Information Administration (EIA).
S&P Global Clean Energy Index Has Rallied
The S&P Global Clean Energy Index seeks to track global companies that generate power from renewable sources or are involved in clean-energy-related businesses. The index includes not only companies that produce clean energy but also those involved in related technologies. Therefore, it attempts to capture a broad cross section of companies in the global renewable energy ecosystem. Furthermore, by weighting companies proportional to the product of their float market cap and exposure score, the index overweights those most focused on clean energy.
The index began to rally in late July coinciding with Senator Joe Manchin’s announcement of his support for the Inflation Reduction Act on July 27, 2022 and experienced further increases when the bill passed in the Senate on Aug. 7, 2022.
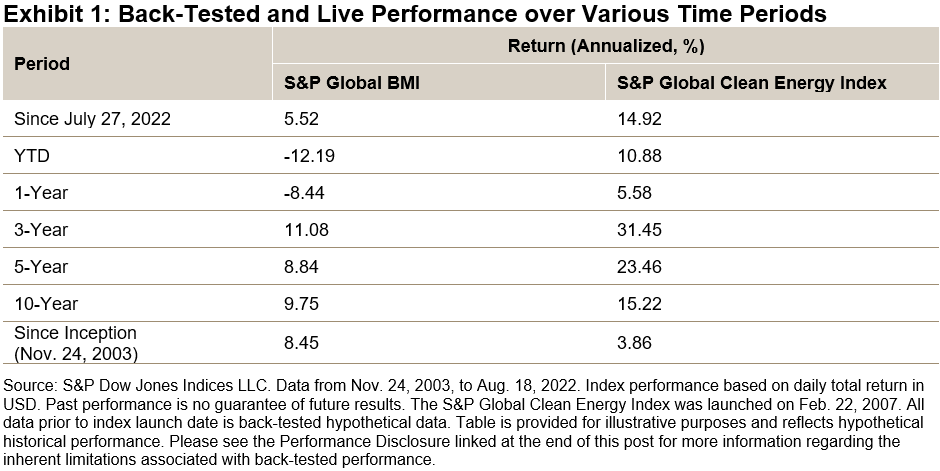
Exhibit 1 shows that since July 27, 2022, the S&P Global Clean Energy Index was up 14.92%, outperforming the S&P Global BMI by 9.4%.
Continuation of the Global Trend to a Cleaner Future
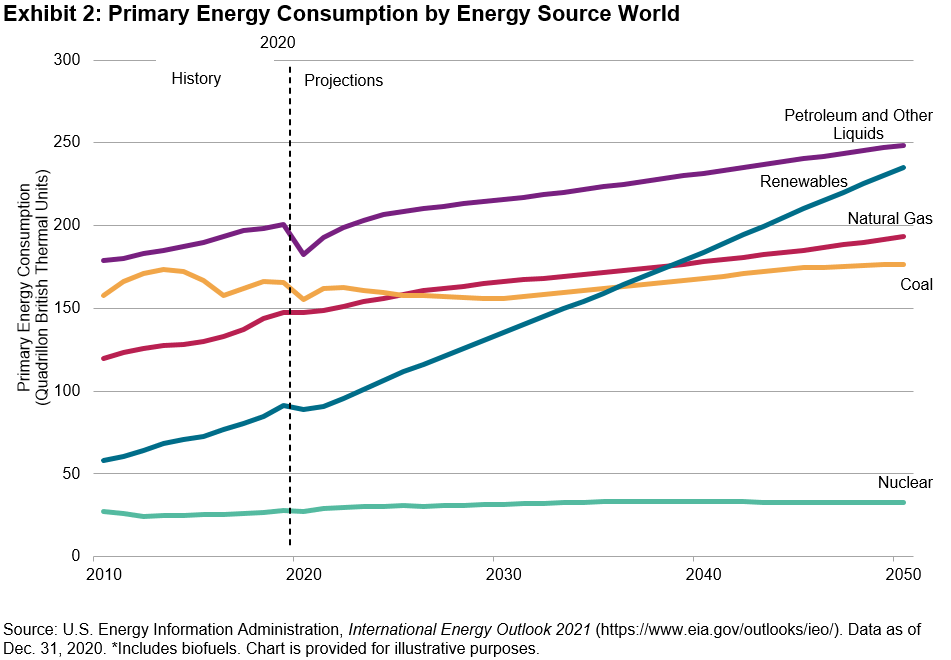
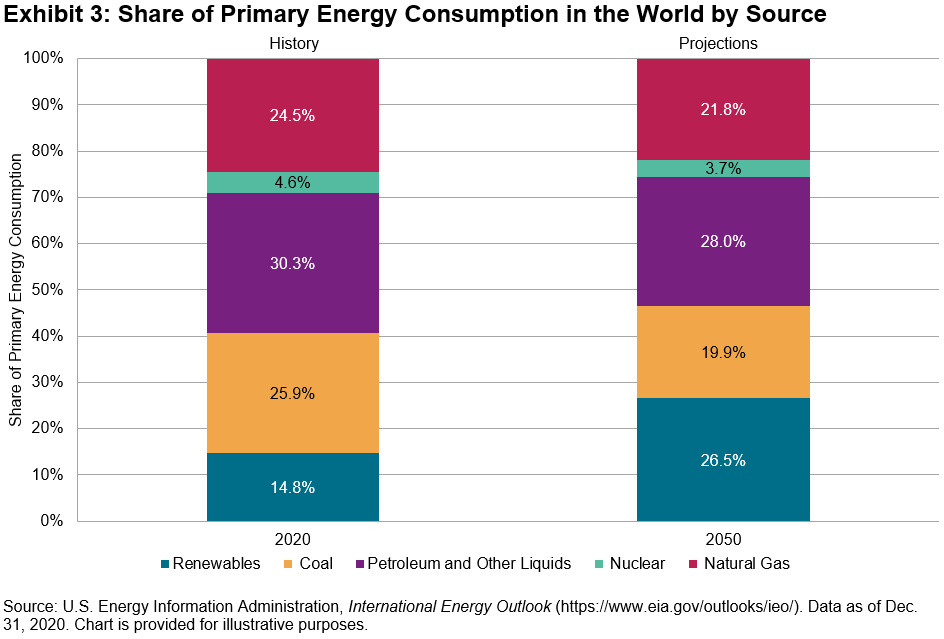
While the U.S. is the latest country to make great strides toward effecting change, many parts of the world are embracing renewables and developing clean technologies. A significant impetus behind the shift from fossil fuels to renewables is an international desire to lower the global carbon footprint as established in the landmark Paris Agreement. Exhibit 2 demonstrates that progress is already being made—the renewable energy industry has grown from approximately 10.8% of all energy produced globally in 2010 to 14.8% as of 2020.
Looking ahead, Exhibit 3 shows that the U.S. EIA estimates that the renewable energy industry will grow to account for approximately 26.5% of all energy consumed globally by 2050.
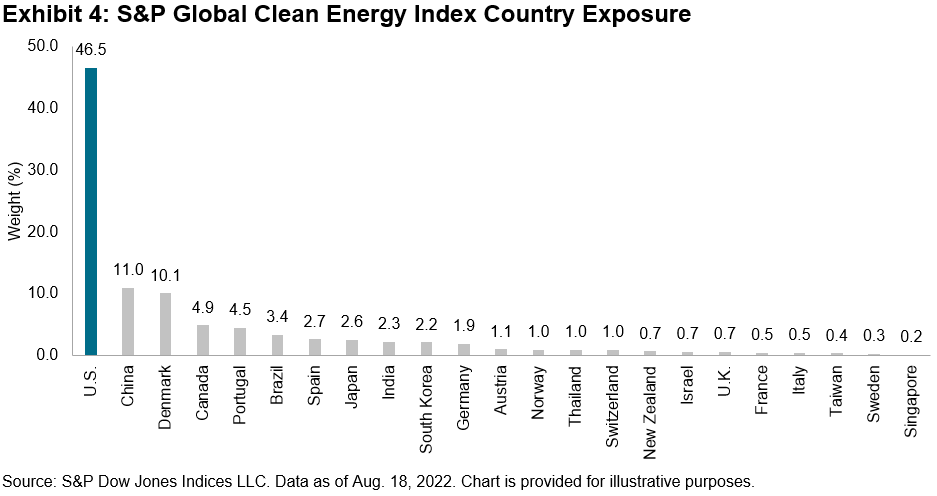
Given that the initiative to move toward renewables is a global one, it is fitting that the S&P Global Clean Energy Index provides exposure to both developed and emerging markets. While the U.S. has the largest weight, as Exhibit 4 shows, over 50% of the index weight is attributed to other countries.
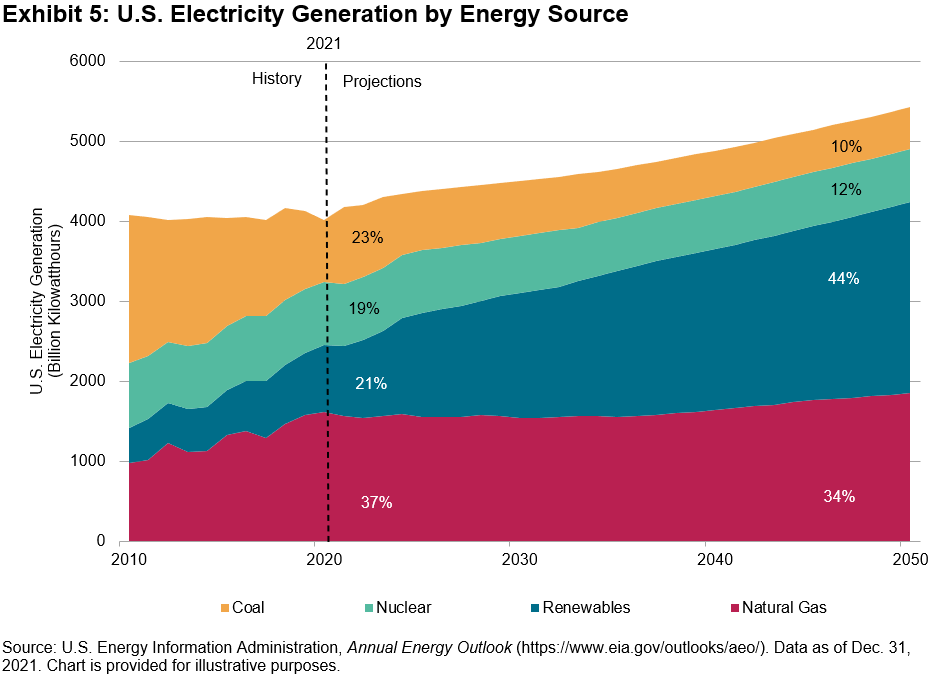
If we focus on the U.S. again, it is compelling to examine the role that renewables are already playing in electricity generation, accounting for 21% in 2021 as reported by the EIA. The EIA is further forecasting that renewables will overtake all other energy sources, contributing 44% of new capacity by 2050.
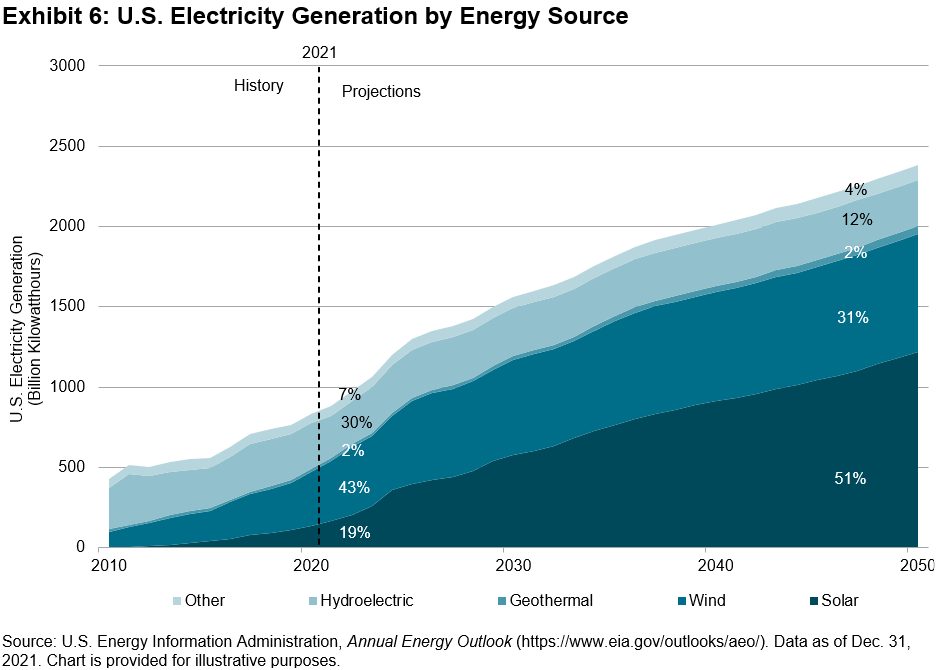
Examining the types of renewables used in U.S. electricity generation in Exhibit 6, we see a mix of solar, wind, geothermal and hydroelectric sources. The S&P Global Clean Energy Index approach aims to capture companies involved in those sources.
As these projections show, renewables are expected to play an increasingly significant role in energy production over the next few decades and beyond. It is certainly an exciting time to follow this sector, and the S&P Global Clean Energy Index is a prominent benchmark for those who want to keep a pulse on where renewables go from here.
For additional details, please refer to S&P Global Clean Energy Index methodology.
Disclosure: Copyright © 2022 S&P Dow Jones Indices LLC, a division of S&P Global. All rights reserved. This material is reproduced with the prior written consent of S&P DJI. For more information on S&P DJI please visit www.spdji.com. For full terms of use and disclosures please visit Terms of Use.
Editor’s Note: The summary bullets for this article were chosen by Seeking Alpha editors.


Be the first to comment