

zoranm/E+ via Getty Images
The consumer staples business is one that I’m intrigued by and has proven itself over time. Of course, it makes complete sense since they typically come along with lots of repeat purchases of items you use nearly every day. That’s a very lucrative spot to be in, even more so since if you get a brand entrenched in a consumers mind and are able to get them to start that habit of always purchasing “X” brand for “Y” problem, you will have a customer for years if not decades.
Church & Dwight (NYSE:CHD) is very firmly in that camp with roots dating back to the 1840s for the well-known Arm & Hammer brand of baking soda. Since then, Church & Dwight has added 13 other brands into what they consider their 14 Power Brands.
CHD 14 Power Brands (CHD CAGNY 2022)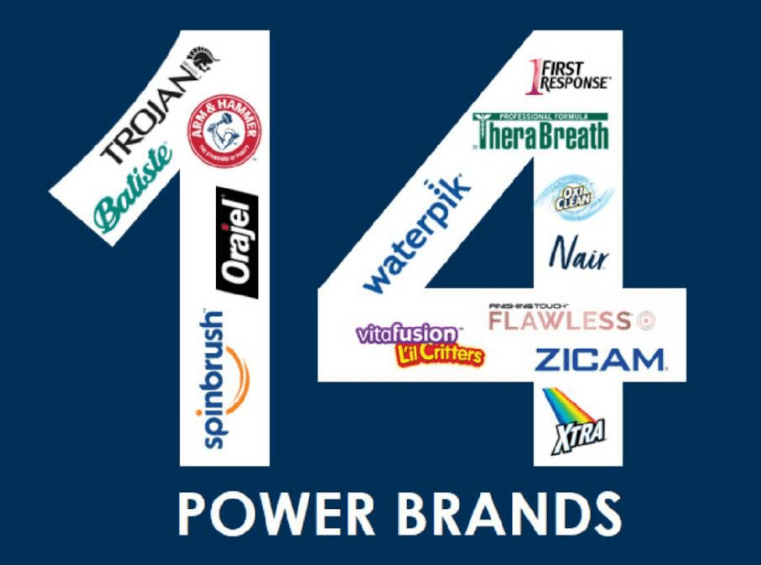
Those 14 Power Brands generate greater than 80% of Church & Dwight’s revenues and profits.
Church & Dwight doesn’t come with the same kind of name recognition compared to the other consumer staple giants. However, that doesn’t mean that investors should ignore this great business especially since they generate much more revenue per employee compared to their cohort.
CHD vs. Consumer Staples Rev $ per Employee (CHD CAGNY 2022)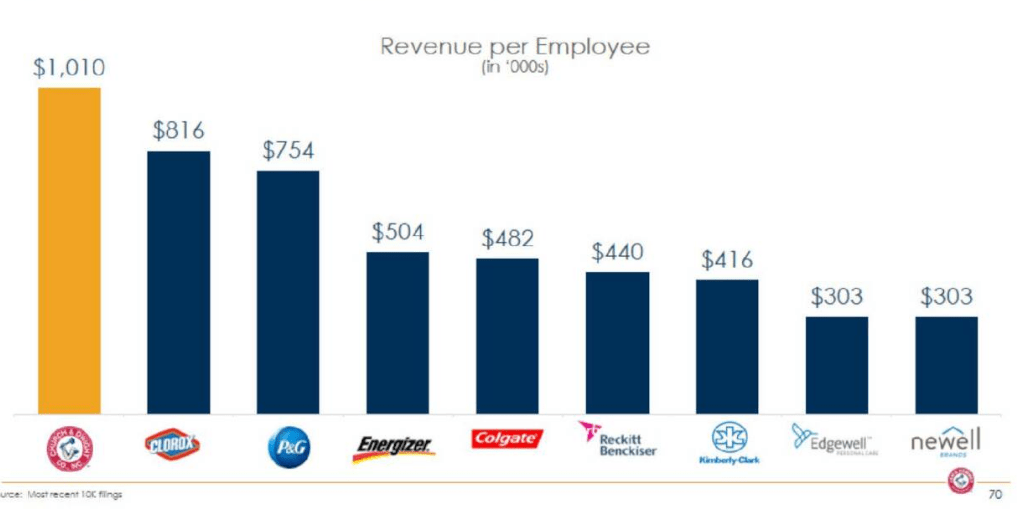
Dividend History
I prefer for the businesses that I own to pay and grow their dividend payments each year. Part of that is because a lengthy dividend growth history, while not a guarantee, helps to narrow down your investment candidates into higher quality companies.
Church & Dwight Dividend History (Church & Dwight Investor Relations)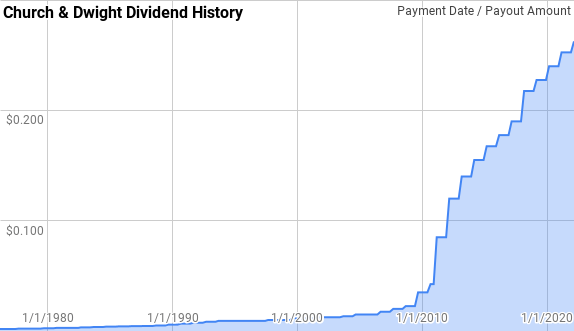
Church & Dwight is a Dividend Champion with 26 consecutive years of dividend growth. They’ve also paid the same or higher dividend dating back to 1976 with a two-year pause in 1995 and 1996.
Since 1976 Church & Dwight’s year over year dividend growth has ranged from 0.0% to 119.4% with an average of 12.4% and a median of 7.9%.
During that same period there’s been 52 rolling 5-year periods with annualized dividend growth ranging from 2.7% to 45.8% with an average of 12.3% and a median of 8.6%.
Church & Dwight has also given 10-year annualized dividend growth spanning 4.0% to 27.3% with an average of 12.6% and a median of 8.9% over that same timeframe.
The rolling 1-, 3-, 5-, and 10-year annualized dividend growth rates from Church & Dwight since 1976 can be found in the following table.
| Year | Annual Dividend | 1 Year | 3 year | 5 Year | 10 Year |
| 1976 | $0.0074 | ||||
| 1977 | $0.0080 | 8.32% | |||
| 1978 | $0.0086 | 7.68% | |||
| 1979 | $0.0093 | 7.15% | 7.71% | ||
| 1980 | $0.0105 | 13.35% | 9.36% | ||
| 1981 | $0.0111 | 5.89% | 8.75% | 8.45% | |
| 1982 | $0.0122 | 9.99% | 9.70% | 8.78% | |
| 1983 | $0.0139 | 13.63% | 9.79% | 9.96% | |
| 1984 | $0.0151 | 9.00% | 10.86% | 10.33% | |
| 1985 | $0.0163 | 7.35% | 9.96% | 9.14% | |
| 1986 | $0.0171 | 5.13% | 7.15% | 8.98% | 8.71% |
| 1987 | $0.0179 | 4.87% | 5.78% | 7.95% | 8.36% |
| 1988 | $0.0192 | 6.98% | 5.66% | 6.65% | 8.29% |
| 1989 | $0.0217 | 13.04% | 8.24% | 7.43% | 8.87% |
| 1990 | $0.0250 | 15.39% | 11.75% | 9.00% | 9.07% |
| 1991 | $0.0283 | 13.34% | 13.92% | 10.65% | 9.81% |
| 1992 | $0.0317 | 11.76% | 13.48% | 12.07% | 9.99% |
| 1993 | $0.0350 | 10.53% | 11.87% | 12.80% | 9.68% |
| 1994 | $0.0367 | 4.77% | 8.97% | 11.10% | 9.25% |
| 1995 | $0.0367 | 0.00% | 5.01% | 7.96% | 8.48% |
| 1996 | $0.0367 | 0.00% | 1.56% | 5.29% | 7.94% |
| 1997 | $0.0383 | 4.54% | 1.49% | 3.90% | 7.90% |
| 1998 | $0.0400 | 4.35% | 2.94% | 2.71% | 7.63% |
| 1999 | $0.0433 | 8.33% | 5.73% | 3.40% | 7.18% |
| 2000 | $0.0467 | 7.69% | 6.78% | 4.94% | 6.44% |
| 2001 | $0.0483 | 3.57% | 6.51% | 5.68% | 5.49% |
| 2002 | $0.0500 | 3.45% | 4.89% | 5.46% | 4.67% |
| 2003 | $0.0517 | 3.33% | 3.45% | 5.25% | 3.97% |
| 2004 | $0.0567 | 9.68% | 5.44% | 5.51% | 4.45% |
| 2005 | $0.0600 | 5.88% | 6.27% | 5.15% | 5.05% |
| 2006 | $0.0650 | 8.33% | 7.95% | 6.10% | 5.89% |
| 2007 | $0.0750 | 15.38% | 9.79% | 8.45% | 6.94% |
| 2008 | $0.0850 | 13.33% | 12.31% | 10.47% | 7.83% |
| 2009 | $0.1150 | 35.29% | 20.95% | 15.21% | 10.25% |
| 2010 | $0.1550 | 34.78% | 27.38% | 20.90% | 12.75% |
| 2011 | $0.3400 | 119.35% | 58.74% | 39.22% | 21.54% |
| 2012 | $0.4800 | 41.18% | 61.01% | 44.96% | 25.38% |
| 2013 | $0.5600 | 16.67% | 53.44% | 45.80% | 26.91% |
| 2014 | $0.6200 | 10.71% | 22.17% | 40.07% | 27.03% |
| 2015 | $0.6700 | 8.06% | 11.76% | 34.01% | 27.29% |
| 2016 | $0.7100 | 5.97% | 8.23% | 15.87% | 27.01% |
| 2017 | $0.7600 | 7.04% | 7.02% | 9.63% | 26.06% |
| 2018 | $0.8700 | 14.47% | 9.10% | 9.21% | 26.19% |
| 2019 | $0.9100 | 4.60% | 8.62% | 7.98% | 22.98% |
| 2020 | $0.9600 | 5.49% | 8.10% | 7.46% | 20.00% |
| 2021 | $1.0100 | 5.21% | 5.10% | 7.30% | 11.50% |
| 2022 | $1.0500 | 3.96% | 4.89% | 6.68% | 8.14% |
Source: Author; Data Source: Church & Dwight Investor Relations
By comparing the dividend payment versus profits or free cash flow we can understand how potentially risky the dividend is. All else being equal the lower the payout ratio the better as it gives more cushion for the inevitable ebbs and flows of the underlying business.
CHD Dividend Payout Ratios (CHD SEC filings)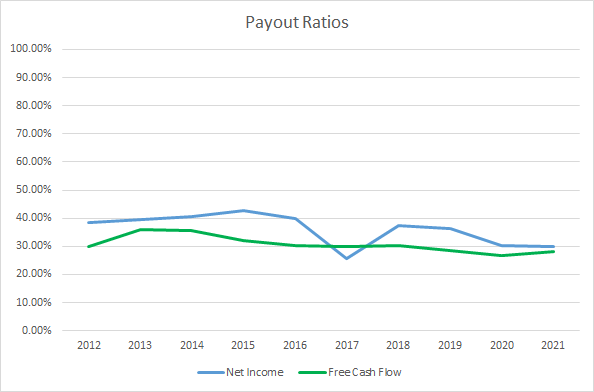
Church & Dwight’s payout ratios have been stable over the last decade with a slight downtrend in both marks. The 10-year average net income payout ratio is 36% with the 5-year average at 31%. Similarly the average free cash flow payout ratios are 31% and 29%, respectively.
Church & Dwight’s dividend is well covered by both net income and free cash flow and show little risk of having to be cut barring a catastrophic change to the underlying business.
Quantitative Quality
I like to invest in businesses that have a history of paying and growing their dividends over time. However, the more important factor is that the business is continuing to improve across several other financial metrics that I like to track.
CHD Revenue Profits & Cash Flow (Church & Dwight SEC filings)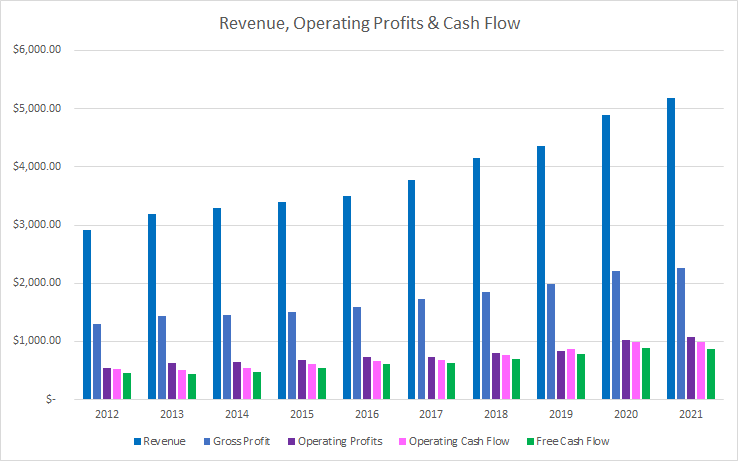
Church & Dwight has had a nice run of growing sales with every year showing at least 2.9% growth during the last decade. Over that time revenues rose 78% in total or 6.6% annualized through a combination of organic growth as well as M&A. Gross profits tracked along with revenue growth increasing 75% or 6.4% annualized.
Operating profits increased 98% over that same time or 7.9% annualized with operating cash flow showing 90% and 7.4% growth, respectively. Free cash flow outpaced revenue growth as well rising 95% in total or 7.7% annualized.
The rolling 5-year CAGRs for Church & Dwight’s revenue, gross and operating profits, and operating and free cash flow can be found in the following chart.
CHD 5 Year Financial CAGRs (Church & Dwight SEC filings)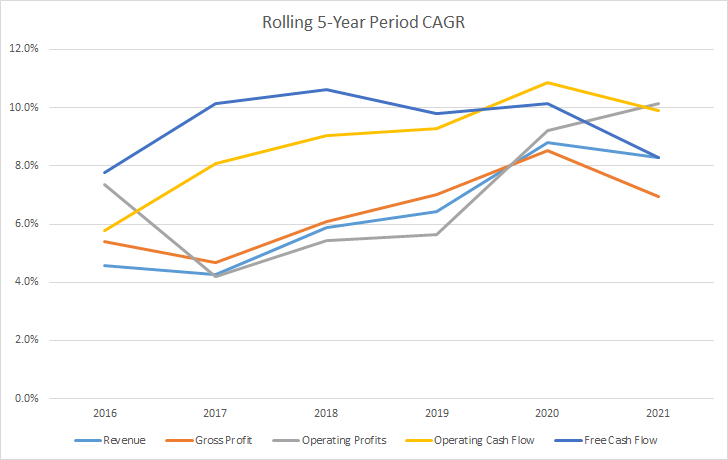
Good businesses should be able to show stable, if not rising, margins over time as they are able to prove out their competitive advantages. I prefer to see free cash flow margins north of 10%; however, that’s very dependent on the industry the business operates in.
CHD Margins (CHD SEC filings)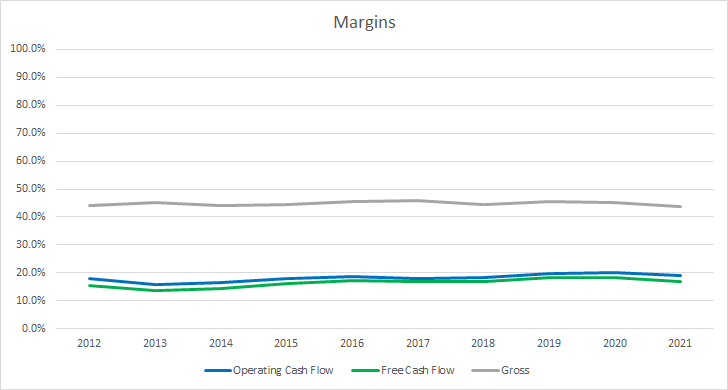
Church & Dwight’s gross margins have been relatively flat over the last decade. The 10-year average gross margin is 44.8% with the 5-year average at 44.9%.
Church & Dwight’s free cash flow margins have been on a steady rise over the last decade. The 10-year average free cash flow margin is 16.4% with the 5-year average at 17.4%.
Similarly, I want to see how much free cash flow that Church & Dwight is able to generate per dollar of capital invested in the business by examining the free cash flow return on invested capital, FCF ROIC. My expectation is to see stable or rising FCF ROIC’s over time.
CHD Free Cash Flow Returns (CHD SEC filings)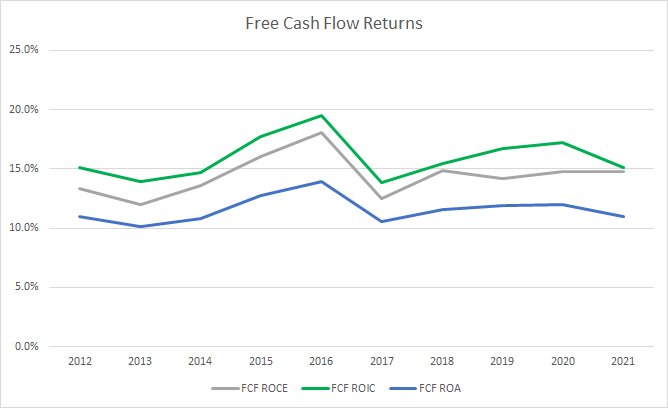
Church & Dwight has been well above the 10% threshold, which I prefer to see, and their FCF ROIC has been solid typically around the 15-16% area. The 10-year average FCF ROIC for Church & Dwight is 15.9% with a 5-year average of 15.7%.
To understand how Church & Dwight uses its free cash flow I calculate three variations of the metric, defined below:
- Free Cash Flow, FCF: Operating cash flow less capital expenditures
- Free Cash Flow after Dividend, FCFaD: FCF less total cash dividend payments
- Free Cash Flow after Dividend and Buybacks, FCFaDB: FCFaD less net cash allocated to share repurchases
CHD Free Cash Flows (CHD SEC filings)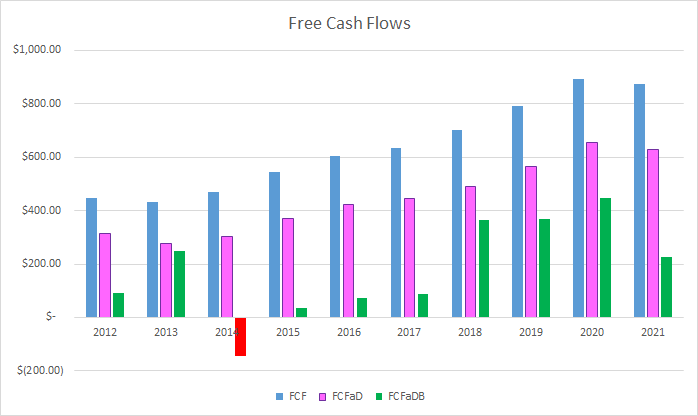
Church & Dwight has generated $6.4 B in total FCF over the last decade. Not bad for a company that carried a market cap around $7.0 B 10 years ago. With that $6.4 B in FCF Church & Dwight has paid out a total of $1.9 B to shareholders in dividend payments which puts the cumulative FCFaD at $4.5 B.
Church & Dwight has also spent a net total of $2.7 B repurchasing shares during the last decade. That puts the 10-year FCFaDB at a solid $1.8 B.
As a dividend growth investor at heart I prefer dividends to buybacks, but even better is dividends in conjunction with buybacks. Share repurchases reduce the number of outstanding shares and thus increase the ownership interest of remaining shares while increasing the per share value of the business.
CHD Shares Outstanding (CHD SEC filings)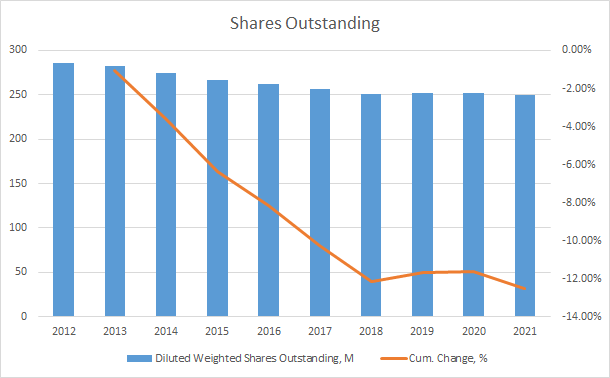
Church & Dwight has shifted during the last decade from being a rather aggressive repurchaser from FY 2014 through FY 2017 and to more of a steady one for FY 2018 through FY 2021. I take that as a good sign that management is weighing the various opportunity sets for their cash flow.
Over the last decade Church & Dwight’s share count has been reduced by 12.5% in total or around 1.5% annualized.
When I make an investment in a business with my savings my intention is to own the business for period spanning years if not potentially decades as long as the business continues to perform to my expectations. As such I want to make sure the balance sheet looks in good order. While I prefer no debt, I also realize that most businesses are going to carry some levels of debt.
CHD Debt to Capitalization (CHD SEC filings)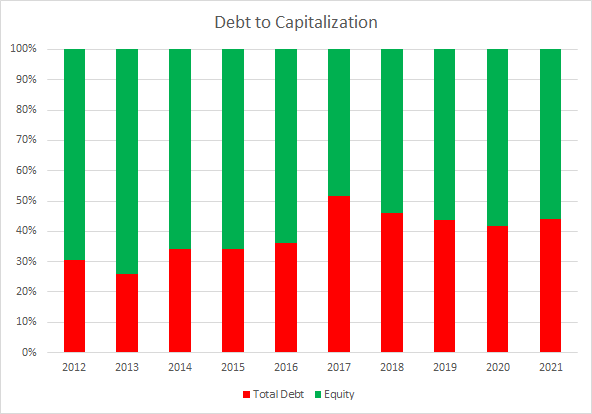
The actual debt-to-capitalization ratio isn’t all that important to me as long as the level is stable or improving over time. Church & Dwight’s 10-year average debt-to-capitalization ratio is 39% with a 5-year average at 45%.
More important to me is the net debt ratios which examine the total debt less cash versus some measure of profits or cash flow. The net debt ratios let you know how quickly the business could de-lever the balance sheet should the interest rate environment change, if they committed 100% of the profit or cash flow measure towards reducing debt.
CHD Debt Ratios (CHD SEC Filings)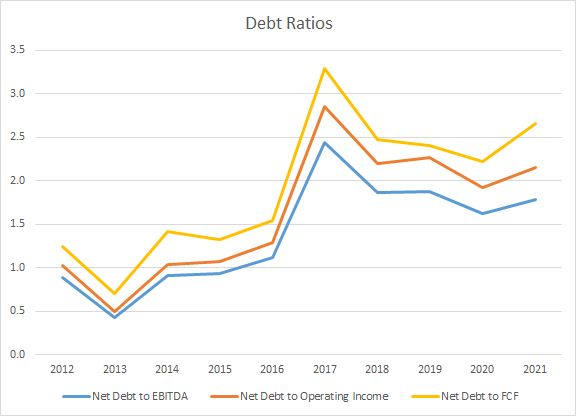
While Church & Dwight’s net debt ratios have been rising over time they are still far from over-leveraged especially considering the stability of the underlying business. Their debt ratios have also been rising due to the number of acquisitions they’ve completed during the last decade as well.
The 10-year average net debt-to-EBITDA, -operating income, and -free cash flow ratios are 1.4x, 1.6x, and 1.9x. Meanwhile the 5-year averages are 1.9x, 2.3x, and 2.6x, respectively.
Valuation
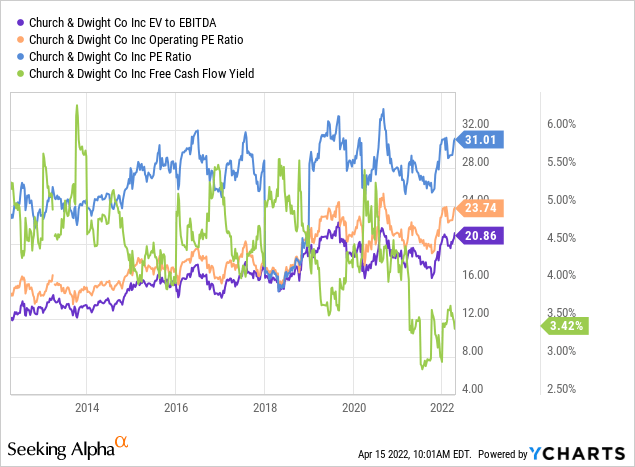
Church & Dwight is a company that I’ve had my eye on for a while that I’m quite impressed with due to the stable nature of the business and possible future growth. While I’m comfortable with Church & Dwight the business, I want to check in the valuation and determine potential fair value ranges for the equity. I utilize several valuation methods including a minimum acceptable rate of return, MARR, analysis, dividend yield theory, and a reverse discounted cash flow analysis.
By forecasting the future earnings and dividends that a business will generate we can value the business with the MARR analysis. Analysts expect Church & Dwight to report FY 2022 EPS of $3.19 and FY 2023 EPS of $3.43. They also expect Church & Dwight to be able to grow EPS 7.4% annually over the next 5 years. I then assumed that EPS growth would slow to 5.0% annually for the following 5-year period. Dividends are assumed to target a 33% payout ratio.
For the reasonable expected terminal multiple I like to see how market participants have typically valued Church & Dwight over time. Church & Dwight shares have usually been valued between roughly 20x and 30x TTM EPS. In the MARR analysis I’ll examine terminal multiples spanning that range.
The following table shows the potential internal rates of return that an investment in Church & Dwight could provide if the assumptions laid out above turn out to be reasonable forecasts of how the future plays out. Returns assume dividends are taken in cash and that shares are purchased around $102.65, Thursday’s closing price.
| IRR | ||
| P/E Level | 5 Year | 10 Year |
| 35 | 10.4% | 8.2% |
| 30 | 6.9% | 6.5% |
| 25 | 3.0% | 4.7% |
| 20 | -1.7% | 2.4% |
| 15 | -7.3% | -0.4% |
Source: Author
Additionally I use the MARR analysis framework and work backwards to determine what price I could pay in order to generate the returns that I seek from my investments. My base hurdle rate is a 10% IRR and for Church & Dwight I’ll also examine 8% and 9% returns.
| Purchase Price Targets | ||||||
| 10% Return Target | 9% Return Target | 8% Return Target | ||||
| P/E Level | 5 Year | 10 Year | 5 Year | 10 Year | 5 Year | 10 Year |
| 35 | $105 | $88 | $110 | $96 | $114 | $105 |
| 30 | $91 | $77 | $95 | $84 | $99 | $91 |
| 25 | $76 | $66 | $80 | $71 | $83 | $77 |
| 20 | $62 | $54 | $65 | $59 | $67 | $64 |
| 15 | $48 | $43 | $50 | $46 | $52 | $50 |
Source: Author
Dividend yield theory a simple valuation method that operates under the assumption that investors, collectively, will value a business around a usual dividend yield level. It’s a reversion to the mean based valuation methodology that should auto-adjust as the business moves forward. For Church & Dwight I’ll use the 3-year average forward dividend yield as a proxy for the fair value of the business.
Church & Dwight Dividend Yield Theory (CHD Investor Relations and Yahoo Finance)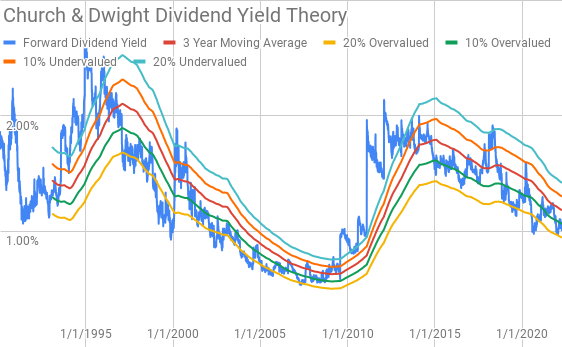
Church & Dwight shares currently offer a forward dividend yield of 1.02% compared to the 3-year average of 1.18%.
I utilize a reverse discounted cash flow analysis to determine what cash flows are embedded within the current market valuation. In other words what the market valuation implies about the future growth and margin structure of the business for a given return threshold. For Church & Dwight I assumed that they would have an initial free cash flow margin of 17.7% that improves to 21.5% during the forecast period, and a terminal growth rate of 4.0%.
Under those assumptions Church & Dwight needs to grow revenues 9.5% annually during the forecast period in order to generate the necessary cash flows to warrant a 10% hurdle rate. However, reducing the hurdle rate to 8% lowers the requisite revenue growth rate to just 3.9%.
Conclusion
Church & Dwight is a fantastic business that I’ve been tracking for years, but it never seemed to work out to where my capital and a reasonable valuation aligned.
Church & Dwight has shown consistent growth over the last decade with revenues growing 6.6% annualized from FY 2012 through FY 2021 and most impressively every year during that time showed growth. That growth came through a combination of organic growth of existing brands and products as well as through M&A.
That consistent revenue growth has also come with strong and improving margins with gross margins near 45% and free cash flow margins around 17%.
Dividend yield theory suggests a fair value range for Church & Dwight between $81 and $99. The MARR analysis shows a fair value around $76 assuming a 10% threshold return and a terminal multiple of 25x EPS 5-years out. Reducing the return threshold to 8% raises the fair value to around $83.
The reverse discounted cash flow analysis seems to imply that 10% returns are not likely from current prices as the required revenue growth is quite aggressive unless you believe the terminal margin structure to be materially higher than that of the recent past. However, the reverse DCF does show that 8% returns are reasonable at least based on growth assumptions.
While I’m typically skeptical of an M&A focused approach, Church & Dwight has proven themselves in this area.
CDH Cagny Conference Growth Through Acquisitions (CHD CAGNY Conference 2022)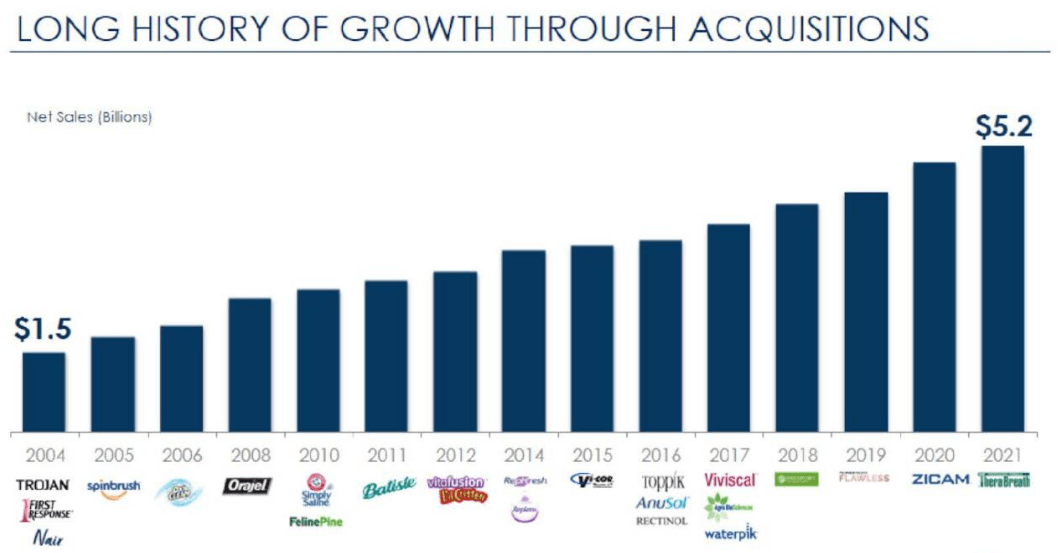
It’s important to note that the valuation models above do not reflect the likely M&A that will come over time. If you assume that management can continue to make future accretive M&A then Church & Dwight’s value would rise depending in line with your potential M&A forecasts.
While I fully expect M&A to come, I think a prudent and conservative approach would be buy shares in the business when you believe 8-10% returns are likely from the core business. At the current valuation I struggle to see that although will likely be proven wrong by a capable management team with a portfolio of strong brands.
CHD Power Brands and M&A (CHD CAGNY 2022)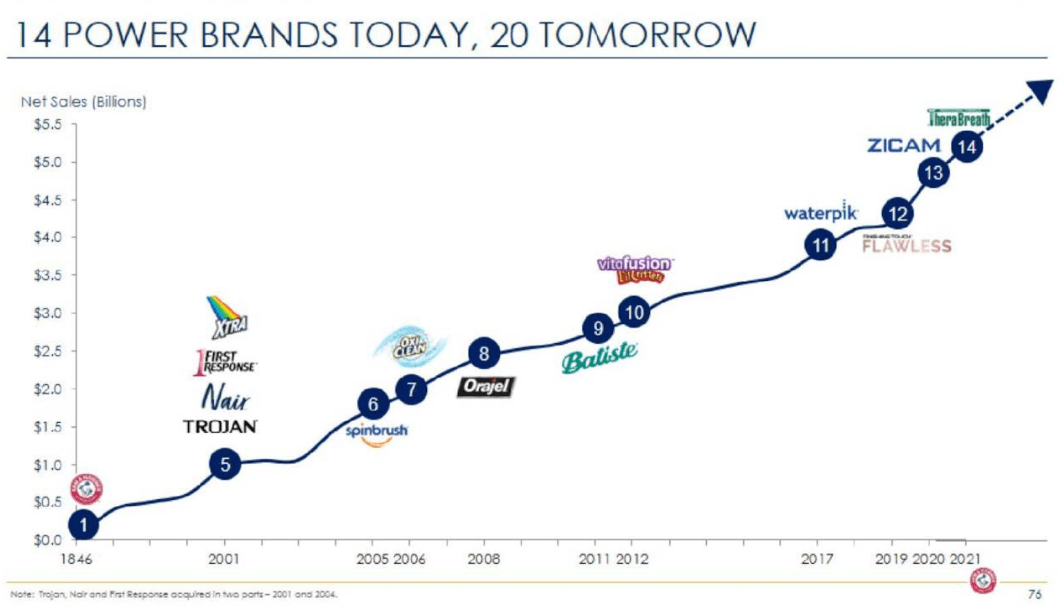
Church & Dwight is a strong consumer staple business that I hope to add to my portfolio in the future. Currently, I would feel more comfortable purchasing shares around $85 or lower.
Church & Dwight is one of those great businesses that has been perpetually expensive ever since I started watching them. Unfortunately, I didn’t take advantage of the gift that was the market decline in March 2020 as things were moving way too fast and Church & Dwight just slipped through the cracks. I guess at some point I need to question whether perpetually expensive means there’s a new norm.
While that is a fair amount lower than the current price, it’s a level that I feel errs on the conservative side of betting on future M&A activity. Essentially, at that level, I believe any accretive M&A activity would just help to boost my forward returns higher; however, if no M&A activity came, I’d still be happy with the results.
Be the first to comment