

petrunjela/E+ via Getty Images
Introduction: Why is Charter Stock Down?
We review Charter Communications Inc. (NASDAQ:CHTR) after shares continued to be volatile, falling 24% in September and then rebounding 9% in the first three trading days of October.
Charter shares have now fallen 60% from their peak last September, a peak-to-trough decline that is twice as large as the approximately 30% corrections seen in February-March of 2020 and February-May of 2018:
|
Charter Share Price (Since IPO) 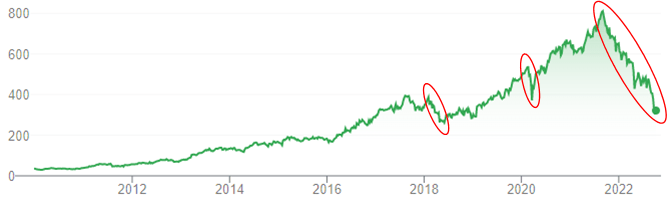 Source: Google Finance (06-Oct-22). |
We believe Charter stock’s decline in September was unfair, driven by a market correction that also saw the share prices of Comcast (CMCSA) and Altice USA (ATUS) falling 15% and 42% respectively.
The bull and bear arguments around Charter have not changed since September. Recent comments by industry executives indicated a continuation of operational trends seen in Q2. Both Charter and Altice USA are changing CEOs, but in Charter’s case this appears to be part of longstanding succession plans. We also believe investors are too fixated on broadband subscriber net adds, when U.S. Cable is driven by multiple growth drivers. Charter shares are at a 10.5% (tax-adjusted) Free Cash Flow (“FCF”) Yield, which should help limit further downside. Our forecasts indicate a potential 204% return (41.0% annualized) by 2025 year-end in the event of a positive upcome. Buy.
Charter is scheduled to report Q3 2022 results on October 28.
Charter Bull Case vs. Bear Case
Charter has a fantastic financial track record, growing Free Cash Flow (“FCF”) / Share at a 31.7% CAGR in 2017-21:
|
Charter Key Financials (2017-21) 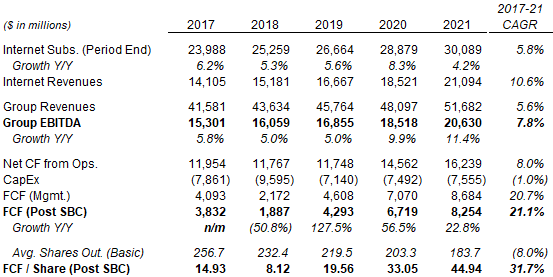 Source: Charter company filings. |
During 2017-21, group revenues grew at a 5.6% CAGR, mostly driven by Internet revenues growing at a 10.6% CAGR; EBITDA grew faster, at a 7.8% CAGR, thanks to natural operational leverage and the mix shift to higher-margin Internet revenues; FCF grew faster still, at a 20.7% CAGR, thanks to CapEx falling over time; and FCF/Share grew at a 31.7% CAGR, helped by buybacks reducing the share count by an average 8.0% each year.
The bear case for Charter is that its residential broadband business is now in structural decline, with its subscriber base increasingly cannibalized by telecom companies’ continuing fiber overbuild (primarily at AT&T (T)) and new Fixed Wireless products (from T-Mobile (TMUS) and Verizon (VZ)). Bears tend to rely on broadband subscriber net adds as evidence, with Cable operators’ net adds having been decelerating (and basically hitting zero in Q2 2022), and Fixed Wireless’ net adds becoming quite substantial in 2022:
|
Wireline & Fixed Wireless Broadband Net Adds – Key Players (Since 2019) 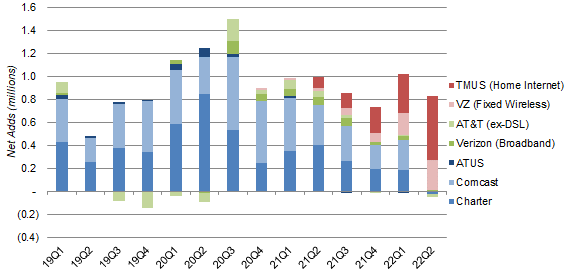 Source: Company filings. NB. Comcast Q1 2022 figure includes one-third benefit from end of COVID free programs. |
The bull case is that the U.S. Cable growth algorithm is still intact. In line with management comments, bulls believe that the main reason for the deceleration in Cable broadband net adds is lower market activity, after some demand was pulled forward during COVID-19; they also believe weak Q2 net adds were partly due to a return to pre-COVID seasonality, where students leave college towns during the summer. They believe Fixed Wireless’ gains were separate from existing Cable broadband customers, whose churn remains at historic lows, and that Fixed Wireless will in any case be an inferior product with limited growth potential because of local bandwidth constraints. Bulls also point to how Charter’s broadband revenues and EBITDA have both reached new records in Q2 2022:
|
Charter Revenues & Adjusted EBITDA (Since Q4 2018) 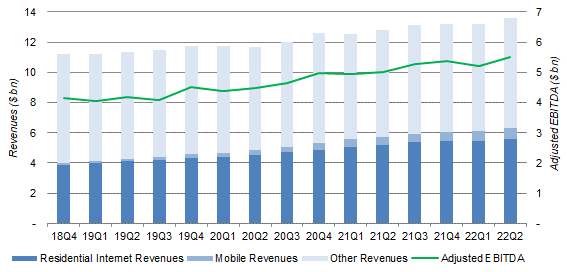 Source: Charter company filings. |
We are firmly in the bull camp, though we also expect future growth to be slower, even if supported by Mobile as a new source of earnings. We assume only a 4.3% annual EBITDA growth after 2022 and a $500m EBIT from Mobile by 2025, and these are sufficient for total FCF to grow at low-teens annually (excluding 2022-23, which will be distorted by the start of cash taxes). Buybacks should reduce the share count by a double-digit percentage each year:
|
Charter Cashflow Forecasts (2022-25) 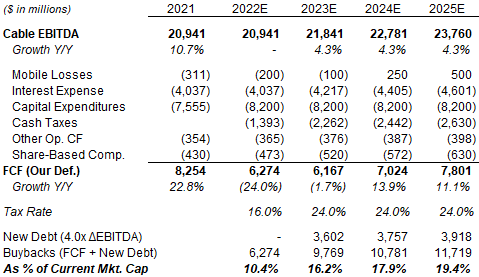 Source: Librarian Capital estimates. |
(We have assumed Charter’s EBITDA to be flat in 2022, even though it was up 7.6% year-on-year in the first half.)
We do not believe any of the developments since Q2 results have changed our investment case.
Q2 Operational Trends Likely Continuing
Comments by executives from Charter and other companies indicated a continuation of operational trends seen in Q2.
Comcast Deputy CFO Jason Armstrong, speaking at a Bank of America (BAC) conference on September 8, said:
The same trends that were in place in the second quarter have continued into the third quarter … there’s a combination of macroeconomic environment, which has suppressed move activity, which moves are positive for us, and there’s a competitive environment …
When we talked about the third quarter on our July earnings call, we gave an outlook that said … we had lost 30,000 subs in July, but we expected back-to-school to be a tailwind in August and September. And as I sit here right now, the outlook that we gave is kind of exactly what’s played out”
Similarly, Comcast CEO Brian Roberts, speaking at a Goldman Sachs (GS) conference on September 14, said:
There are 4 ways to grow our broadband business. One is net adds. One is ARPU (Average Revenue Per User). One is business services, and one is wireless … The first one … net adds … We don’t foresee that right now growing”
Conversely, Verizon CEO Hans Vestberg, speaking at the same conference, said about their Fixed Wireless business that:
On the Fixed Wireless Access, as far as we can see in this quarter, it continues the same trend. And we are just opening more and more markets, we’re just scaling it”
Charter’s CEO and CFO, who also spoke at these two conferences, did not comment on Q3 trends, though CEO Tom Rutledge reaffirmed his confidence Charter will outcompete both fiber overbuild and Fixed Wireless:
The competitive environment, in terms of the growth in fiber competitors, hasn’t really changed much. And, yes, we have the new entrant of Fixed Wireless but, on a relative scale, it has taken a very small base of our customers, very small base, relative to the change in the churn activity level and our ability to sell into that churn”
No change in operational trends means that both bears and bulls are likely sticking to their existing views.
New CEOs at Charter and Altice USA
Charter announced on September 21 that CEO Tom Rutledge will be replaced by current COO Chris Winfrey on December 1, with Rutledge to stay on as executive chairman until November 2023.
Altice USA similarly announced on September 7 that CEO Dexter Goei would be replaced by Comcast executive Dennis Mathew on October 3, with Goei to also stay on as executive chairman.
We believe Charter’s change of CEO to be part of longstanding succession plans. Winfrey served as Charter’s CFO during 2010-21, and was “elevated” to the COO role in October 2021, a move that was likely intended to give him more operational experience. Rutledge has already been in the CEO role for 10 years and, at 64, intends to retire after a 50-year career that begun in 1972.
U.S. Cable has Multiple Growth Drivers
We believe investors are too fixated on broadband subscriber net adds when U.S. Cable has multiple growth drivers.
As we have shown above, Comcast views net adds as just one of the four key growth drivers in U.S. Cable, the others being ARPU, business services and mobile. Comcast CEO Brian Roberts said explicitly that “I really believe we can grow EBITDA even if residential sales are not growing for a while”. Charter executives have made similar comments, and its EBITDA has continued to grow despite slower net adds.
Mobile in particular represents a large source of potential new earnings. Both Charter and Comcast have seen their mobile business grow at a rapid pace consistently every quarter:
|
Charter Mobile Lines & Revenues (Since Q4 2019) 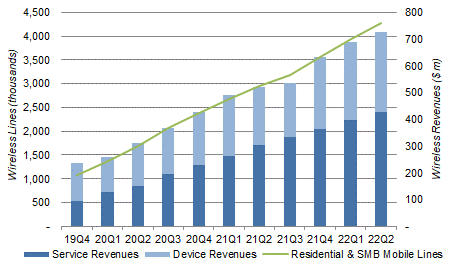 Source: Charter company filings. |
There are structural reasons why U.S. Cable can take mobile market share from telco, notably cross-selling synergies and cost savings from WiFi data offload. Including both wireline broadband and mobile, Charter believes it currently receives less than 30% of what the average household is spending on connectivity and communications, which means mobile can potentially help it grow sales by three times.
This will not be the first time the U.S. Cable growth algorithm has evolved. In the 2010s Cable operators were much more dependent on Video revenues, “cord-cutting” was a real concern, and falling Video subscribers had much the same effect on many investors as the decelerating broadband net adds have today. However, wireline broadband ultimately provided a new and more powerful growth driver, and U.S. Cable stocks soared to new highs.
Subscriber net adds are becoming less important to U.S. Cable, especially as residential broadband penetration having surpassed 50% (it was 55.0% for Charter at Q2 2022) and Fixed Wireless may provide a new (but inferior) alternative to the low end of the market.
We expect future Cable earnings growth to be more driven by APRU, business services and mobile, but also to remain solidly positive.
Valuation: Is Charter Stock Overvalued?
At $329.28, CHTR shares are trading at a 13.7% FCF Yield relative to 2021 financials; adjusted for cash taxes (on a 24% rate) that has started in Q2 2022, FCF is $6.33bn and the FCF Yield is 10.5%:
|
Charter Earnings, Cash flows & Valuation (2018-21) 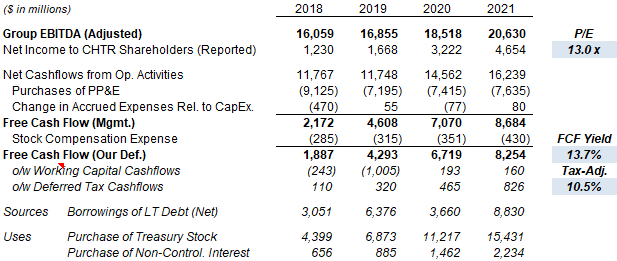 Source: Charter company filings. |
Charter is trading at a 13.0x P/E, but EPS is not a meaningful metric due to large non-cash costs like depreciation.
Cash taxes started in 2022 after tax losses have been exhausted. Management has indicated these will be a mid-to-high teens percentage of (EBITDA – Interest – CapEx) in 2022, and 23-25% of the same thereafter.
Q2 2022 FCF was $1.56bn, which annualizes to $6.24bn, close to the tax-adjusted 2021 figure above. Q2 2022 FCF was after $357m of rural construction initiative CapEx, much higher than the $63m figure in the prior-year quarter.
Charter Return Forecasts
Our EBITDA and total FCF forecasts (as shown above) are unchanged from our previous update.
However, the lower Charter share price means we now assume an annual 15% reduction in the share count, compared to 11% before. This means our new 2025 FCF/Share forecast is $75.14, 20% higher than before ($62.52):
|
Illustrative Charter Return Forecasts 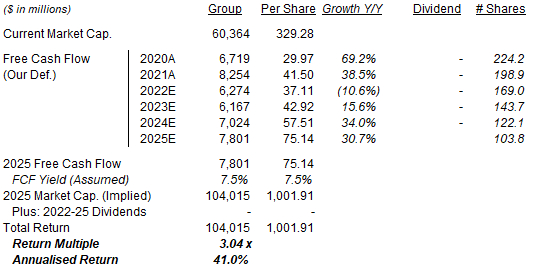 Source: Librarian Capital estimates. |
With shares at $329.28, we expect an exit price of $1,000 and a total return of 204% (41% annualized) by 2025 year-end.
Conclusion: Is CHTR Stock a Buy?
We reiterate our Buy rating on Charter Communications Inc. stock.
Be the first to comment