

SteveAllenPhoto/iStock via Getty Images
CEVA (NASDAQ:CEVA) has gone sideways for months, stuck in a trading range. There have been repeated attempts to break the stalemate, but multiple attempts to break through either resistance or support have been unsuccessful. The most recent quarterly report resulted in a big drop in the stock, but it too could not break through support even though it came very close to doing it. However, the stock is once again at risk of falling below support, and there are several reasons why this could ultimately happen in the end. Why will be covered next.
The stock is once again at the threshold of breaking through
The chart below shows how the stock has been stuck in a trading range for much of 2022. CEVA seems to be stuck in the $32-38 region. There have been a number of attempts to break out of the trading range, but resistance at the upper end of the channel and support at the lower end of the channel have done a solid job keeping the stock contained.
Source: finviz.com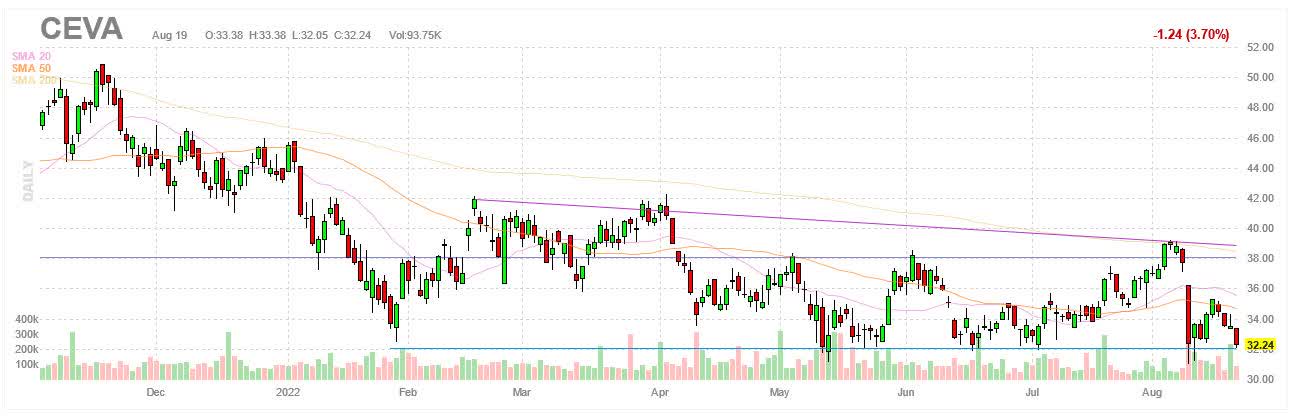
The sideways action has allowed for trading opportunities. For instance, one possibility worth exploring is to go long whenever the stock reaches the lower end of the trading range and sell whenever the stock reaches the upper end of the trading range. Rinse and repeat with appropriate stops as long as the trading channel remains intact.
It’s worth noting that the stock has once again reached the lower end of the trading range. On the one hand, it’s encouraging to see the stock stop just short of $32, a sign support is making its presence felt. On the other hand, it’s somewhat discouraging to see the stock back at support, not long after it bounced following a 14% drop in the stock on the day the Q2 report was released.
Note that the stock fell below $32 during intraday trading, but the stock was able to recover before the end of day to close above support. There are two ways to look at this. On the positive side, the fact that the stock recovered after the initial drop to stay above support is a sign support is doing what it is supposed to do and that is to stand its ground.
On the negative side, the fact that the stock was able to fall below support, if only temporarily, suggests support is starting to crack. It raises the possibility support could fail on another attempted breakthrough, which might come soon enough with the stock at the edge of support.
Why the Q2 report send the stock tumbling
As mentioned before, the market did not respond well to what CEVA had to say in its most recent earnings report. CEVA actually beat expectations for the bottom line, but it fell short of expectations for the top line. Keep in mind that the Q2 report was preceded by the Q1 report, which showed growth, but also signs that growth is decelerating.
For instance, revenue and non-GAAP increased by 35.4% YoY to $34.4M and non-GAAP EPS increased by 1700% YoY to $0.18 in Q1. However, when compared to the preceding Q4, revenue growth was pretty much flat with an increase of just 1% QoQ. EPS went further by declining sequentially. This deceleration continued in Q2.
Q2 revenue increased by 9% YoY, but it also declined by 3% QoQ to $33.2M. Licensing, NRE and related revenue was $22.1M, up 42% YoY. Royalty revenue was $11.1M, down 26% YoY. The bottom line deteriorated as a result of lower gross margins. CEVA finished with a GAAP loss of $1.1M or $0.05 per share and a non-GAAP profit of $4.3M or $0.18 per share.
Note that equity-based compensation expense of $0.14 is included in the GAAP number, but not in the non-GAAP number. GAAP earnings were also weighed down by a $0.5M loss due to the remeasurement of marketable securities. Note that CEVA spent $4.5M to buy back 136,000 shares, giving EPS a boost. Cash and equivalent totaled $146M. The table below shows the numbers for Q2 FY2022.
|
(GAAP) |
Q2 FY2022 |
Q1 FY2022 |
Q2 FY2021 |
QoQ |
YoY |
|
Revenue |
$33.195M |
$34.391M |
$30.457M |
(3.48%) |
8.99% |
|
Gross margin |
79% |
81% |
88% |
(200bps) |
(900bps) |
|
Operating income (loss) |
($0.276M) |
$0.468M |
$1.588M |
– |
– |
|
Net income (loss) |
($1.123M) |
($1.696M) |
$0.315M |
– |
– |
|
EPS |
($0.05) |
($0.07) |
$0.01 |
– |
– |
|
(Non-GAAP) |
|||||
|
Operating income |
$4.634M |
$5.507M |
$6.350M |
(15.85%) |
(27.02%) |
|
Net income |
$4.314M |
$4.214M |
$5.077M |
2.37% |
(15.03%) |
|
EPS |
$0.18 |
$0.18 |
$0.22 |
– |
(18.18%) |
Source: CEVA
The outlook for CEVA is murky
Other details were mixed as well. On the one hand, CEVA is still seeing strong interest for its IP. CEVA signed 22 new license agreements in Q2, eight more than in Q1, including five with first-time customers. Applications targeted by licensees include satellite communications, AI sensors, WiFi-6 and wireless audio.
On the other hand, shipments fell in Q2 after a record-setting Q1. Licensees shipped 433M units, a decline of 18% QoQ and 4% YoY. Base station and IoT product shipments totaled 349M, up 11% YoY, but down 19% QoQ. Handset baseband chips continued to decline, falling to 83M, a decline of 17% QoQ and 40% YoY. The latter is where weakness is concentrated. Sales of smartphones have been falling due to a deteriorating global economy, and CEVA has felt the impact.
In addition, COVID-19 lockdowns in China continued to have a negative impact on CEVA in Q2, just as it did in Q1. However, CEVA expects the handset segment to improve with the arrival of the year-end holidays, which tends to boost sales of smartphones and other consumer products. Gross margins are expected to improve, although there are risks that could sway the outlook. From the Q2 earnings call:
“With that said, we are monitoring the implications of the economic uncertainty that we experienced in the second quarter associated with the handset royalties, as we get closer to the holiday season and as the COVID restrictions in China are being lifted. Specifically for the third quarter, gross margin is expected to be slightly better than the second quarter, approximately 81% on a GAAP basis and 83% to 84% on a non-GAAP basis.”
A transcript of the Q2 FY2022 earnings call can be found here.
Valuations may be too high
Earnings have declined, and the outlook is uncertain, but valuation may be what ultimately pushes the stock below support. The table below shows the multiple CEVA trades at. For instance, CEVA has an enterprise value of $617M, which is equal to 88 times EBITDA on a forward basis and 50 times EBITDA on a trailing basis. Keep in mind that the non-GAAP numbers leave out stock-compensation expense, but the GAAP numbers do not.
Note how the forward multiples are higher than the trailing ones, a reflection of earnings in decline. CEVA comes with a trailing P/E of 833 and that’s only because it earned $0.17 in Q4 FY2021, which was in turn the result of an investment gain. If not for this outlier, CEVA would not have a P/E since CEVA ended with a GAAP loss in three of the last four quarters. CEVA is also expected to remain in the red, which is why it has no forward P/E.
|
CEVA |
|
|
Market cap |
$748.99M |
|
Enterprise value |
$616.85M |
|
Revenue (“ttm”) |
$134.4M |
|
EBITDA |
$12.3M |
|
Trailing P/E |
832.97 |
|
Forward P/E |
N/A |
|
PEG ratio |
N/A |
|
P/S |
5.53 |
|
P/B |
2.73 |
|
EV/sales |
4.59 |
|
Trailing EV/EBITDA |
50.12 |
|
Forward EV/EBITDA |
88.12 |
Source: Seeking Alpha
Investor takeaways
CEVA is currently dealing with several headwinds. China is still resorting to lockdowns to fight COVID-19, which is hampering growth at CEVA. CEVA is also being negatively affected by a weakening global economy, which is expressing itself in the form of falling sales of consumer goods like smartphones.
These headwinds are unlikely to recede anytime soon, which suggests sales and earnings could remain under pressure for the time being. There is the possibility CEVA will get a boost from seasonality with the arrival of the holiday shopping season, but the boost could be tempered, if not completely negated, by the aforementioned headwinds. The outlook for CEVA is clouded by a lot of uncertainty.
I am neutral on CEVA as stated before in a previous article. Some may want to roll the dice and go long CEVA with the stock just above support, betting on a bounce. The stock still remains in a trading channel with entry and exit points defined by support and resistance levels. Long CEVA could be worth it from that viewpoint, assuming of course the channel remains intact.
However, there are no guarantees the stock will remain in the current trading range. The stock will eventually break out of the existing channel, given enough time. It might not be a right way, but it will at some point. And if there’s to be a break out of the channel, it’s more likely to be through support at the lower end of the trading channel than through resistance at the upper end of the trading channel with the way the cards are currently laid out.
CEVA is likely to face continued headwinds that are putting pressure on the top and the bottom line. The global economy is more likely to get weaker than stronger. China intends to stick with COVID-19 lockdowns, which can have an adverse impact on local businesses, including those of CEVA. Multiples remain high, even though the stock has fallen from the highs seen at the start of last year.
The fact that the stock almost succeeded in breaking through support is a warning sign that support is having a hard time keeping the stock afloat. If the stock keeps banging on the door, it may only be a matter of time before support fades away and the way is clear for the stock to move lower. Taking support for granted by going long may not be such a good move under these circumstances. Put all this together and standing on the sidelines is probably best.
Be the first to comment