

naphtalina/iStock via Getty Images
This report was issued to members of Yield Hunting on July 10th. All data herein is from that date.
We just saw the worst first half to a year in the equity markets since 1970 and the second half doesn’t look much better. NAVs in June alone were down high single digits and low double digits in many cases.
Year-to-date, most credit funds are down about 20% on price and 15% or so on NAV. Inflation is still raging and likely hasn’t peaked on CPI (next report comes out July 13). Evidence that inflation is subsiding will be needed for the bear market and recessionary market to have even a prospect of turning around.
The bond market is now yelling B.S. to the Fed about their ‘dot plot’ forecast of a 3.75% terminal rate (the rate when they stop raising rates). In fact, the bond market now expects 75 bps of cuts over the next two years – the most since the 2008 Financial Crisis.
Bloomberg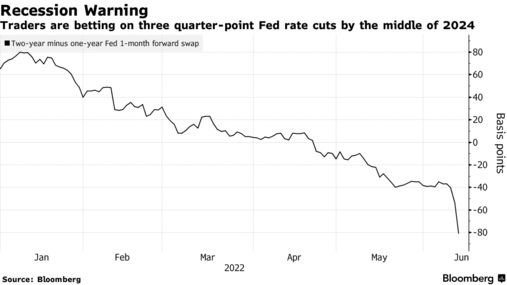
Rising interest rates are the kryptonite of the fixed income closed-end fund market. That is because closed-end funds have leverage and that leverage can be costly in a rising interest rate environment.
The leverage costs when they go up cut directly into net investment income or the amount of income shareholders receive from the fund’s bond holdings. If the fund has $100 worth of assets and they lever up 40% to $140, then that borrowing and extra $40 worth of holdings can generate at least another 40% of income.
I say at least because a lot of a fund’s expenses are fixed cost. So adding leverage and generating more net investment income can produce scale and a greater than 1 + 1 = 2 payoff.
But leverage is both a benefit and a detriment. In times of rising costs and fast-moving down market trends, leverage can slice the NAV hard as well as reduce the yield of the portfolio because the distribution may need to be cut. That is the environment we are in today.
Since the start of the year, bond NAVs are down about 15%-20%. Prices are down 17% – 27%. That is in line with the equity market declines. So the bond market provided no or very little degree of safety.
Leverage has amplified that NAV decline and we are starting to see some deleveraging though, for the most part, it is orderly. But with NAVs down significantly and leverage costs going up, distributions are going (and starting to be) whacked.
Why do NAVs going down affect the distribution?
CEFs have leverage caps- most are at 50%- that doesn’t allow them to breach that amount without having to delever or stop paying the distribution. Going back to our example earlier of our fund with $100 in assets but $140 in total investment exposure, if the NAV falls 30%, what happens?
Let’s say the fund has 1 share outstanding so the cost per share is $100. If the NAV falls 30%, the NAV is then $70. With still $40 of borrowing/leverage, the new effective leverage would be 40/70 = 57%.
The leverage went up because the NAV went down and borrowing was the same. The fund would be in a forced deleveraging environment. They would then have to reduce the amount of borrowing from $40 to at least $35 and probably lower. This means that instead of having $140 in assets producing 5% portfolio yields (as an example) and $7.00 in net investment income, the new yield would be $6.50 or a reduction of nearly 8%.
Buy the NAV, not the Discount (or yield)!!
This is why we say this all the time to our members. The discount is only of interest and concern if the NAV is stable and performing. As we saw in June, NAVs can wipe out more than a year’s worth of yield or discount tightening potential.
For example, in the month of June alone, we saw some funds lose 10% or more of NAV. Look at Neuberger Berman High Yield Strategies (NHS) which has a very attractive (to the typical CEF investor) yield of 13.0%. Many investors see that and say, “Whoopee! Powell can keep rates low forever for all I care since I can get 13% income yields!”
But, in reality, yield and discount can be meaningless much of the time. This is one of those times.
NHS’ NAV was down 11.6% in the month of June alone. The NAV is down 26% so far this year, even when including the distributions! What good is a 13% yield if the NAV is down that much. Leverage is sitting at 45% and they are likely reducing borrowing at this moment- not the best moment to be selling anything- in order to prevent that leverage ratio from exceeding 50%.
So investors who got suckered in by the 13% yield on June 1, 2022 are now left with 11.6% less capital in 30 short days. And buying on discount is no better as there is no assurance that discounts will ever close.
Buying the NAV is the most important consideration when selecting a CEF to include in your portfolio. A top-performing NAV will command a higher valuation, all else equal, to similar funds in the sector or category. If not, that CEF with top NAV performance is trading at a discount to other, inferior funds in the same sector, that is where there’s opportunity.
Getting back to NHS, investors can use free and good data sites like CEFData.com. Here is an excerpt from the NHS page of CEFData.com.
CEFData.com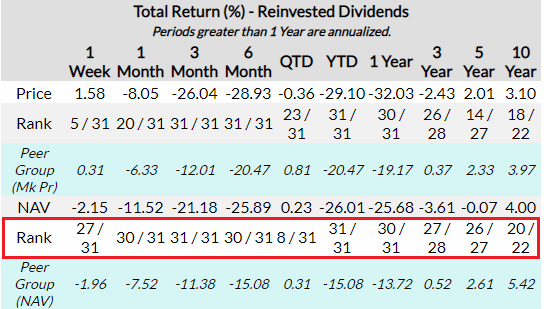
For those who want to focus on NAV, this is extremely important. The rank line (second from the bottom) looks at the NAV of NHS versus the rest of the funds in the same category. On nearly every metric they are at or near the bottom.
What good does the larger yield or wider discount matter if the NAV is underperforming long-term. This fund SHOULD trade at a very wide discount and have to juice the yield to get investors to buy it.
NCZ postpones distribution
Virtus Convertible & Income II (NCZ) on July 1st announced that it had postponed payment of its monthly distribution because it was in breach of the leverage covenants.
Recent market dislocations have caused the values of the Fund’s portfolio securities to decline and, as a result, the Fund’s asset coverage ratio for total leverage as of June 30, as calculated in accordance with the Investment Company Act of 1940, was below the 200% minimum asset coverage guideline. Compliance with the asset coverage ratio is required by the Fund’s governing documents for declaration or payment of the monthly dividends. As a result, the Fund is not authorized to declare or pay its monthly distributions until the coverage ratio is in compliance. The Fund intends to resume declaration and payment of its monthly distributions once its coverage ratio is in compliance.
This is something investors need to worry about with the high leverage funds as the NAV decline further. Eventually, funds will need to cut borrowing in order stay under the 50% leverage cap.
On July 8th, they announced the payment of the previously delayed distribution and reconfirmed the August 1st distribution.
Investors should really be looking at leverage levels as one of THEIR FIRST levels of analysis.
Here are the funds with the highest amounts of effective leverage at the moment according to CEFData.com. PIMCO typically runs leverage at levels that are near the caps. Already, we’ve seen PIMCO reduce borrowing in the last few months as their NAVs have come down sharply. It wouldn’t be surprising to see some de-leveraging in RCS, PCM, and other taxables if the market takes another leg lower. It wouldn’t even be a shock to see the munis drop leverage if rates move higher again.
CEFData.com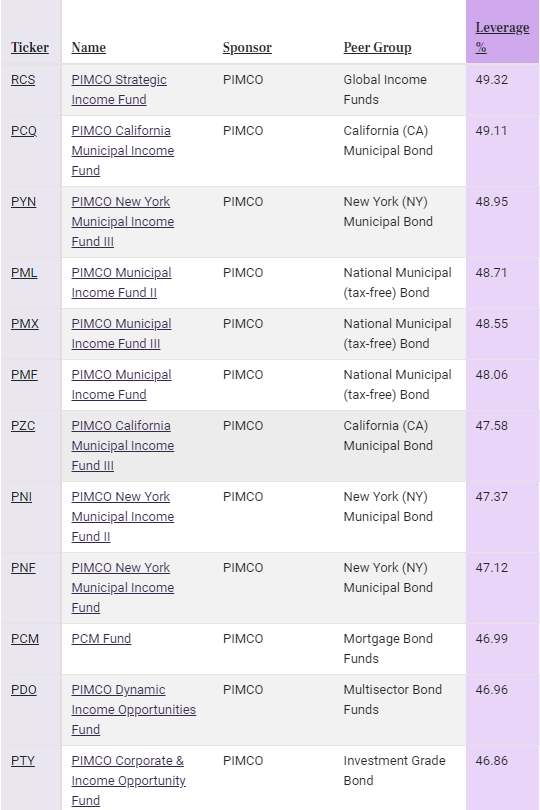
Where The Best Opportunities Lie….
There are only a few NAVs I would be buying at this moment, and most are in the high-quality sectors like munis, investment grade corporates, agency mortgages and perhaps IG preferreds.
Here are the best performing NAVs YTD according to YCharts:
YCharts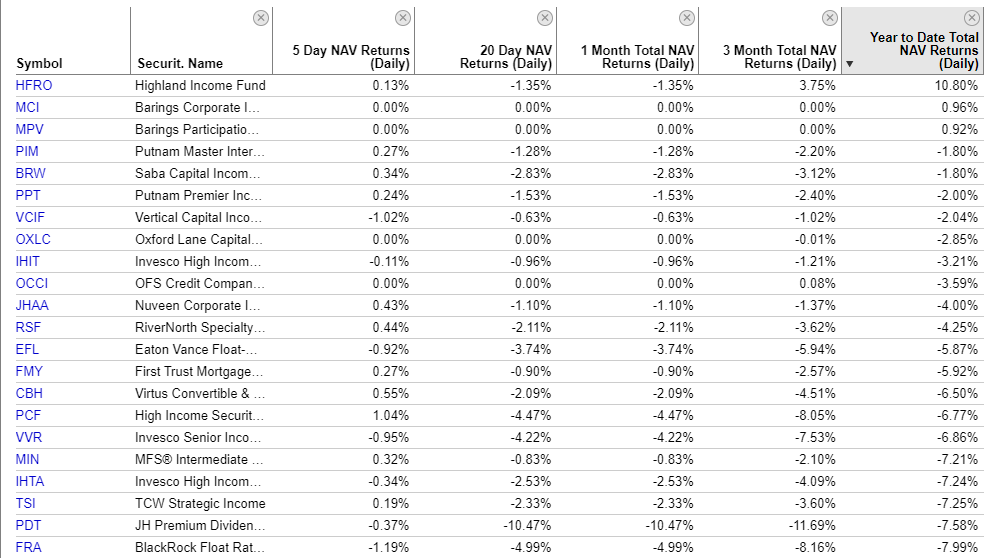
I would discount HFRO as being unreliable. In terms of high quality, Putnam has a couple of funds that are compelling but both have been bid up recently. In our Morning Note on July 7th, I recommended swapping from PPT to PIM based on the valuation differential.
Munis:
- Nuveen Municipal Credit Income (NZF), yield 5.40%, discount -7.4%
- Invesco Muni Income Opp (OIA), yield 5.72%, discount -3.9%
- BlackRock MuniVest (MVF), yield 5.32%, discount -7.8%
- BlackRock Taxable Muni (BBN), yield 8.09%, discount -5.1% (taxable muni)
Mortgages:
- Invesco High Income 2023 (IHIT), yield 6.2%, discount -3.8%
- Western Asset Mortgage Opp (DMO), yield 10.3%, discount -10.3%.
- Vertical Capital Inc (VCIF), yield 9.25%, discount -12.2%
Investment Grade:
- Angel Oak Dynamic Income (DYFN), yield 8.6%, discount -10.6%
- Invesco Core Bond (VBF), yield 4.01%, discount -6.4% (no leverage)
- Putnam Master Inter Income (PIM), yield 7.63%, discount -6.2%
Individual Preferreds ($25 par):
- RiverNorth Opportunities – A (RIV.PA), yield 6.12%, price $24.01
- Eagle Point Income (EICA), yield 7.06%, price $23.13
- RenaissanceRe (RNR.PF), yield 6.18%, price $23.27
Concluding Thoughts
The market remains in a downtrend and despite some wide discount opportunities, I just don’t see the upside catalyst to turn NAVs around (much lower rates and tighter credit spreads) in the near term. As such, we remain mostly on the sidelines waiting for a better entry point. There are some decent opportunities in high-quality for those that are not tactical and far more a buy-and-hold investor.
We think the time for getting into junkier credits, preferreds, and the like is coming later this year as credit spreads continue to widen.
Be the first to comment