

naphtalina/iStock via Getty Images
Macro Picture
Stocks had another volatile week and despite a strong rally on Friday still finished in the red. On Thursday, the S&P touched the lowest level since June 22nd before the rally.
Three things were on every investor’s worried mind this week: the start of what is anticipated to be an ugly second-quarter earnings season, the US CPI print, and a lot of global macroeconomic data that was likely to show further deterioration.
By the middle of the week, the concerns seems justified with the market down about 3%-4%, terrible bank earnings from JPMorgan (JPM) and Morgan Stanley (MS), and then inflation coming in hotter than expected… AGAIN.
Yet, when the dust settled, the market finished down just 1% and 10-yr yields were off just 15 bps. Highly cyclical sectors like semis and banks finished the week UP 1-2%. What the deuce?
The narrative appears to be changing again. As we’ve described, the first quarter was about a rising rate/rising inflationary market and the associated global monetary response. In the second quarter, that shifted to a recessionary narrative characterized by stabilizing yields, still rising interest rates and inflation, widening spreads and economic deterioration.
In the third quarter, we seem to be shifting again. This quarter’s narrative will likely be less black and white and more focused on the magnitude of the slowdown, how far down earnings estimates will drop, and the depths at which global assets will be sold down.
Inflation will likely shift from ‘calling the peak’ vs how fast it will decline. Additionally, investors will question when the central banks (namely the Fed) will blink and say enough is enough in terms of economic pain, and pivot back to a neutral stance. That would mean assessing an inflation rate that both policymakers and the Fed can live with for the next year or two.
Elevated inflation, despite a recession, could be here to stay for the next couple of years. This could be especially the case if the recession is very mild accompanied by little to no job losses.
The Clearbridge Anatomy of a Recession Dashboard indicator had three recession risk indicators shift in June. The Retail Sales number went into caution territory (yellow from green). The ISM New Orders also went to caution (yellow). And Credit Spreads went from yellow to red (recession risk high).
Clearbridge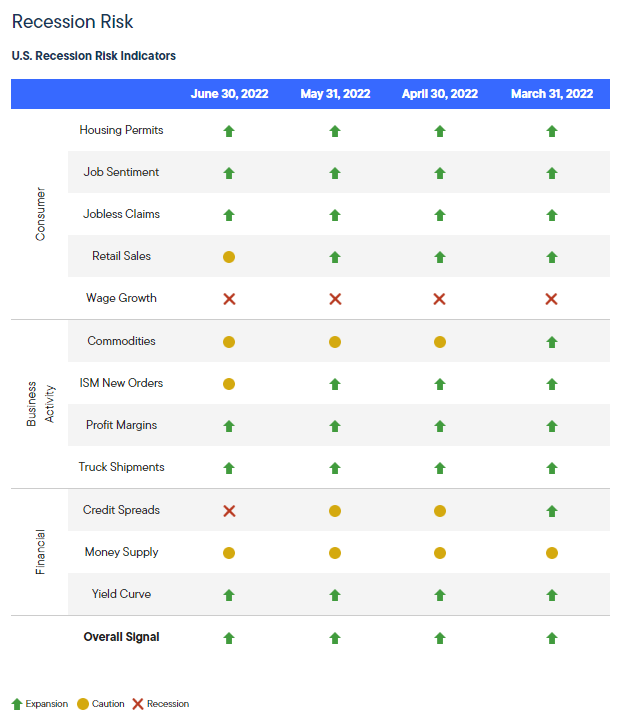
We’ll see when the Fed takes its foot off the brakes. But precious metals for the first time are starting to look attractive as an inflation hedge.
lplblog
CEF Market Review
alpha gen capital
Discounts were largely flat on the week with muni bond CEFs rallying slightly and taxables/equities barely budging. We’ve seen a bit of a rally in discounts in the last month. We can see that below with taxable bonds hitting -8.3% on June 19th (with an interim weekly low of -8.85%) and then closing 350 bps over the proceeding four weeks.
In terms of percentiles, taxable bond CEFs hit the 92nd percentile meaning that in 92% of observations going back to 1996, discounts were tighter. That’s not a bad setup. Or is it?
alpha gen capital
And they continue to fall as spreads meander in the mid-5s. Spreads have been orderly but relentless in their move higher. They did hit 6.0%, which caused the Anatomy of a Recession from Franklin Templeton/ClearBridge to change that indicator in their recession dashboard to “recession.”
ycharts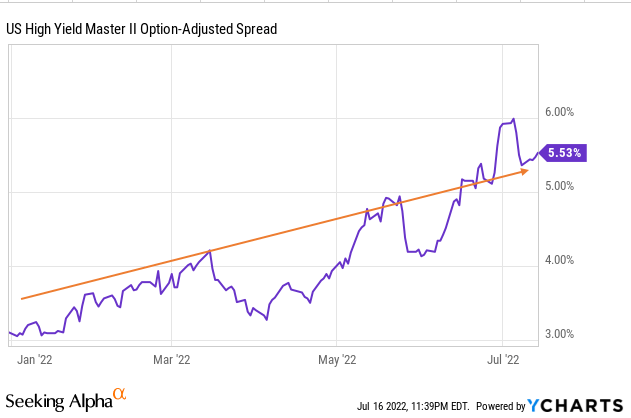
Using a barometer of about 5 different high yield bond funds, the average NAV is down about 1.4% in the trailing 30 days. So while discounts are wide, we are likely to see a bunch more NAV declines in the next few months with the recession.
The bleed lower in NAVs has been relentless. And no amount of trading can make up for a recessionary headwind to NAVs. I selected a few high yield CEFs: PDO, PTY, HYI, ISD, and HIX just as examples. Really, I can use anything there and the result would be largely the same.
ycharts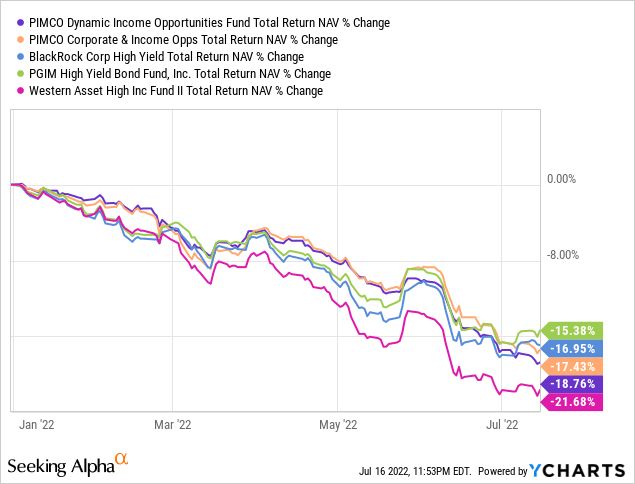
Loan funds haven’t fared much better though they have some better demand thanks to the rising rate hedge that they boast. You can see that they’ve saved you about 5-7% so far this year. Little comfort when you are down double-digits but better than a kick in the teeth.
ycharts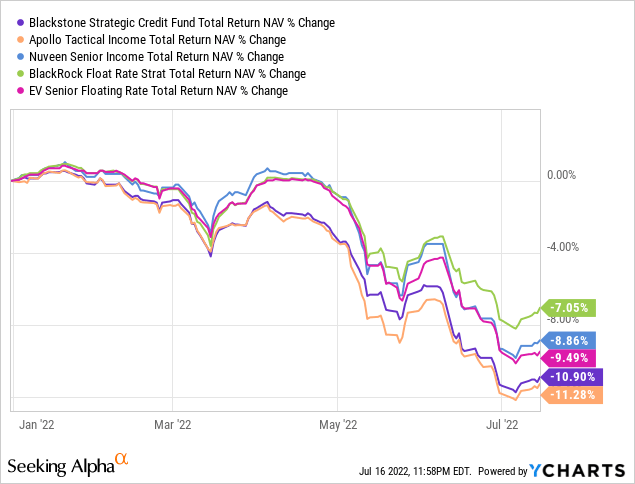
We saw some significant movement in select Core funds last week. The biggest winner was BNY Mellon Muni Bond Infra (DMB) which jumped 9.4% on the week. If you own it….. SELL IT. The premium has reached 10%+ and it never trades like that. It was a recommendation by another service and the large membership base pushed up the price since only about 65K shares trade daily.
alpha gen capital
I’m not liking anything on the right side of the table. Sure, a few things look like they’ve sold off unfairly and normally I would be nibbling on these to get some alpha but the falling NAVs are just too great a headwind today.
I’m far more a seller than a buyer on CEFs today and have been covering a bunch in the Morning Missives in the last week. Here are some more:
The Eagle Point funds look pricey here too. They’ve run up in price as if the NAV will adjust significantly higher. While they may get a higher mark in July than June (if things continue the way they are) it is still not going to be enough to offset the high premiums on both funds.
But my bet would be a lower NAV for July, as we’ve seen every month so far this year. On December 31, the NAV was $13.39. By March 31, it had fallen to $12.64 (-5.6%). But by June 30, it was down to $10.08 (-25% YTD). I would be a seller of both EIC and ECC here. I prefer to own these from the baby bond side through ECCW which now trades under par at $24.38 with a current yield of 6.86%.
MainStay MacKay Defined Term Muni Opp (MMD) is a Core Holding that is now in ‘sell’ territory. The premium has reached +6.1% which for me is a bit pricey given the deals in the muni space so I swapped out of it and added to BNY Mellon Strategic Muni (LEO).
Be careful out there as the environment is not yet fully incorporating a recessionary outcome for risk assets, especially high yield. While the high yield market is going into this recession in the best shape that they’ve been in, in some time, it will still result in significant selling pressure widening out spreads and hitting NAVs.
Buy-and-hold investors who muster through this can sit back and feel good that eventually, NAVs will recover- it’s just a big when?
Up Next Two Weeks:
- June 28: Salient Midstream & MLP (SMM) announced that it will reorganize SMM into Salient MLP & Energy Infrastructure (SMPLX). MLPX is an open-end fund that is a series of Salient MF Trust with approximately $849 million in net assets and is also managed by Salient Capital Advisors, LLC, the investment adviser of SMM, using a similar investment strategy.
Commentary
I keep seeing around “Buy this 9% yielder” or “these investments offer a margin of safety” but nowhere in these articles is an assessment of the NAVs. Are these “margins of safety” 10%+ discounts worth it if the NAV falls another 10% in the next few months?
I understand the notion because no one really knows what will happen near-term. And many investors are very long-term oriented meaning that they are looking out several years at a minimum. For them, buying here and seeing the NAV fall 10% or so is immaterial because several years from now, the NAV will have likely recovered (just like most do after prior recessions).
So the question you have to ask yourself is if you are looking at many years or are you looking out until September? For me, I have the luxury of being immersed in this stuff every day. That means I can make my decisions with more data and in a more timely manner.
I realize most don’t have that luxury which is why 1) you subscribe to this service and 2) many are simply buy-and-hold. That is, you buy when discounts are wide and you ride them tight even if it takes years because in the process you are collecting a monthly income stream.
stockcharts
The above chart for PTY shows the price level of it rising from its initial value of $15 to as much as $24 and as low as $5.30 (during the Financial Crisis). But after nearly 20 years, the price of the CEF is nearly the same as when it IPO’d. So if an investor can ignore the noise and focus on the monthly income stream, you would do well.
I realize this is easier said than done…
This is why I continue to think behavioral investing and the psychological forces that have a profound impact on investment decisions play a far more important impact than the actual security selection. In fact, we had a member during the 2020 Covid recession who bemoaned me for telling people to buy the crash (and I fully admit I was too cautious coming out of March 2020).
He had no problem telling people on the chat about how he was 100% cash and how people who bought the crash were dumb, etc. That this crash was different and that the economy would be in shambles for a long time. Eventually, as the market continued to recover throughout 2020, he ceased participating. Sometime in early 2021, he canceled his subscription.
The moral of the story is that it is too difficult to make these binary choices where you have to be right… twice. The sell before the drop and the buy before the rebound. Instead, making small tilts and adjustments for risk within certain asset categories makes the most sense if you are not going to truly be a buy-and-holder.
I continue to take risk today (heck, it is entirely possible we’ve hit a bottom a few weeks ago) but it is far more measured than it could be. A recession is so highly likely but a lot of recession is currently priced in at the moment. So as I noted in the Macro Picture, the narrative will now shift from IF we have a recession to the magnitude of one. And that will shape the markets over the next 6-12 months.
CEF News and Corporate Actions
Distribution Increase
N/A
Distribution Decrease
Liberty All-Star Growth (ASG): Distribution decreased by 21.4% to $0.11 from $0.14
Liberty All-Star Equity (USA): Distribution decreased by 11.1% to $0.16 from $0.18
Rights Offering
Gabelli Global Utility & Inc (GLU): The fund concluded a transferable rights offering raising $9.4mm in new assets. The fund had $149mm in assets prior to the offering.
Be the first to comment