

Bill Oxford
Investment Thesis
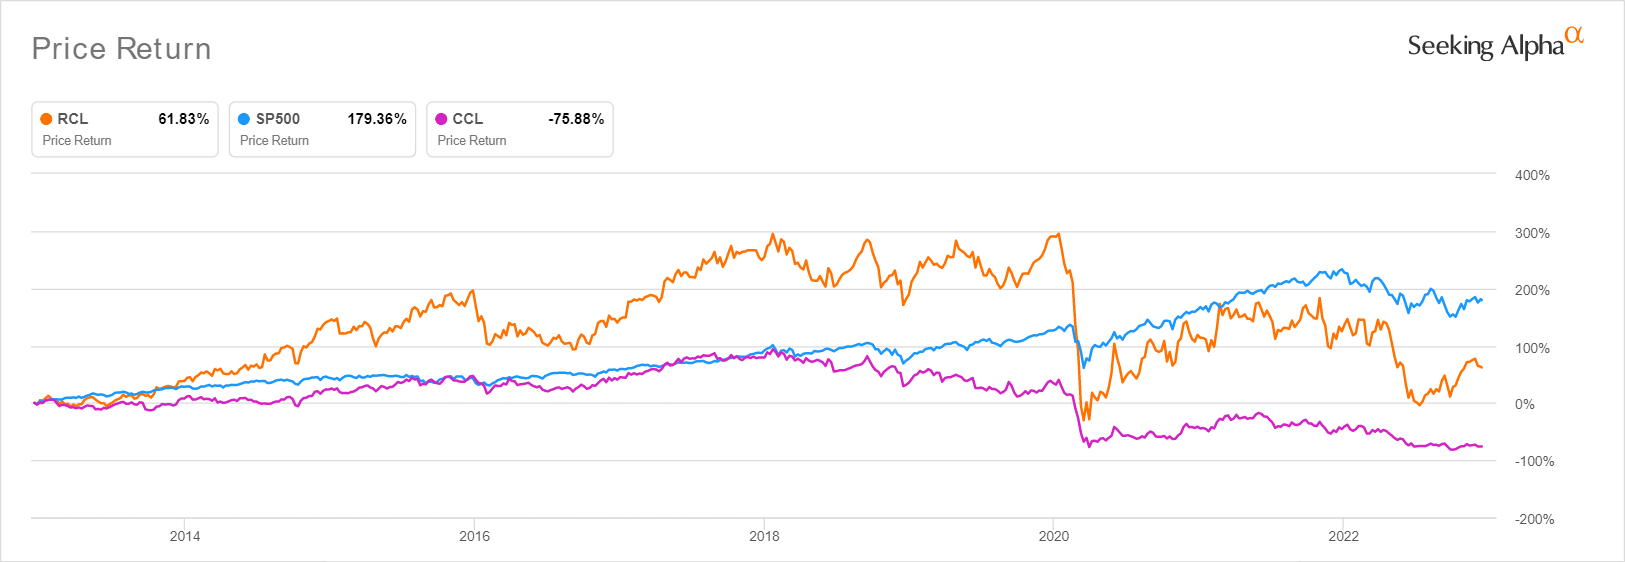
CCL & RCL 10Y Stock Price
Seeking Alpha
Considering the fact that cruise stocks have generated minimal returns to date, we do not understand why anyone would invest in them, since both Carnival Corporation & plc (NYSE:CCL) and Royal Caribbean Cruises (NYSE:RCL) are not paying dividends as well. CCL offers a 5Y total price return of -85.3% and 10Y of -70.7%, while RCL fares slightly better at 5Y of -53% and 10Y of 89%. Even after the -16.17% correction from December 2021’s peak levels, the S&P 500 Index has offered much improved 5Y returns of 49.31% and 10Y of 179.36% in comparison.
Combined with the uncertain macroeconomics and the Fed’s raised interest rates through 2023, there will be minimal catalysts for recovery in the short term, especially due to their slower return to pre-pandemic profitability over the next few years.
CCL & RCL’s Performance May Remain Disappointing
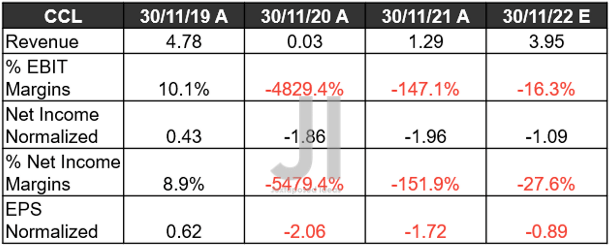
CCL Revenue, Net Income ( in billion $ ) %, EBIT %, and EPS
S&P Capital IQ
Over the next few days, market analysts have projected that CCL may report an impressive FQ4’22 revenue of $3.95B, despite the supposedly weaker traveling season. However, it is apparent that the cost of revenues and operating expenses remain elevated, pointing to its lack of profitable margins and negative EPS for the upcoming quarter.
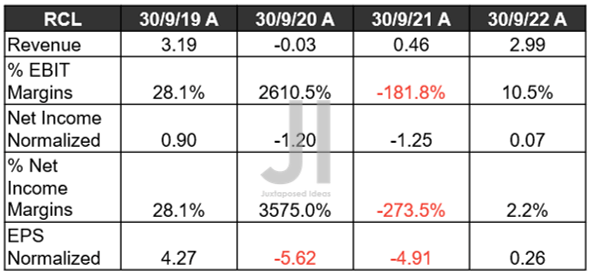
RCL Revenue, Net Income ( in billion $ ) %, EBIT %, and EPS
S&P Capital IQ
Meanwhile, RCL has performed relatively well during its recent FQ3’22 call, notably impressing market analysts with its first positive operating income of $308.61M and EBIT margins of 10.5% since the start of the pandemic in 2020. Thereby, also sparking its first positive EPS of $0.26 against consensus estimates of $0.17. However, despite the record booking volumes, it is apparent that the company continues to suffer from elevated costs, given its lackluster FQ4’22 guidance of up to EPS -$1.5.
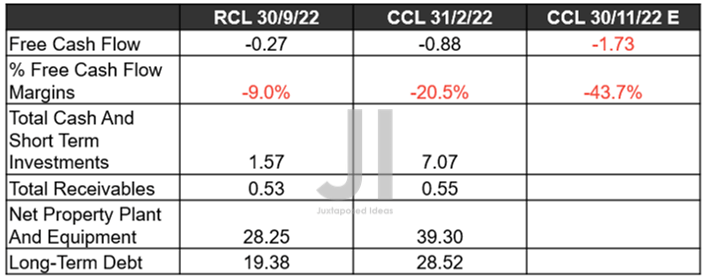
RCL & CCL FCF ( in billion $ ) % and Balance Sheet
S&P Capital IQ
Nonetheless, we remain cautiously optimistic, due to CCL & RCL’s robust total receivables of $0.55B and $0.53B from the 2023 bookings, respectively. The latter’s cash/ equivalents of $7.07B are more than sufficient to weather the short-term uncertainties as well. However, its tremendous long-term debts of $28.52B have also posed a profitability threat, since the company is looking at enormous interest expenses of $1.51B over the last twelve months [LTM], growing tremendously by 732.52% from FY2019 levels of $206M.
On the other hand, RCL has comparatively lower interest expenses of $1.21B over the LTM, increasing reasonably by 296.56% since FY2019. However, with RCL and CCL looking at $8.71B of debt maturity due 2024 and $7.44B (based on its previous annual report), respectively, it is very likely both companies may need to rely on further debt refinancing or leveraging in the intermediate term. We’ll see.
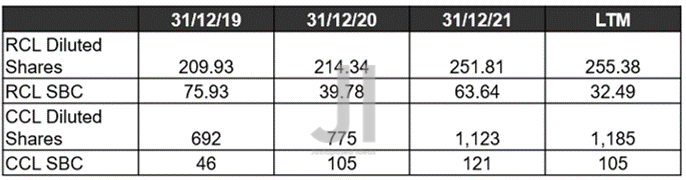
RCL & CCL SBC Expenses ( in million $ )/ Share Dilution ( in million )
S&P Capital IQ
Meanwhile, RCL has proved expedient in reducing its SBC expenses to $32.49M by the LTM, indicating a decline of -57.21% from FY2019 levels, contributing to the controlled increase in its share count and the health of its GAAP profitability.
On the other hand, CCL has heavily relied on SBC expenses over the past three years, expanding at an eye-watering 228.26% to $105M by the LTM. Combined with its multiple equity offerings in 2020 and 2021, it is evident that long-term investors have been diluted by 71.24% since the start of the pandemic. Given how the company will be reporting minimal profitability in FY2023, we may likely see a continued reliance on share dilution and SBC expenses in the short term.
When Are CCL & RCL Projected To Return To Pre-Pandemic Profitability?
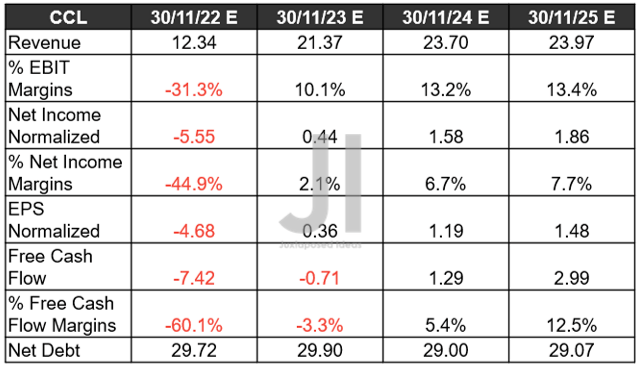
CCL Projected Revenue, Net Income ( in billion $ ) %, EBIT %, EPS, FCF %, and Debt
S&P Capital IQ
Over the next few years, CCL may continue its underperformance, despite the return of its pre-pandemic topline by FY2023. Its EBIT margins of 13.4% and net income margins of 7.7% could potentially remain pressing issues through FY2025 as well, compared to FY2019 levels of 15.7% and 14.6%, respectively. This is likely attributed to the rising inflationary pressures, which have decimated its gross margins by -27.8 percentage points to 25.5% by the LTM, compared to FY2019 levels of 53.3%, further worsened by its elevated interest expenses through 2030.
Though the CCL management has also valiantly controlled its operating expenses similar to pre-pandemic levels, it is apparent that the macro headwinds are working against the robust consumer demand. Despite the excellent projected FCF generation of $2.99B by FY2025, the stock’s near-term prospects remain uncertain, due to the minimal EPS expansion and the minimal deleveraging to $29.07B of net debts at the same time.
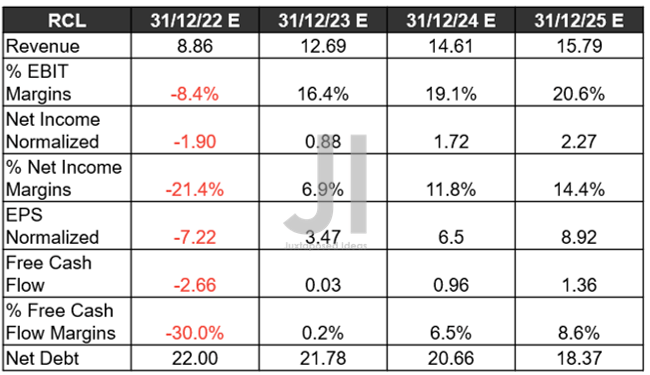
RCL Projected Revenue, Net Income ( in billion $ ) %, EBIT %, EPS, FCF %, and Debt
S&P Capital IQ
In the meantime, RCL is expected to perform slightly better, with its top line and margins somewhat returning to pre-pandemic levels by FY2024 and the EPS by FY2025. Thereby, also explaining the continued deleveraging efforts to $18.37B of net debts at the same time, though still naturally elevated from FY2019 levels of $11.55B. However, we reckon that the company may perform well moving forward, once there are reduced interest obligations over the next few years.
Only time will tell how 2023 will turn out, though early booking trends from Cyber Monday look relatively promising, significantly aided by the speculative price hikes ahead. Thereby, potentially leading to the upward revisions in their long-term prospects through FY2025. Meanwhile, we encourage you to read our previous article, which would help you better understand its position and market opportunities.
- Carnival: The Hurricane Is Not Over, Mixed Signals Ahead
- Royal Caribbean: Recession May Sink Demand And Profitability
So, Are CCL & CCL Stocks Buy, Sell, or Hold?
CCL & RCL YTD P/E Valuations
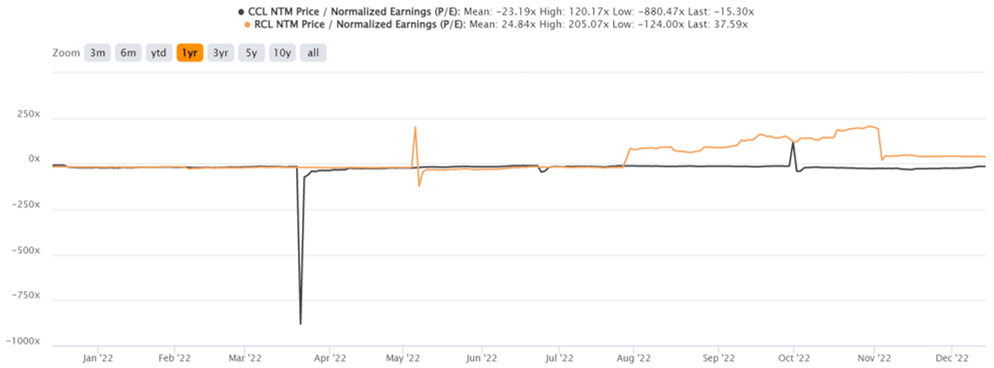
S&P Capital IQ
Both CCL and RCL are trading at elevated NTM P/E valuations of -15.30x and 37.59x, higher than their 3Y pre-pandemic mean of 13.74x and 13.05x, respectively. If we are to gauge certain price targets based on their FY2025 EPS of $1.48 and $8.92, CCL may outperform with a 227.65% upside to $20.33, while RCL also appears attractive with a 210.57% upside to $116.40. However, these numbers also seem to be overly ambitious in comparison to consensus estimates, due to their CCL’s target at $13.43 with a 50.39% upside and RCL at $78.33 with a 41.70% upside. Thereby, pointing to Mr. Market’s sustained pessimism levels, despite the Fed’s recent dovish stance.
As a result, we choose to remain skeptical about CCL and RCL’s long-term prospects and retain our hold ratings on both stocks. Conservative investors looking to offload may do so at the next pop, depending on their dollar cost average.
Be the first to comment