

Kwarkot/iStock via Getty Images
My work modeling REITs led me to notice that reductions in cap rates had strong impacts on earnings growth. The first thing to come from that was this article providing the relevant math and some big-picture graphics. Today’s article will minimize the math and maximize applications.
The present article applies those results to 9 REITs that lease free-standing structures to tenants on a triple-net basis, which we will designate here as “net-lease REITs.” We will see quantitatively how threatened each of them is by the ongoing compression of cap rates.
“Cap rate” is real-estate jargon, defined as the ratio of Net Operating Income, or NOI, to property values. After a decade of relative stability, cap rates have been plummeting in recent years, as you can see in this plot from NAREIT.
NAREIT T-tracker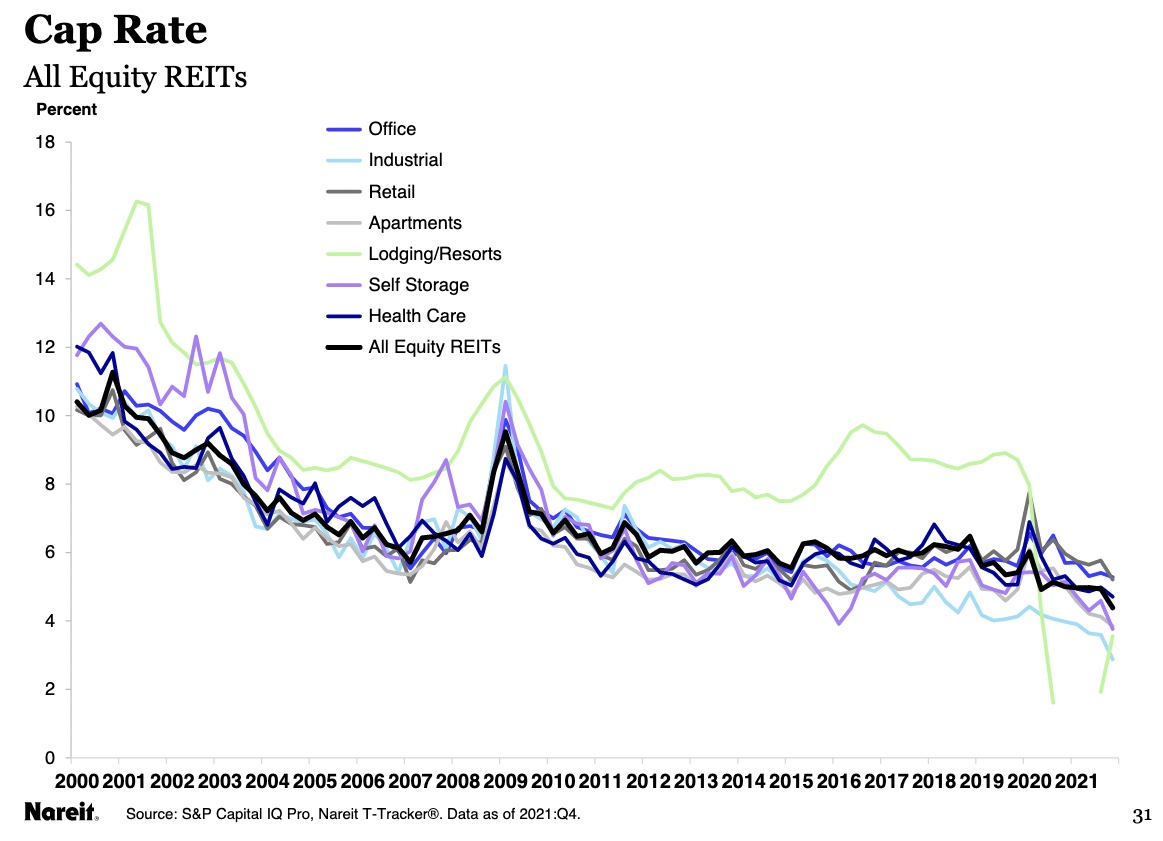
In the net-lease sector, most if not all of the 9 REITs we will discuss have noted cap-rate compression in their earnings calls. It seems clear in some markets that preservation of principal has become more central to many investors than earnings. That is the only way you get cap rates in the 1s and 2s, which have been seen in other property sectors in some locations.
To my mind, it is unclear what will come next, as usual. Further compression is certainly possible and would not be a surprise, especially if interest rates remain suppressed during a decade with quite a bit of inflation.
With that as background, let’s explore the net-lease space. Here is the list of REITs to be discussed. This is nearly all of the group covered in depth by REIT/base. At High Yield Landlord, we often discuss these REITs and we are invested in several of them.
|
Agree Realty (ADC) |
|
EPR Properties (EPR) |
|
Four Corners (FCPT) |
|
Essential Properties (EPRT) |
|
National Retail Properties (NNN) |
|
Realty Income (O) |
|
Spirit Realty Capital (SRC) |
|
STORE Capital (STOR) |
|
W. P. Carey (WPC) |
A last note here is that NOI in the following is always the cash NOI, with non-cash revenues demanded by GAAP removed. Similarly, cap rates are cash cap rates.
External Growth
All but one of these REITs intend to grow in part by issuing new shares of stock and investing the proceeds in ways that increase per-share earnings. They need to do this to sustain the rate of net acquisitions in their plans. The exception is National Retail, about which more later.
Following Chris Volk, and as explained in that recent article (and in his forthcoming book in a more general way), one can express the return on equity for new investments as the product of NOI/New Equity times AFFO/NOI. The first of these is the cap rate divided by the fraction of equity used (equal to 1 minus the Debt Ratio).
The second, AFFO/NOI, is what I call the V-factor. (AFFO, or Adjusted Funds From Operations, is the net cash earnings of the REIT from its real estate operations, after all costs.) Here is AFFO/NOI for new acquisitions by each of these 9 REITs, and some subsidiary information.
RP Drake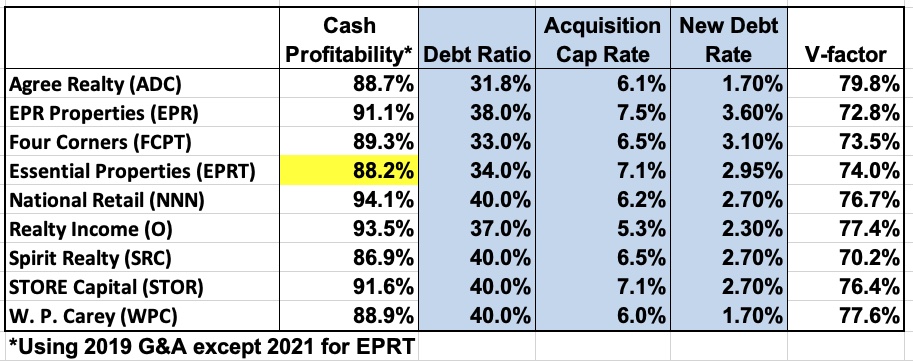
The first column here is 1 less the ratio of cash costs to NOI. Cash costs include for example G&A and recurring capex. Those numbers all came from REIT/base.
I assembled the columns shaded blue from earnings calls and investor presentations. Some of these REITs, such as STORE, disclose these things pretty clearly, others not so much. The numbers are intended to represent 2022, and are definitely close to the actual values. But some will not be exact.
One uses the first four columns in ways described in previous articles to find the V-factor (AFFO/NOI for new acquisitions). One sees that the answer here is 75%, give or take 5% depending on details.
The next graphic shows the resulting Investment Yield, defined here as the ratio of new AFFO to new equity. This is displayed here along with the Traded Yield, defined as the ratio of AFFO to Market Cap.
RP Drake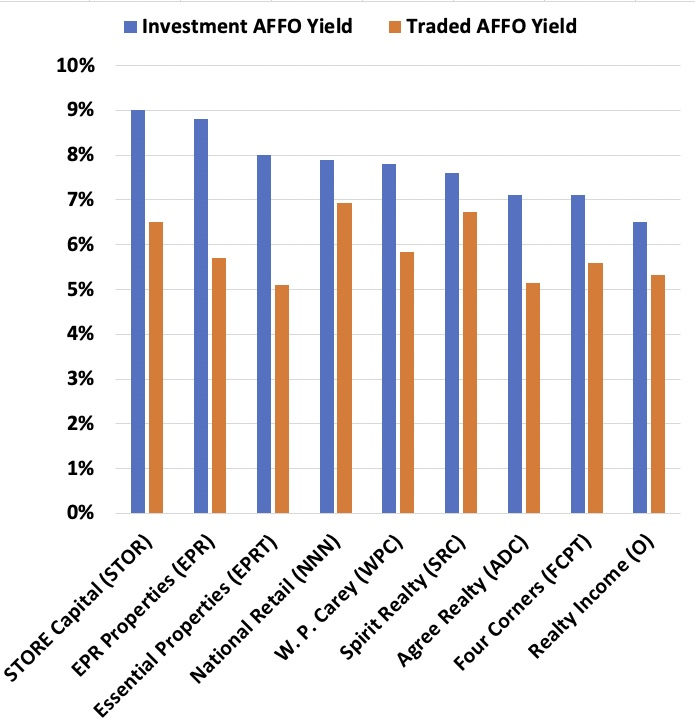
Store Capital, with their business model focused on financially sound firms that are dependent on banks for debt, is the most profitable by this measure. Realty Income, with their focus on the investment-grade tenants they view as most secure, is the least profitable.
The market clearly does not value these REITs in any direct relation to their Investment Yields. But it does value AFFO at a rate lower than the Investment Yield. (In round numbers, the dividend yield is about 80% of the Traded Yield.)
That is a good thing, because issuing stock to raise equity only increases AFFO when the Investment Yield exceeds the Traded Yield. Here is the ratio for these REITs. The AFFO generated per share issued is proportional to the difference between this ratio and 100%.
RP Drake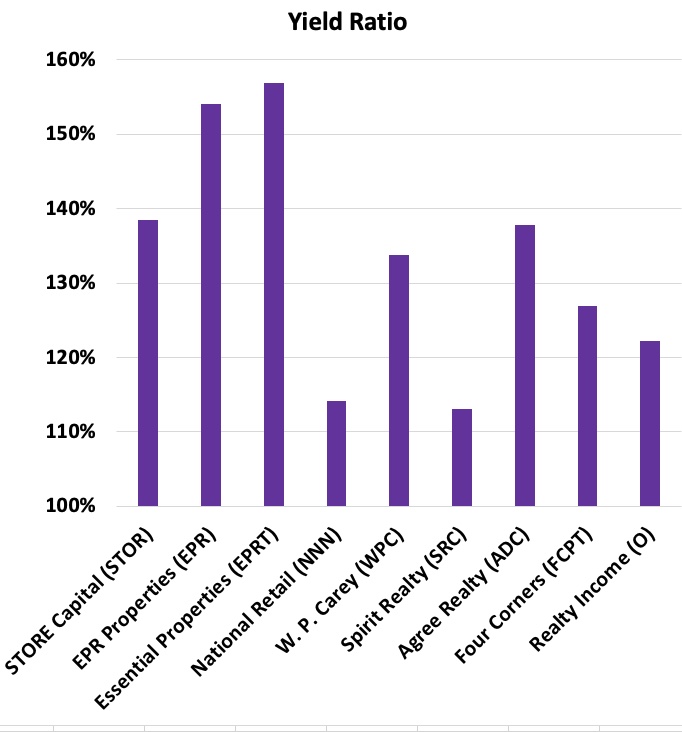
You can see that it is not very beneficial for National Retail or for Spirit Realty to issue shares. This is no problem for National, since they don’t really want to anyway. But it will be tough for Spirit to grow much externally until Mr. Market settles for a smaller dividend yield and Traded Yield.
In contrast, the REITs positioned to benefit most from share issuance are EPR and Essential Properties. Ironically, EPR plans to issue few if any shares in 2022. They have plenty of funds to support this year’s acquisitions.
This is not quite the end of the story on the impact of share issuance for external growth. To discuss the full picture, we need to also know about internal growth, so we take that up first.
Internal Growth
The so-called internal growth arises from two or three sources, depending how you add things up. One major source is retained earnings.
A simple example shows the essence. If you retain 20% of AFFO, leverage it up to 30%, and invest it at a 10% yield, you increase AFFO by 3%.
Increases in rent can be a second major source of AFFO growth. They increase NOI directly, and can be leveraged as well.
One can also include any profits from dispositions, but these are typically small. Here we assume these to be folded into net acquisitions.
The first two produce the inputs for growth shown here:
RP Drake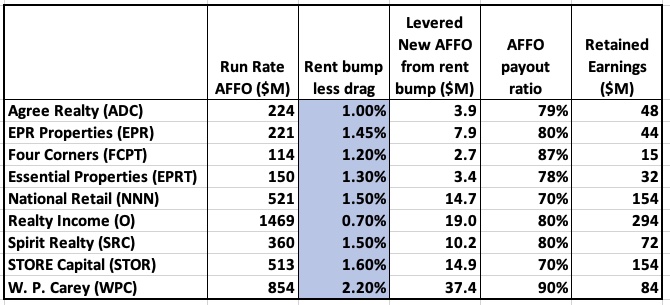
Here again, the column shaded blue is information gleaned from earnings calls and investor presentations. I took the rent growth drag to be 0.3%. The other inputs are from REIT/base, using 2021 numbers unless it seemed clear that they were an aberration.
These numbers then imply the rates of internal growth of AFFO shown here.
RP Drake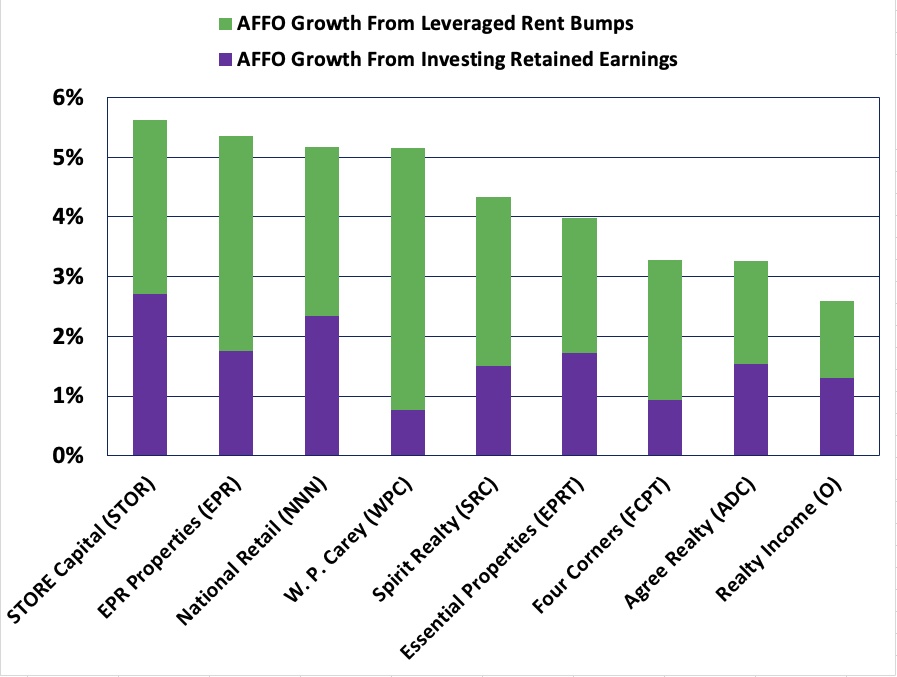
One sees a diverse mix. W.P. Carey pays out a very large fraction of AFFO, something they are likely to grow out of as they complete their ongoing transition away from assets under management. So their growth from retained earnings is relatively small now.
But their sector-leading rent bumps make up for that. When they finally become able to get their payout ratio down, they will generate even more AFFO growth internally.
STORE, in contrast, not only has the highest internally generated growth of AFFO. They also get comparable contributions from both rent bumps and retained earnings.
Agree and Realty Income, with their heavy emphasis on external growth, low investment yields, and low rent escalators, have much smaller internal growth.
It is worth emphasizing that these REITs do not need to issue any shares to achieve the rates of growth shown. At present dividend yields, STOR, NNN, WPC, and SRC should generate double-digit total returns even without any share issuance. EPR seems likely to also get back there during 2022 as they bring their dividend back up.
Overall Growth and Share Issuance
Now we return to issuing shares. In addition to enabling growth of AFFO, the new shares dilute the gains from internal growth. This implies that the Investment Yield must reach a threshold level before issuing shares will increase per/share earnings. Here is a plot showing how this goes, with the specific parameters of Realty Income:
RP Drake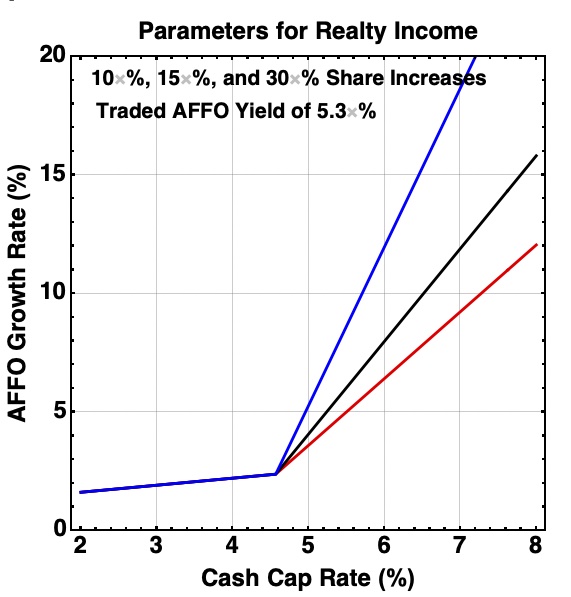
Above the break point evident on this plot, issuing shares becomes accretive to shareholder value rather than dilutive. Below that point, the calculation assumes no shares are issued.
The break point does move as the Traded Yield moves. For example, a 10% increase in share price would move it on this plot from 4.57% to 4.2%.
Below the break point, the growth rate decreases much more slowly as the cap rate drops further.
For current traded yields, we can look at the amount of headroom each of these REITs has on cap rates. Here are the cap rate at the break point, the acquisition cap rate, and the difference (quantified on the right axis):
RP Drake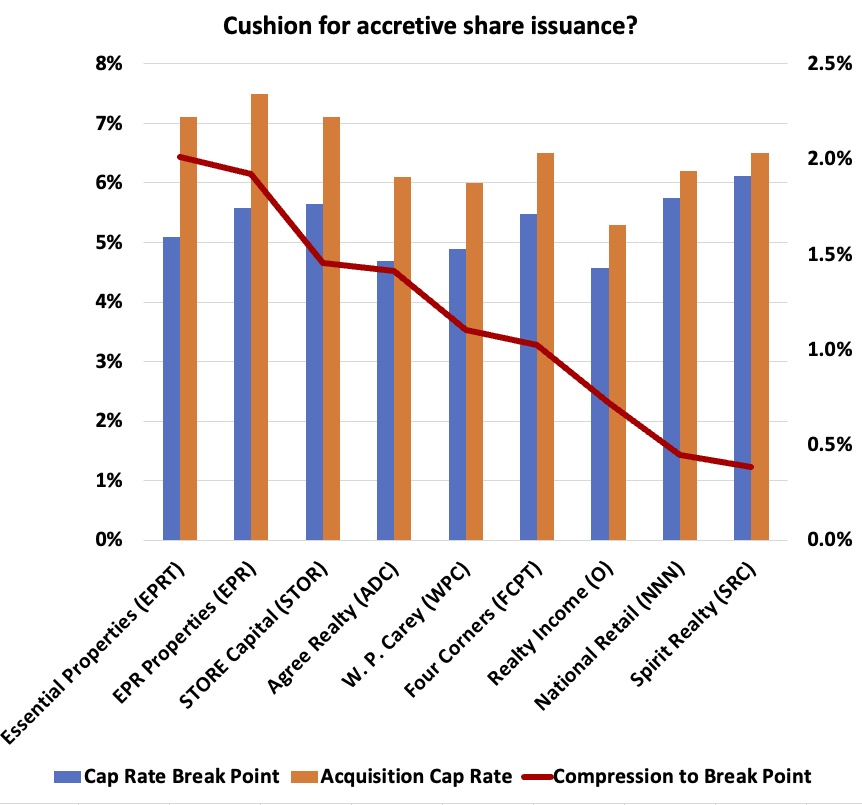
We see that Essential Properties and EPR could still issue shares accretively even for a further reduction in cap rates of 200 basis points. STORE, Agree, W.P. Carey, and Four Corners all have 100 basis points or more of headroom.
In contrast, Realty Income, National Retail, and Spirit all have less than 100 basis points of headroom. These each deserve comment.
Realty Income, which has the smallest internal growth rate of AFFO, depends heavily on share issuance. Their business model is an external growth model.
In addition, their investment-grade tenants are in a sector in very high demand. It is not clear how much this will matter, though. They are now so big that they have to “elephant hunt” for acquisitions, in the words of EPR CEO Greg Silvers.
We’ve seen this elephant hunting already in the merger with VEREIT and their casino acquisition. It is unclear to me whether it will continue to make sense for Realty to pile up $10M properties in the future. They are now playing in a different arena.
National Retail has never issued a lot of shares, and probably cares little where their break point is. They are the most conservatively run REIT I have ever analyzed, with a very secure business model that will make money forever from internal growth alone.
Spirit Realty is the one whose plans face the most immediate threat. Spirit has impressive and capable management, but events have created a rough road for them.
Spirit needs good growth to convince the market to become friendlier and price them at a smaller Traded Yield (and dividend yield). They have issued about 15% of new shares in each of the past two years, so they are actively seeking external growth.
Spirit guides to 9.2% AFFO/share growth in 2022 at the midpoint. But their actual growth rate beyond that will depend critically on what happens to the cap rates they are able to find. My sense of them remains that we don’t know who Spirit will be when they grow up.
Value of Internal Growth
In my previous article, I suggested that perhaps it made sense to value these net-lease REITs based on their internal growth alone, because the external growth is so uncertain.
If one takes that approach, one will give credit for external growth only as it is achieved. Each year one would adjust the valuation to a multiple of the current or guided AFFO.
This is an extremely conservative approach, and what it gives might be viewed as minimum fair values. Most of these REITs will produce total AFFO/share growth significantly above the internal growth.
If we take this approach seriously nonetheless, here is what is implied for these REITs:
RP Drake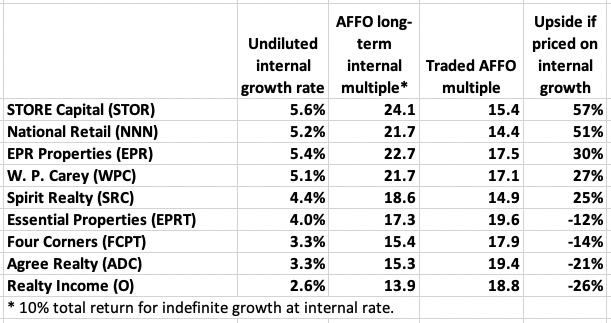
STORE and National Retail are the clear winners here. These two REITs are severely undervalued based on internal growth alone.
The market apparently has yet to forgive them for having tenants that governments shut down during the pandemic. This is in spite of the fact that almost none of these tenants went bankrupt and nearly all of them are paying back the deferred rent.
I have nothing to add here to my recent article on EPR Properties. Also nothing more on Spirit or on W.P. Carey or Realty Income beyond what was said above.
Essential is very new. They have been issuing a lot of shares as they try to establish scale. I see their business model as a variation on STORE’s, as discussed in this article.
Four Corners is only a few years older, with a significant focus on restaurants. They have issued relatively few shares. My understanding of who they are is pretty limited.
Finally, Agree has been extremely successful over the past decade with a business model that relies heavily on external growth. They produce comparatively little internal growth.
Agree has a fair bit of headroom now, but if cap rates continue to compress, then their ability to grow AFFO per share would suffer. To my mind, ADC is the stock whose value is most at risk in the event of sustained cap-rate compression.
Concluding Remarks
I want to emphasize that my claim is not that ADC and O, for example, are overvalued. Rather, it is that their present market valuation is not supported by their ability to generate internal growth.
In my view, at least 8 of these these REITs have capable management teams. (My knowledge of Four Corners is insufficient to have an opinion.) Yet they differ strongly in their business models and this has implications.
When the market is friendly to them, the REITs that focus on external growth can really deliver. But they are completely dependent on that market valuation.
Being very distrustful of Mr. Market, my own choices are usually not to invest in such REITs. This is also why I prefer Equity Lifestyle (ELS) over Sun Communities (SUI).
EPR has a different model in their exclusive focus on experiential tenants. In addition, this study was a pleasant surprise to me when it showed that both EPR and W. P. Carey are able to produce substantial internal growth. Some details of each are less than perfect in my view, but those issues are for other days.
I remain a huge fan of both National Retail and STORE. My holdings of STOR now comprise a very large position, within my personal focus on holding a concentrated portfolio.
That said, in my view the place to put money you wanted to ignore for a decade or two would be NNN. Both STOR and NNN are compelling investments today, even in the era of cap rate compression.
Be the first to comment