

rlesyk/iStock Editorial via Getty Images
The financial numbers in this article are in Canadian dollars unless noted otherwise.
Introduction
No, this market sell-off isn’t fun. Yet, I haven’t been worried for a second for one major reason: I only buy stocks that I trust in any recession. I’ve 95% of my net worth invested in my dividend growth portfolio as most know by now.
Author Portfolio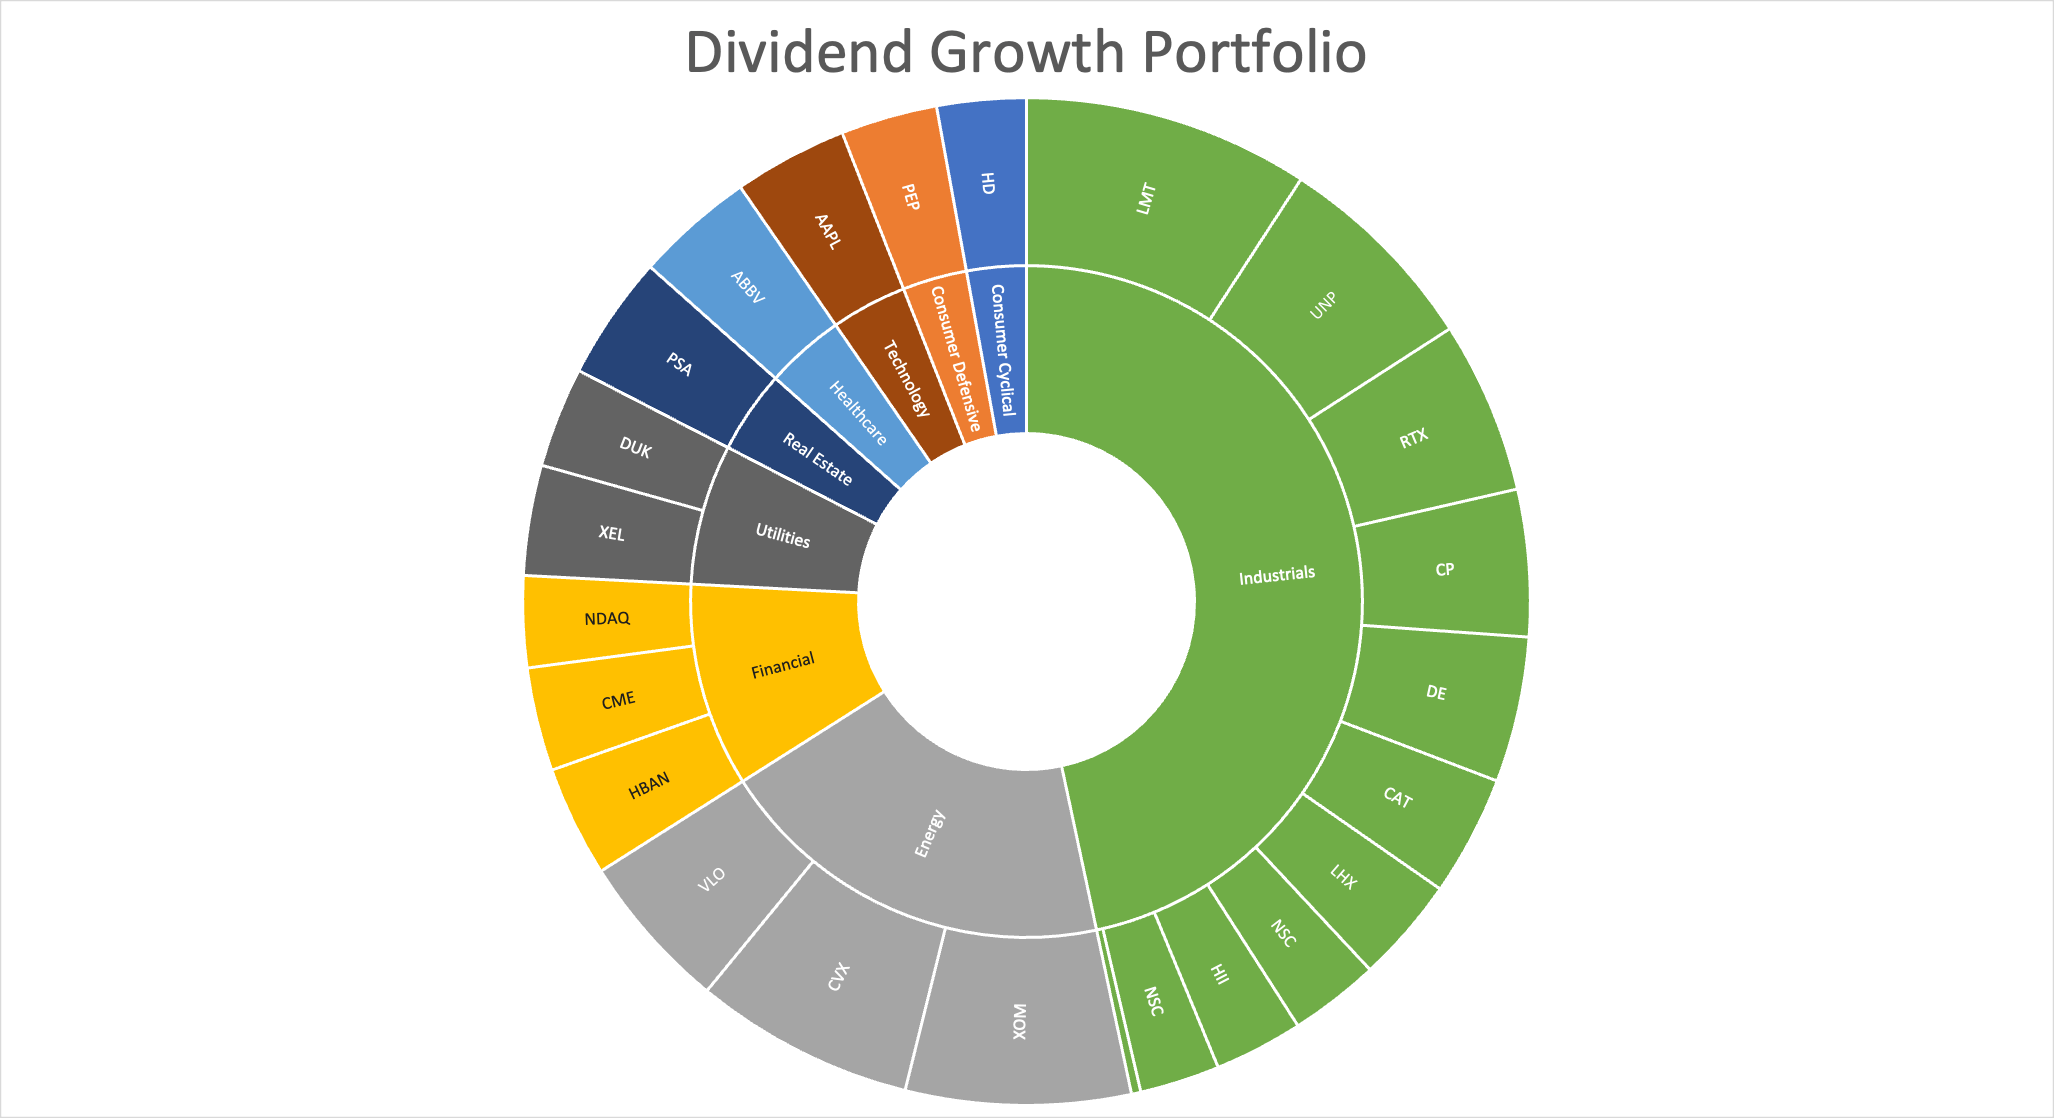
While my portfolio is far from conservative given that I have mostly ignored low volatility (i.e., 20% energy, 50% industrials), I focus on one thing more than anything else: a solid business model that can withstand the test of time as well as various recessions.
In this article, I am going to discuss the only stock-listed Class I railroad in North America that’s not in my portfolio (assuming the Canadian Pacific (CP) buying Kansas City Southern deal will be approved). The Canadian National Railway (NYSE:CNI) is one of the most conservative industrial stocks on the market with a stellar business model, a healthy balance sheet, rising free cash flow, and the opportunity (and pressure) to improve its operating efficiencies. One of the reasons why I never bought CNI is because it was way more conservative when it comes to shareholder distributions than its peers, yet this is exactly what makes the stock more conservative than a lot of (industrial) peers. The long-term performance comes with outperforming total returns and subdued volatility. It’s a huge pro for long-term investors looking for dividend growth exposure.
Now, let’s look at the details!
A Canadian Transportation Staple
The Canadian National Railway is North America’s third-largest stock-listed railway with a market cap of $97.1 billion in Toronto ($76.9 billion in New York). The company covers all major Canadian economic hotspots, as well as lines from Chicago down to the important port in the South in New Orleans, which passes St. Louis, Memphis, and Baton Rouge. This “tri-coastal” network allows the company to efficiently connect a wide range of customers in both Canada and the United States.
Canadian National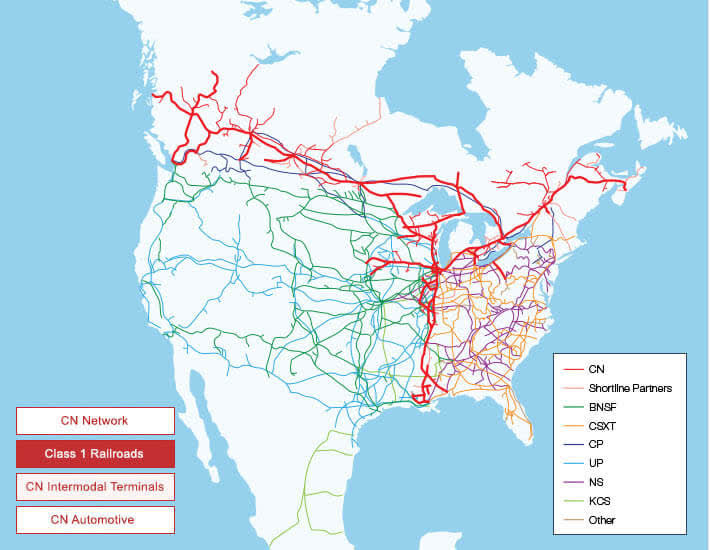
The company’s history goes back to 1919 when the company was incorporated by a special act of the Parliament of Canada with the appointment of its first board of directors Order in Council in 1922.
Now, the company owns more than 19.500 miles of track. Using 2021 numbers, 16% of revenues came from US domestic traffic, 31% transborder traffic, 18% Canadian domestic traffic, and 35% overseas traffic (export demand).
According to the company:
The Company is the originating carrier for over 85%, and the originating and terminating carrier for over 65%, of traffic moving along its network, which allows it both to capitalize on service advantages and build on opportunities to efficiently use assets.
Using 1Q22 data, 28% of total revenue came from intermodal, the company’s biggest segment. Coal revenues accounted for just 5.3% of total sales, which is good news given the long-term downtrend in coal demand.
Underperformance
With that said, Canadian National Railway has underperformed its peers in recent years. The chart below shows the 10-year total return. It’s the only Class I railroad unable to beat the S&P 500 with a 10-year total return of 218%. That performance isn’t bad, but it’s disappointing given that all others returned more than 300%.
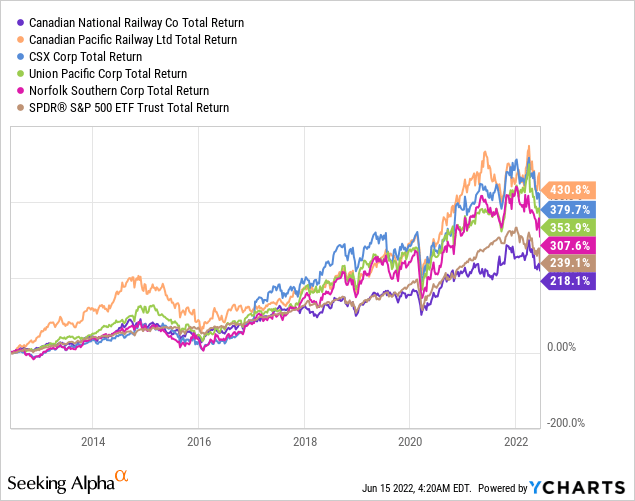
This is both bad and good news. The bad news is that CNI (or Canadian CNR) investors suffered from underperformance. The good news is that the company has room to improve operating efficiencies.
In September of last year, I covered CNI when TCI Fund Management, an activist fund, pressured the company to make changes. It led to the resignation of former CEO Jean-Jacques Ruest.
Back then, I explained why the company was underperforming – which obviously bothered investors like TCI.
Basically, between 2016 and 2020, CN was the only Class I railroad with flat operating profit growth. In 2017, the company had the lowest operating ratio (most efficient operations). In 2Q21, the company had the worst operating ratio. During this period, the OR went from 59.8% to 61.6%. Between 2016 and 2020, the OR rose by more than 600 basis points.
Moreover,
According to TCI, the company has a pricing problem as its revenue per revenue ton-mile has risen just 1.4% since 2016. CP, which is the second-worst performer saw 7.6% growth.
The company also has an expense problem as the OR may have suggested. CNI’s expenses per revenue ton-mile are up 18.4% compared to 2016. CSX Corp. (CSX) is the only railroad that actually lowered its total expenses.
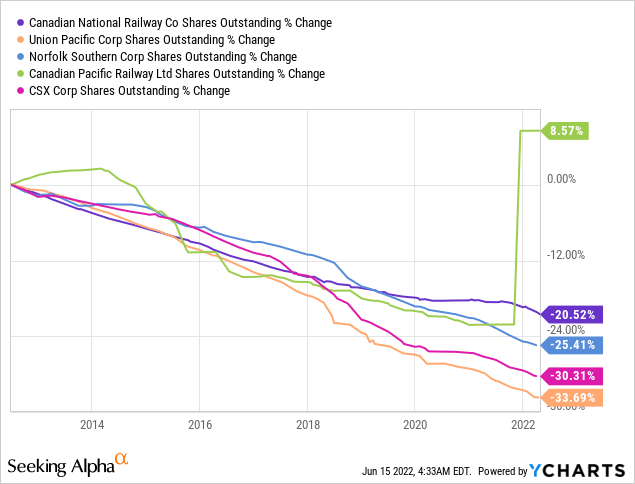
The company was the least-aggressive railroad when it comes to buying back shares. Share repurchases are one of two ways a company can distribute cash to shareholders. Repurchasing shares is an indirect way to let shareholders benefit as it increases the value of the remaining shares. It’s also more tax-friendly as dividends are taxed on multiple levels.
Over the past 10 years, Canadian National repurchased 20% of its shares. That’s not bad (actually quite good), but well below the buyback efforts of its peers in the United States. Canadian Pacific, in this case, is also beating CNI. The surge in CP shares outstanding was caused by the merger with KSU (cash/stock deal).
Low Volatility (Long-Term) Outperformance
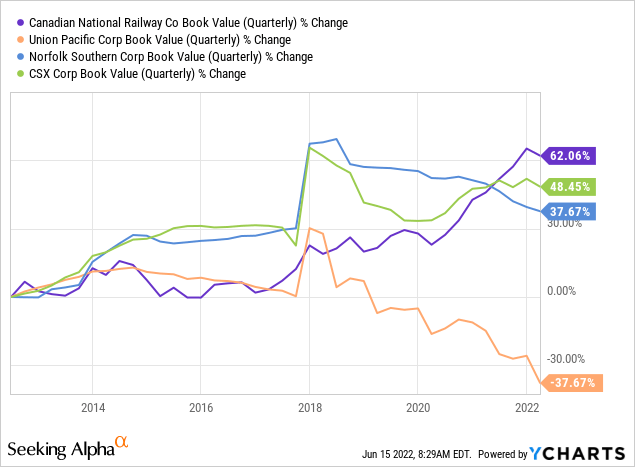
With that in mind, there’s good news. If a company doesn’t spend all of its cash on shareholder distributions, it helps to boost balance sheet health. Over the past 10 years, Union Pacific has seen a decline of roughly 38% in its equity (book value). Canadian National, which is the most financially conservative railroad, saw an increase of 62%.
With that said, let’s discuss a few numbers that show how much potential CNI has. Again, the numbers are in Canadian dollars. Between 2012 and 2024E, EBITDA and free cash flow are growing by 5.8% and 10.2%, respectively, with accelerating growth after the flat(ish) years between 2015 and 2021.
TIKR.com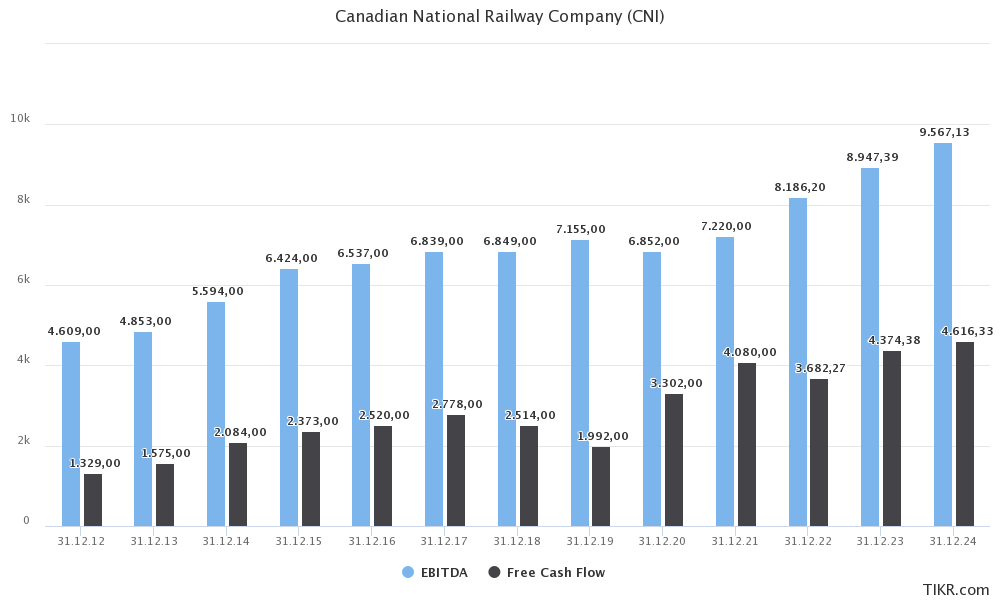
While challenges persist, the company is likely to do close to $4.4 billion in free cash flow next year. This translates to an implied free cash flow yield of 4.5% using the company’s $97.1 billion market cap.
Moreover, the company’s net debt has not made it above 2.0x EBITDA in recent history – not even during the pandemic.
TIKR.com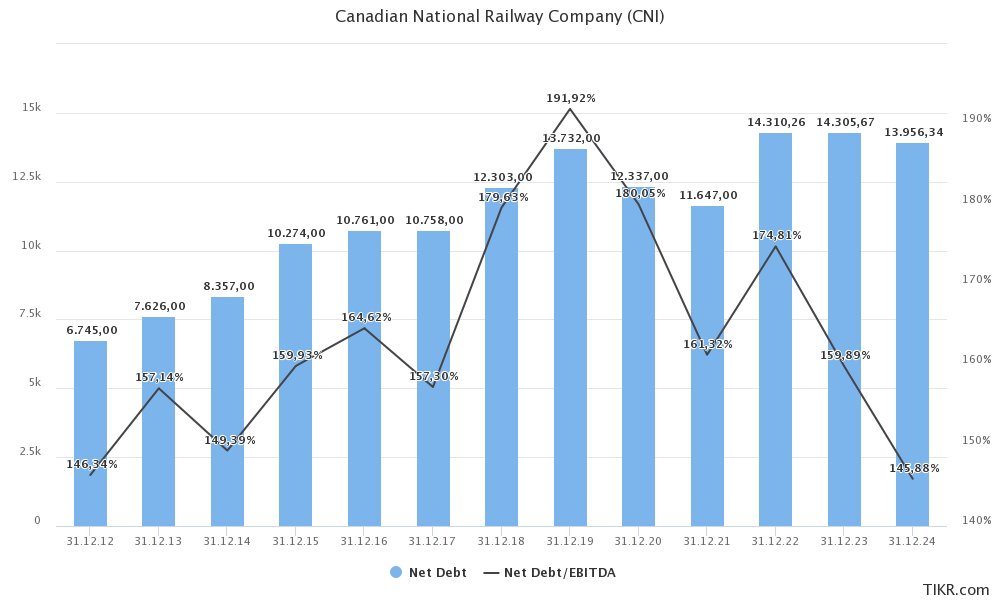
What this means is that it opens up opportunities to hike dividends a bit more aggressively – especially in light of an expected longer-term increase in free cash flow and related.
In the chart below, I added both Canadian-listed and New York-listed dividends. CNI dividends are subject to exchange rate fluctuations, as CNI pays its dividend in Canadian dollars. In other words, if the dividend is hiked by 10% in a given year when the dollar is also up 10% versus “the Loonie”, you end up with an unchanged dollar dividend.
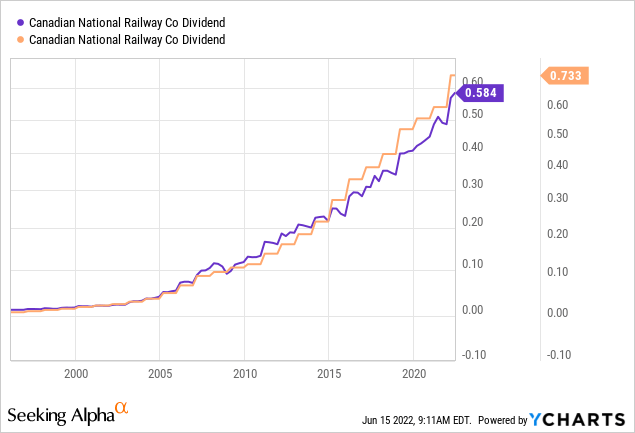
Using Seeking Alpha data for the US-listed stocks, the company has – on average – hiked its dividend by 11.8% per year over the past 10 years. The most recent hike occurred on Jan 25 when management announced a 19% dividend hike. Its current dividend yield is 1.9%.
Moreover, because the company is more conservative than its peers, it has a (relatively) low standard deviation – and long-term outperformance. Since 1985, CNR/CNI have added 16.6/17.1% per year with a standard deviation of 20.7/23.4%. This performance beats the S&P 500, which added 8.9% per year since then. Moreover, because the standard deviation is rather subdued, the Canadian railroad scores a much higher Sharpe ratio than the S&P 500 and its American peer Union Pacific (UNP).
Portfolio Visualizer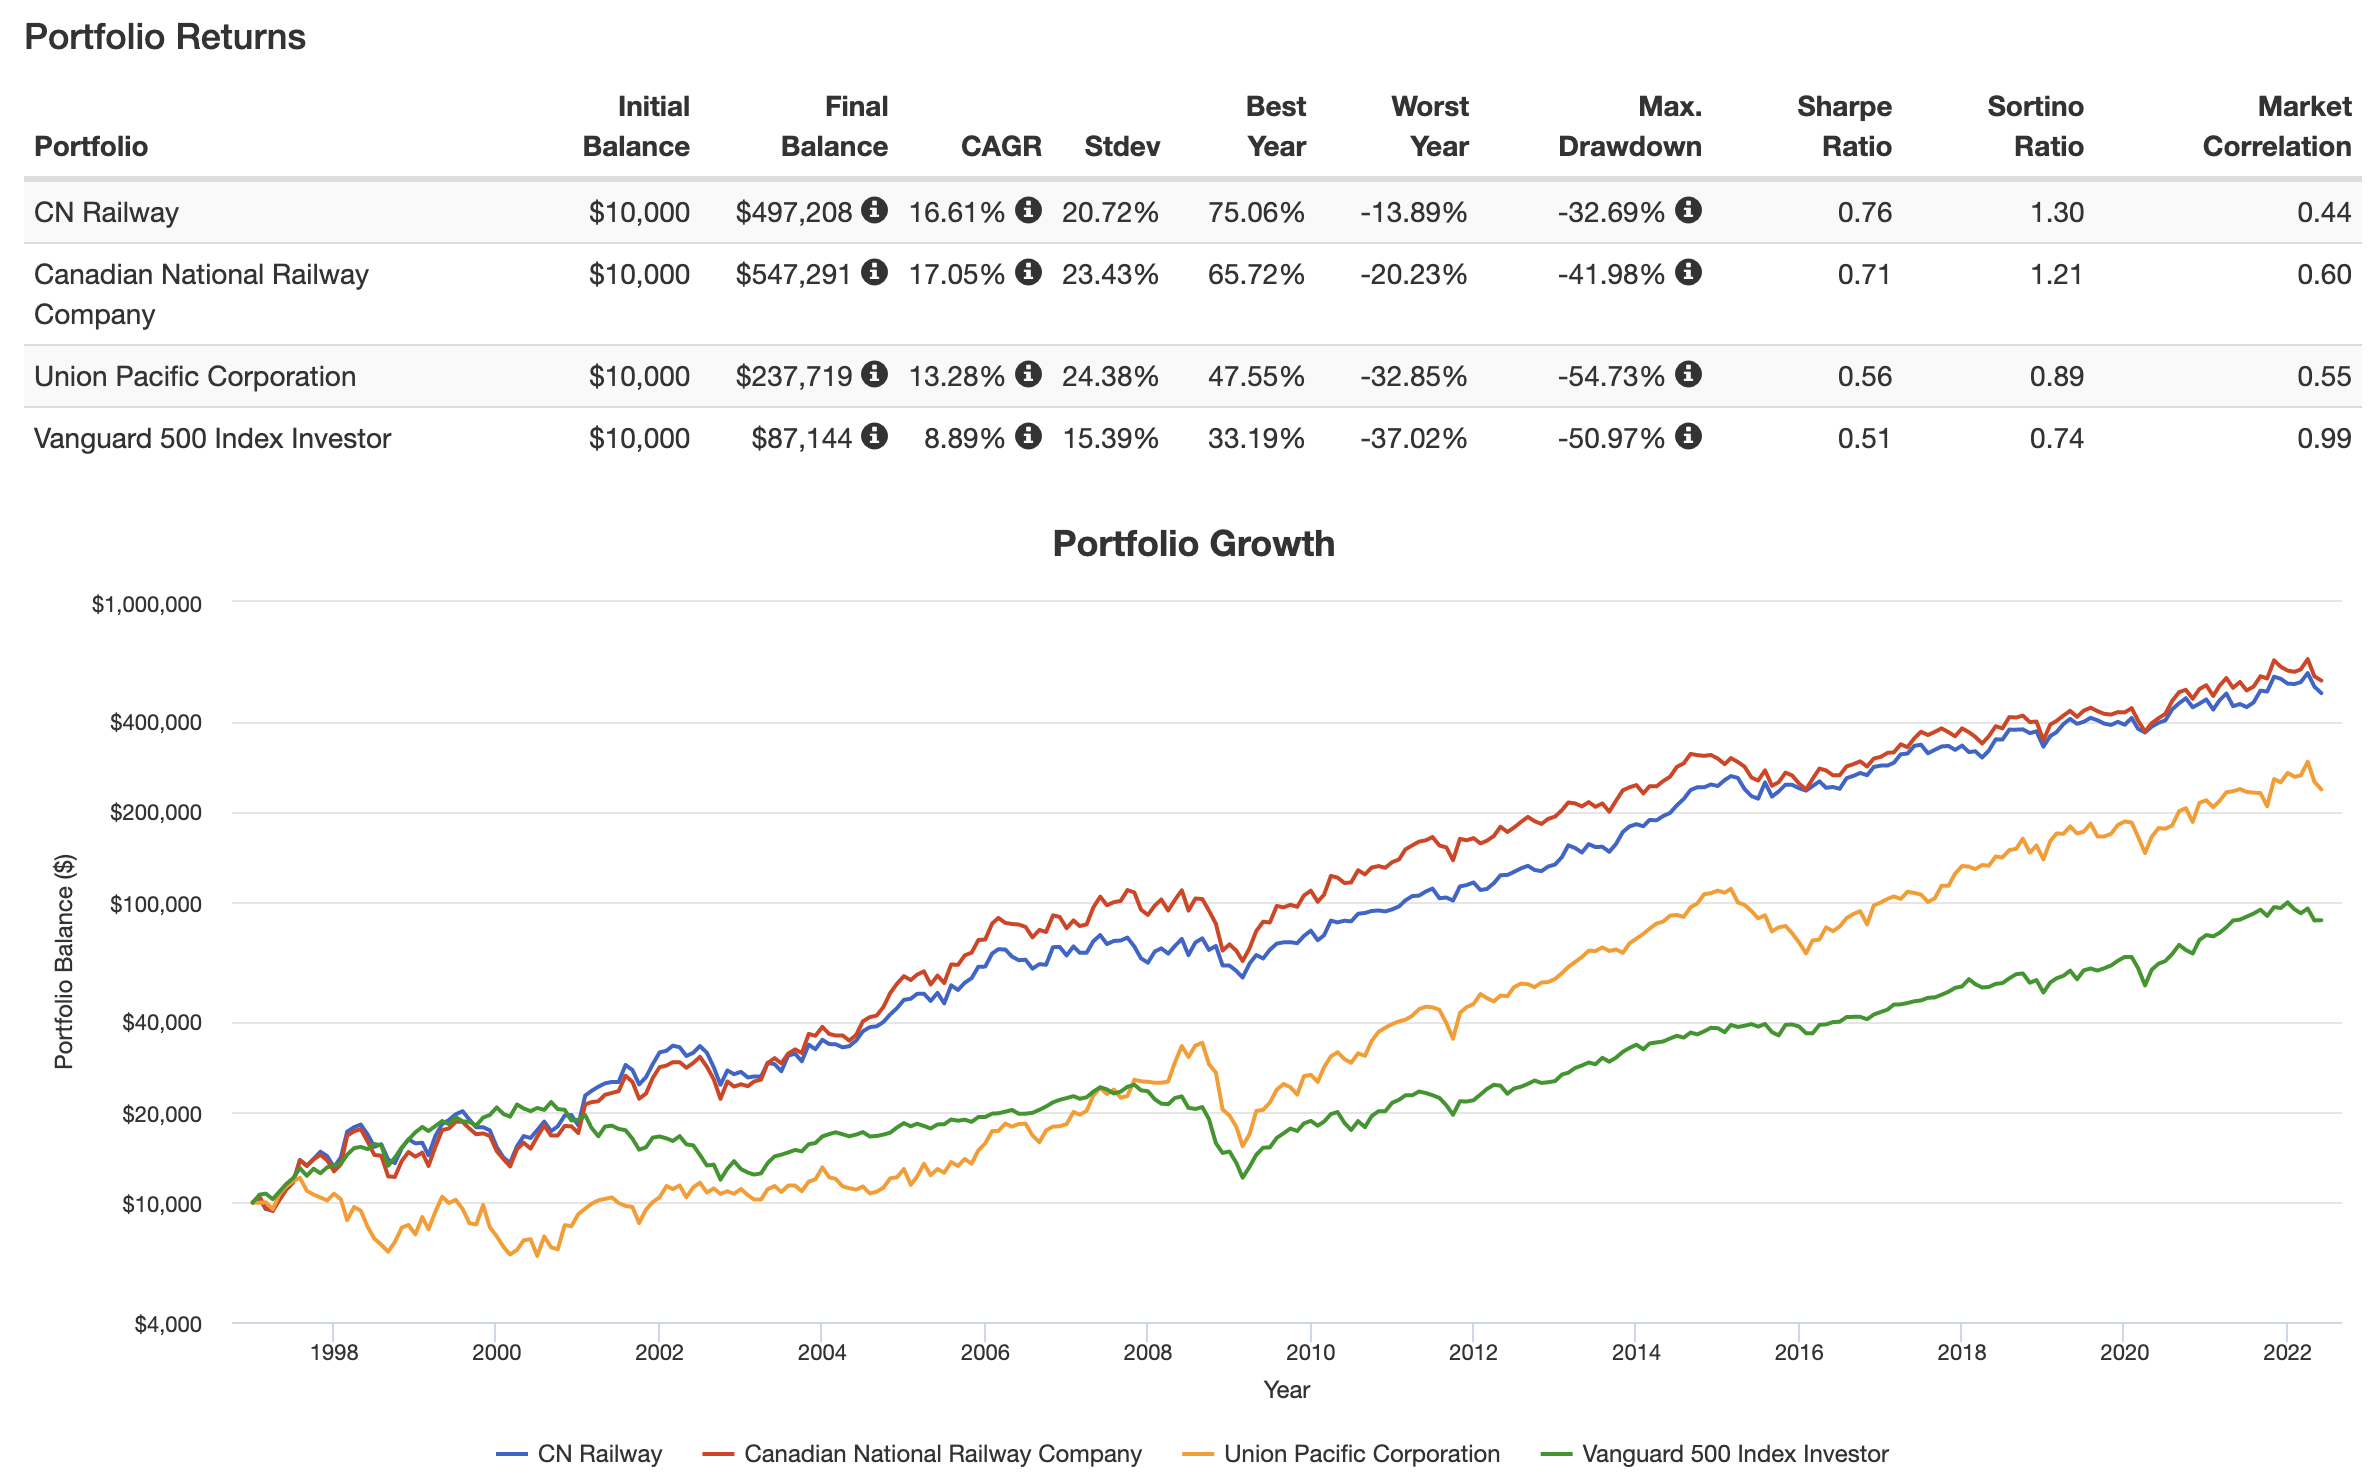
When going back to 2010, we see that the Canadian-listed CNR shares added 15.8% per year with a standard deviation of 16.2%. That’s just 200 basis points above the S&P 500 standard deviation. That’s truly impressive and it leads to a Sharpe ratio of 0.96.
Portfolio Visualizer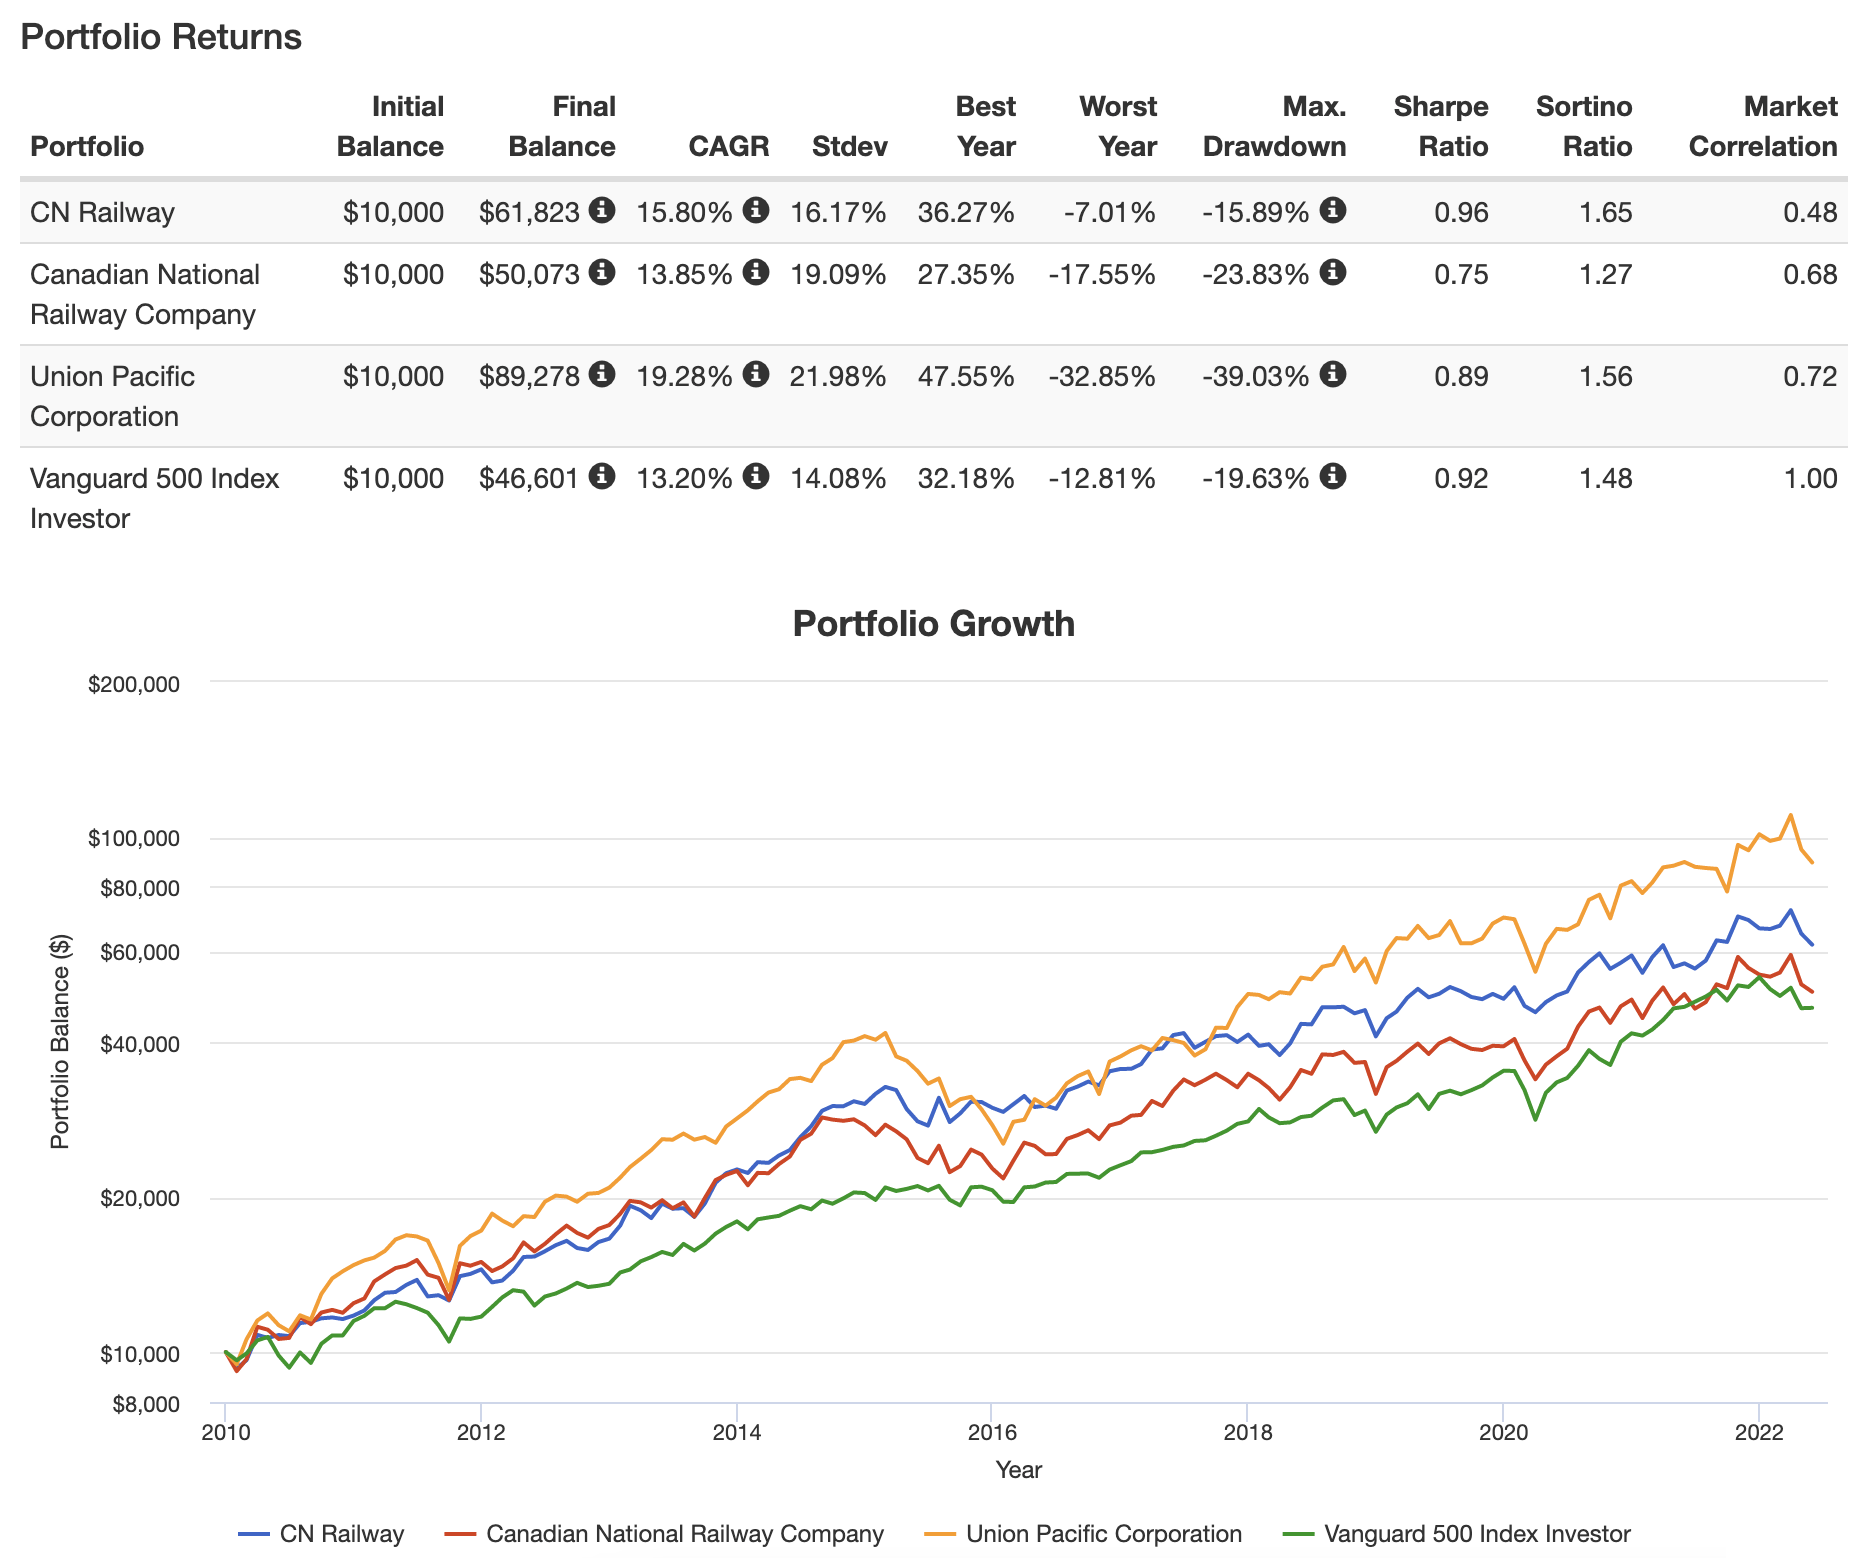
So, what about the price tag?
Valuation
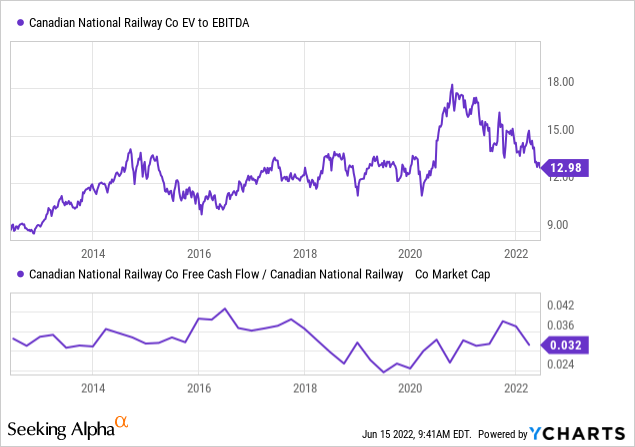
Canadian National has a $97.1 billion market cap, $14.3 billion in expected 2023 net debt, $640 million in pension-related liabilities, and $8.9 billion in expected 2023 EBITDA. This gives us an enterprise value of $112.0 billion. That’s 12.6x expected EBITDA.
This valuation has come a lot and it’s now in line with pre-pandemic valuations. Moreover, the implied 4.1/4.5% future free cash flow yield is at the upper bound of the historic range as the lower part of the graph below shows.
Moreover, Deutsche Bank is turning bullish on rails.
Analyst Amit Mehrotra: “With respect to the upcoming 2Q reporting season, we are most bullish on the set up for Rails. Our updated calibration of Rail volumes points to +7.3% average volume growth yoy in 2H (vs. down 1% in 2Q); even assuming no growth off 2Q levels, 2H volume growth would be +3.9% yoy on average. The combination of higher volume, peaking fuel prices and improving service is positive for prospective profitability, and we see potential for certain Rails to exit 2022 at record profitability levels.”
FINVIZ
Takeaway
Canadian National is the only Class I railroad I don’t own, but it’s far from the worst in the industry. While its performance has lagged due to underperforming operating efficiencies and slower buybacks versus peers, the company is in a great position to boost shareholder returns. CNI is working on operating efficiencies and is likely to boost EBITDA and free cash flow in the years ahead. It has a great business model with key rail assets, a very healthy balance sheet, and a good valuation that allows long-term investors to either initiate a position or add to an existing position.
Even better, CNI is able to outperform the market on a long-term basis with very limited volatility. That’s a gift for every long-term (dividend growth) portfolio.
(Dis)agree? Let me know in the comments!
Be the first to comment