

Olivier Le Moal/iStock via Getty Images
Camtek (NASDAQ:CAMT), a supplier of metrology and inspection equipment and software, is still dealing with a number of challenges, but there are also some positive changes worth noting. The stock seems to have stabilized after an earlier decline. Furthermore, while CAMT reserves the right to make changes to its outlook, it is not seeing any weakening in demand, at least at this point in time. CAMT continues to grow at a solid double-digit clip. However, I think there are a number of reasons why people need to stay cautious. Why will be covered next.
There are positive signals to be found
CAMT has lost 46% YTD. However, the decline has slowed down from where it was earlier in the year. In fact, the stock has not set any new lows in about three months. The low of the year is $23.11, and $22.89 if intraday lows are included, numbers reached on July 6. The chart below shows how the stock has declined in 2022.
Source: finviz.com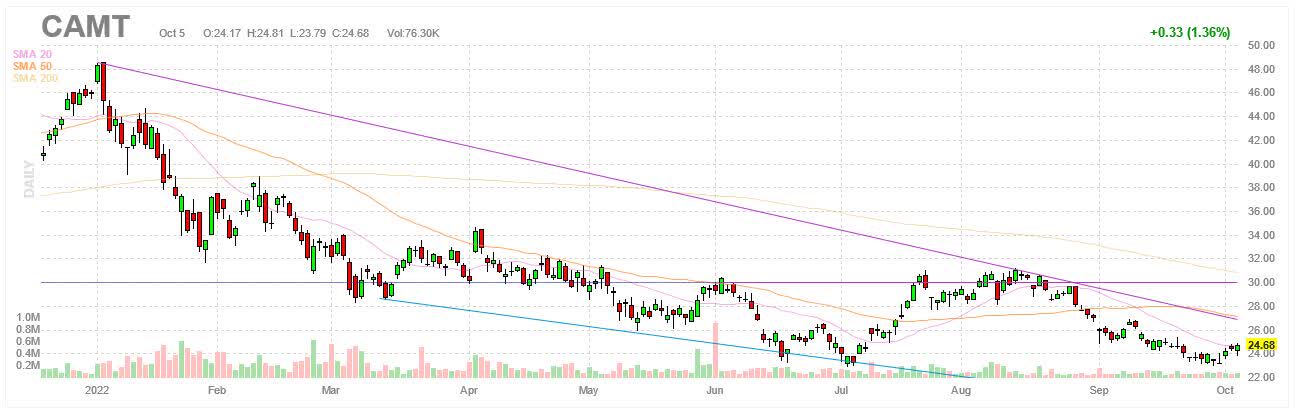
Note that the stock came within pennies of matching the 2022 low on the last day of September, only for the stock to reverse course before it could happen. The stock may have posted a double bottom with last week’s price action, a positive signal suggesting the trend has changed from a bearish one to a more neutral one, if not a bullish one. The low may be in. It’s not difficult to see why some may be tempted to go long at this point.
In addition, the stock may be in the process of forming a horizontal trading channel with the recent sideways action. Resistance would be the trendline connecting the highs in the last three months in the $29-$31 region and support would be the trendline connecting the lows in the $22-$24 region. The existence of a horizontal channel opens up opportunities since it reveals when buyers should enter and when sellers should exit. The stock is a buy when it is close to support and a sell when it approaches resistance, provided of course the channel remains intact.
However, it’s important to note that the stock could still fall to new lows. In that case, the channel would not be there to take advantage of. It’s also worth mentioning that despite the big decline in 2022, CAMT is still way up in the last two years. Keep in mind that the stock came close to gaining almost 600% in the last two years at one point.
If we take the March 2020 low of $7.04 and the November 2021 high of $48.15, then it becomes clearer as to why the stock may have bottomed at $23.17 since it is close to the 61.8% Fibonacci retracement level at $22.74. Furthermore, if we were to include the intraday low of $22.89, then it becomes even clearer as to why the stock bounced where it did.
The 61.8% retracement level is one of the most important retracement levels, if not the most important one. This suggests that the stock has some solid support behind it. The recent price action with the stock bouncing on consecutive occasions off of what appears to be solid support should be encouraging to the bulls. On the other hand, if the stock were to break support and move past the 61.8% retracement level, sentiment towards the stock would likely become a lot more bearish, possibly paving the way for much lower prices.
Valuations have fallen, but maybe not enough
The stock seems to have bounced twice off of an important support level and there have been no new lows in months. This may encourage the bulls, who may be betting that the stock is getting ready for a reversal. However, there are some counterpoints to the bull case, which could discourage some potential buyers. For instance, while multiples have fallen with the stock losing almost half its value YTD, they may still not be low enough to persuade all buyers to take the risk, especially in today’s volatile stock market.
CAMT trades at 15 times forward earnings with a trailing P/E of 17. These multiples are not only below the sector median, but they are also below the 5-year averages of 22 and 38 respectively. On the other hand, the stock is valued at 3.2 times book value, which is higher than the sector median at 2.85. Some people might find these multiples to be acceptable, but some might not. The table below shows the multiples CAMT trades at.
|
CAMT |
|
|
Market cap |
$1.07B |
|
Enterprise value |
$876.37M |
|
Revenue (“ttm”) |
$301.6M |
|
EBITDA |
$83.2M |
|
Trailing P/E |
16.53 |
|
Forward P/E |
15.22 |
|
PEG ratio |
0.35 |
|
P/S |
3.54 |
|
P/B |
3.20 |
|
EV/sales |
2.91 |
|
Trailing EV/EBITDA |
10.53 |
|
Forward EV/EBITDA |
8.92 |
Source: SeekingAlpha
The outlook is uncertain
There is another reason that may give people pause. While CAMT continues to post solid increases in the top and the bottom line, there are concerns the numbers might start to drop as the semiconductor market slows down. Nevertheless, Q2 revenue still increased by 18% YoY to a record $79.6M. GAAP EPS increased by 14% YoY to $0.40 and non-GAAP EPS increased by 21% YoY to $0.46.
Note that the increase in EPS was less than that of net income due to share dilution. The GAAP weighted-average of shares outstanding rose to 48.15M, up from 44.75M a year ago. Margins also declined, but still within the expected range. Cash, cash equivalents and short-term deposits totaled $391M. The table below shows the numbers for Q2 FY2022.
|
(GAAP) |
Q2 FY2022 |
Q1 FY2022 |
Q2 FY2021 |
QoQ |
YoY |
|
Revenue |
$79.578M |
$77.166M |
$67.450M |
3.13% |
17.98% |
|
Gross margin |
50.5% |
51.6% |
51.9% |
(110bps) |
(140bps) |
|
Operating profit |
$20.875M |
$19.526M |
$17.040M |
6.91% |
22.51% |
|
Net income |
$19.183M |
$18.378M |
$15.652M |
4.38% |
22.56% |
|
EPS |
$0.40 |
$0.39 |
$0.35 |
2.56% |
14.29% |
|
(Non-GAAP) |
|||||
|
Revenue |
$79.578M |
$77.166M |
$67.450M |
3.13% |
17.98% |
|
Gross margin |
50.9% |
52.0% |
52.1% |
(110bps) |
(120bps) |
|
Operating profit |
$23.802M |
$22.191M |
$18.510M |
7.26% |
28.59% |
|
Net income |
$22.110M |
$21.043M |
$17.122M |
5.07% |
29.13% |
|
EPS |
$0.46 |
$0.44 |
$0.38 |
4.55% |
21.05% |
Source: CAMT
Guidance calls for Q3 FY2022 revenue of $81-83M, an increase of 16% YoY at the midpoint.
|
Q3 FY2022 (guidance) |
Q3 FY2021 |
YoY (midpoint) |
|
|
Revenue |
$81-83M |
$70.7M |
15.98% |
CAMT is cautious as to the outlook
The quarterly numbers look fine, but management sees potential problems ahead. From the Q2 earnings call:
“We are experiencing a challenging period. On one hand, there are concerns of a slowdown in the semiconductor industry. And on the other hand, we see continued demand for our systems. The macroeconomic environment is not positive, high inflation, rising interest rate, high fuel prices, sharp prices of basic products, all of which lead to a decline in GDP and may lead to a slowdown in the semiconductor industry.”
A transcript of the Q2 FY2022 earnings call can be found here.
CAMT has yet to experience a decline in demand, but it does leave open the possibility there might be one in the near future. CAMT is therefore taking precautions accordingly.
“we do not see any signs of declining demand for our systems. Moreover, we believe that our markets will continue to grow in the long term, even though there may be a few bumps along the way. However, regarding a possible slowdown in our industry, we are managing our headcount and balance sheet items.”
Process nodes are becoming more complex, which in turn increases the demand for metrology and process tools to keep yields up. CAMT is counting on this to provide it with some level of resilience, even if the market for semiconductors slows down or even contracts as some expect, which would reduce the need for the equipment used to manufacture semiconductors.
With that said, the market for semiconductor manufacturing equipment is widely expected to slow down. For instance, a recent forecast from SEMI predicts sales of semiconductor manufacturing equipment will still grow at a robust 14.7% YoY to $117.5B in 2022, up from $102.5B in 2021. However, growth is expected to slow down to just 2.8% YoY to $120.8B in 2023. This is almost certainly to discourage some buyers from getting in on a stock like CAMT that is perceived to depend on an expanding market.
Investor takeaways
There are some arguments in favor of long CAMT, but there are also some arguments against it. CAMT is still growing at a double-digit pace and there are still no signs of a weakening in demand, but there are concerns the numbers will inevitably deteriorate once the current slowdown in the market for semiconductors trickles down to suppliers of equipment needed to make semiconductors, metrology and process tools included.
Similarly, while current valuations don’t seem unreasonable for a company growing at a double-digit pace, they could be if the quarterly numbers decline drastically if the semiconductor market experiences a major decline and there is a weakening in demand. For instance, CAMT is projected to earn $1.80-$1.83 in FY2022 after earning $1.59 in FY2021. In comparison, CAMT earned a combined $1.26 in the two preceding years. If quarterly earnings drop and begin to resemble the latter or worse, CAMT starts to look a lot more expensive than it does now.
I am neutral on CAMT as stated before in a previous article. While the charts suggest the stock has found solid support and the trend is no longer leaning bearish, they also suggest the stock is likely heading sideways for a while. In other words, the stock is unlikely to gain much in this environment. CAMT has some tailwinds going for it, but they’re offset by an equal number of headwinds, resulting in a stalemate. If the stock is to rally, it is likely to have trouble keeping it up due to this. Sideways action is very likely to continue.
Bottom line, if the charts form a horizontal channel, short-term trades may be warranted. As is, betting on either direction is fraught with risk. There is a reason why even management is hedging its bets with a cautious outlook. CAMT itself is probably not sure where things are heading. To pretend one does by making directional trades is probably not a wise move.
Be the first to comment