

Australian Dollar Talking Points
AUD/USD appears to be stuck in a narrow range as it gives back the advance following the update to the US Consumer Price Index (CPI), and the exchange rate may continue to consolidate ahead Kansas City Fed Economic Symposium scheduled for August 26 – 28 amid the failed attempt to test the July low (0.7289).
AUD/USD Rate Defends August Range Amid Failure to Teste July Low
AUD/USD is little changed from the start of the week as a growing number of Federal Reserve officials show a greater willingness to switch gears, and the diverging paths between the Federal Open Market Committee (FOMC) and Reserve Bank of Australia (RBA) may continue to drag on the exchange rate as Governor Philip Lowe and Co. appear to be on a preset course.
Looming data prints coming out of Australia may keep the RBA on the sidelines as employment is expected to contract 45K in July, and the central bank may stick to a wait-and-see approach throughout the second half of the year amid the renewed lockdowns across the entire country.
As a result, the RBA may stick to the same script at its next interest rate decision on September 7 as the central bank plans to pursue its government bond-buying program “at the rate of $5 billion a week until early September and then $4 billion a week until at least mid November,” but the crowding behavior amongst retail traders looks poised to persist as AUD/USD sits below the 200-Day SMA (0.7605) for the first time in over a year.
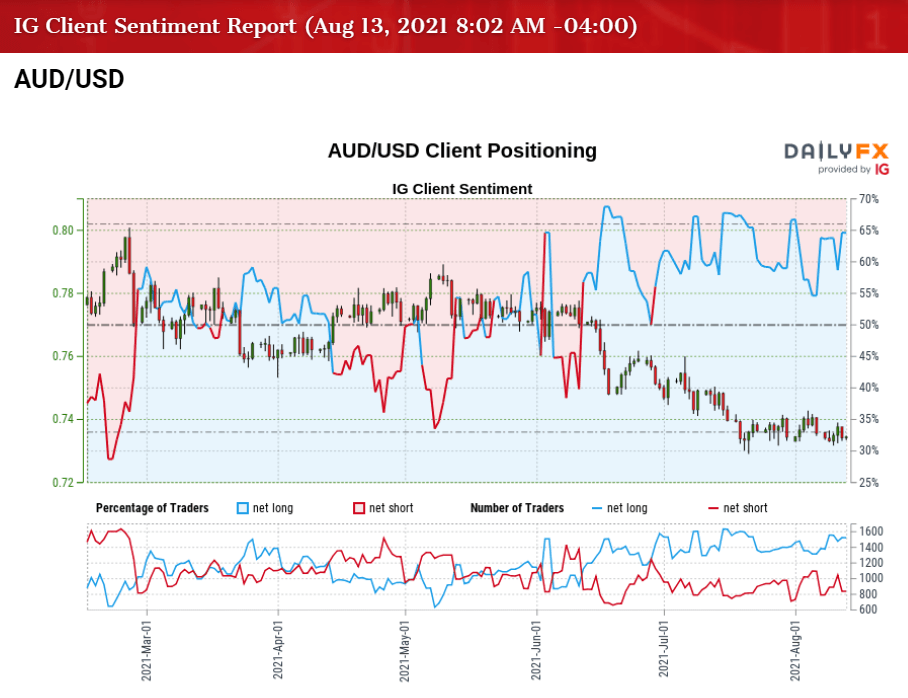
The IG Client Sentiment report shows 64.08% of traders are currently net-long AUD/USD, with the ratio of traders long to short standing at 1.78 to 1.
The number of traders net-long is 7.20% higher than yesterday and 15.69% higher from last week, while the number of traders net-short is 10.88% lower than yesterday and 15.75% lower from last week. The rise in net-long interest has fueled the tilt in retail sentiment as 55.99% of traders were net-long AUD/USD last week, while the decline in net-short position could be a function of profit-taking behavior as the exchange rate gives back the advance from earlier this week.
With that said, the decline from the February high (0.8007) may turn out to be a change in the broader trend asAUD/USD sits below the 200-Day SMA (0.7605) for the first time in over a year, but the exchange rate appears to be stuck in a narrow range following the failed attempt to test the July low (0.7289).
AUD/USD Rate Daily Chart
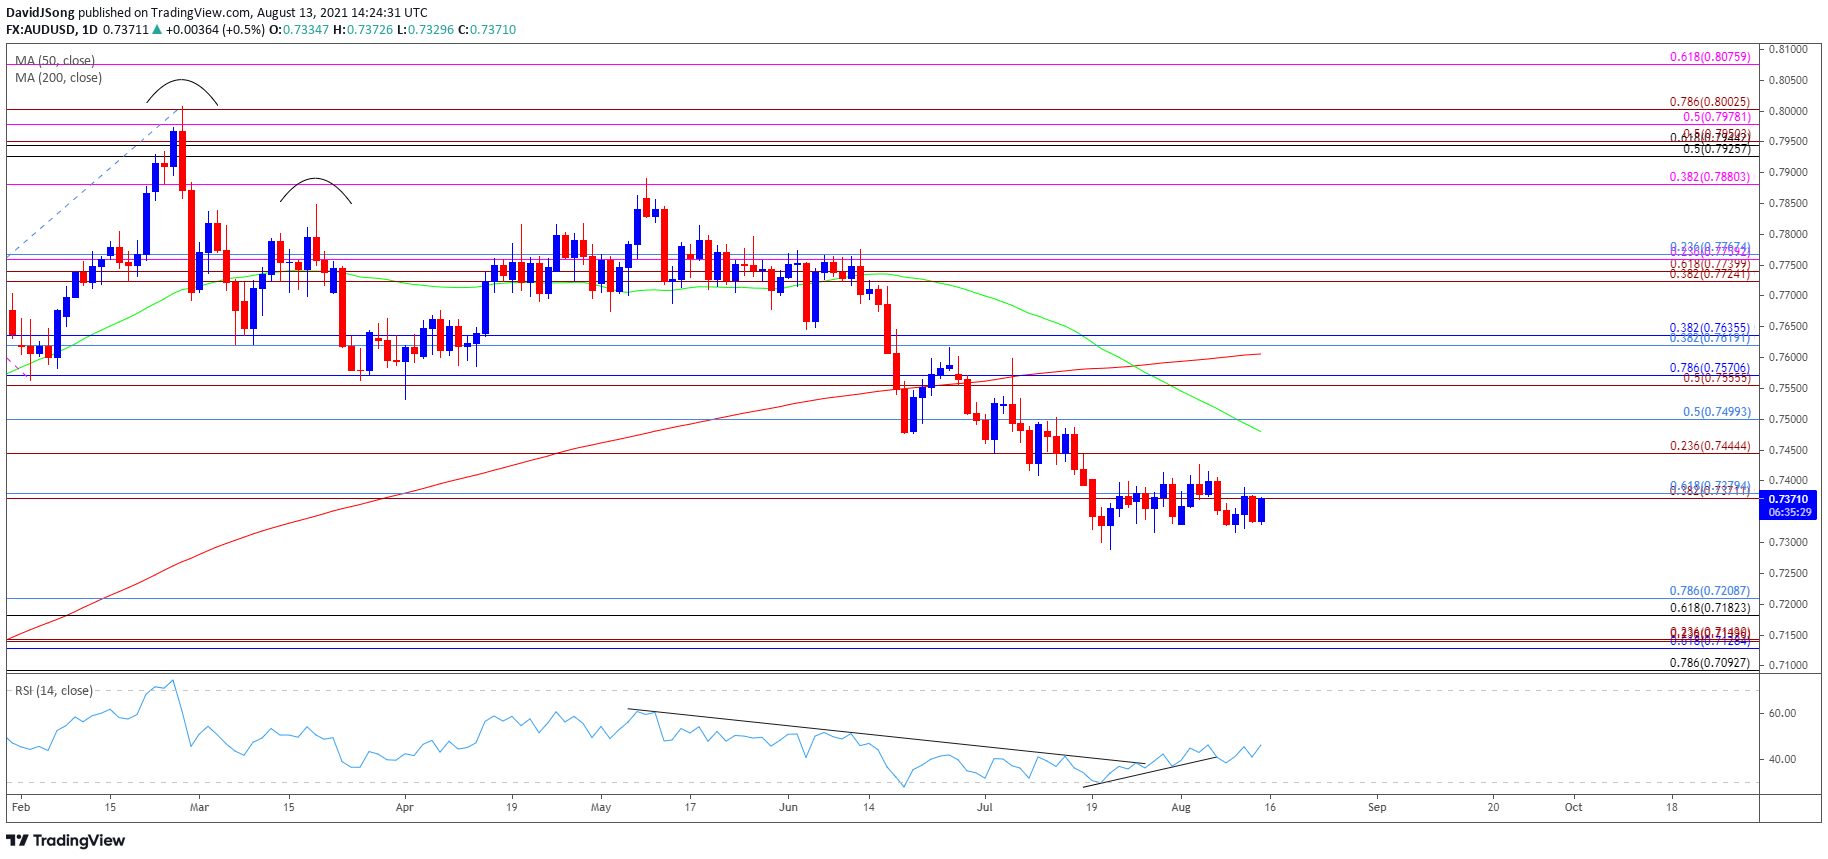
Source: Trading View
- Keep in mind, a head-and-shoulders formation took shape earlier this year as AUD/USD traded to a fresh 2021 low (0.7532) in April, but the exchange rate negated the key reversal pattern following the failed attempts to close below the neckline around 0.7560 (50% expansion) to 0.7570 (78.6% retracement).
- However, there appears to be a shift in the broader trend as AUD/USD sits below the 200-Day SMA (0.7605) for the first time in over a year, with the decline in the exchange rate pushing the Relative Strength Index (RSI) into oversold territory for the first time since March 2020.
- Nevertheless, AUD/USD appears to be stuck in a narrow range following the failed attempt to test the July low (0.7289), with a move back above the 0.7370 (38.2% expansion) to 0.7380 (61.8% retracement) region bringing the Fibonacci overlap around 0.7440 (23.6% expansion) to 0.7500 (50% retracement) on the radar, which largely lines up with the 50-Day SMA (0.7479).
- Need a break/close above the Fibonacci overlap around 0.7440 (23.6% expansion) to 0.7500 (50% retracement) to open up the 0.7560 (50% expansion) to 0.7570 (78.6% retracement) area, with a move above the 200-Day SMA (0.7605) opening up the 0.7620 (38.2% retracement) to 0.7640 (38.2% retracement) region.
— Written by David Song, Currency Strategist
Follow me on Twitter at @DavidJSong
Be the first to comment