

CreativaImages
Introduction
I last covered Campbell Soup (NYSE:CPB) all the way back in 2018, when I just started writing about stock investing full-time. In that article, published on May 31st, 2018, I was waiting for an additional -30% decline in the stock price before I would have been willing to buy. Around that time, Dan Loeb’s hedge fund Third Point took an activist position in the company and the stock price bottomed. COVID lockdowns soon followed and more people were buying groceries than normal, pushing up both Campbell’s earnings and stock price, never giving me a chance to buy at the price I wanted. Now, the pandemic is effectively over, things are normalizing, and it makes sense to revisit the stock.
I didn’t develop and start implementing my current method for analyzing steady-earning stocks like Campbell until early 2019, so this article will be the first time I’ve covered Campbell using my standard “Full-Cycle Earnings” analysis.
My Valuation Method For Campbell Soup
The valuation method I use for Campbell first checks to see how cyclical earnings have been historically. Once it is determined that earnings aren’t too cyclical, then I use a combination of earnings, earnings growth, and P/E mean reversion to estimate future returns based on previous earnings growth and sentiment patterns. I take those expectations and apply them 10 years into the future, and then convert the results into an expected CAGR percentage. If the expected return is really good, I will buy the stock, and if it’s really low, I will often sell the stock. In this article, I will take readers through each step of this process.
Importantly, once it is established that a business has a long history of relatively stable and predictable earnings growth, it doesn’t really matter to me what the business does. If it consistently makes more money over the course of each economic cycle, that’s what I care about the most.
FAST Graphs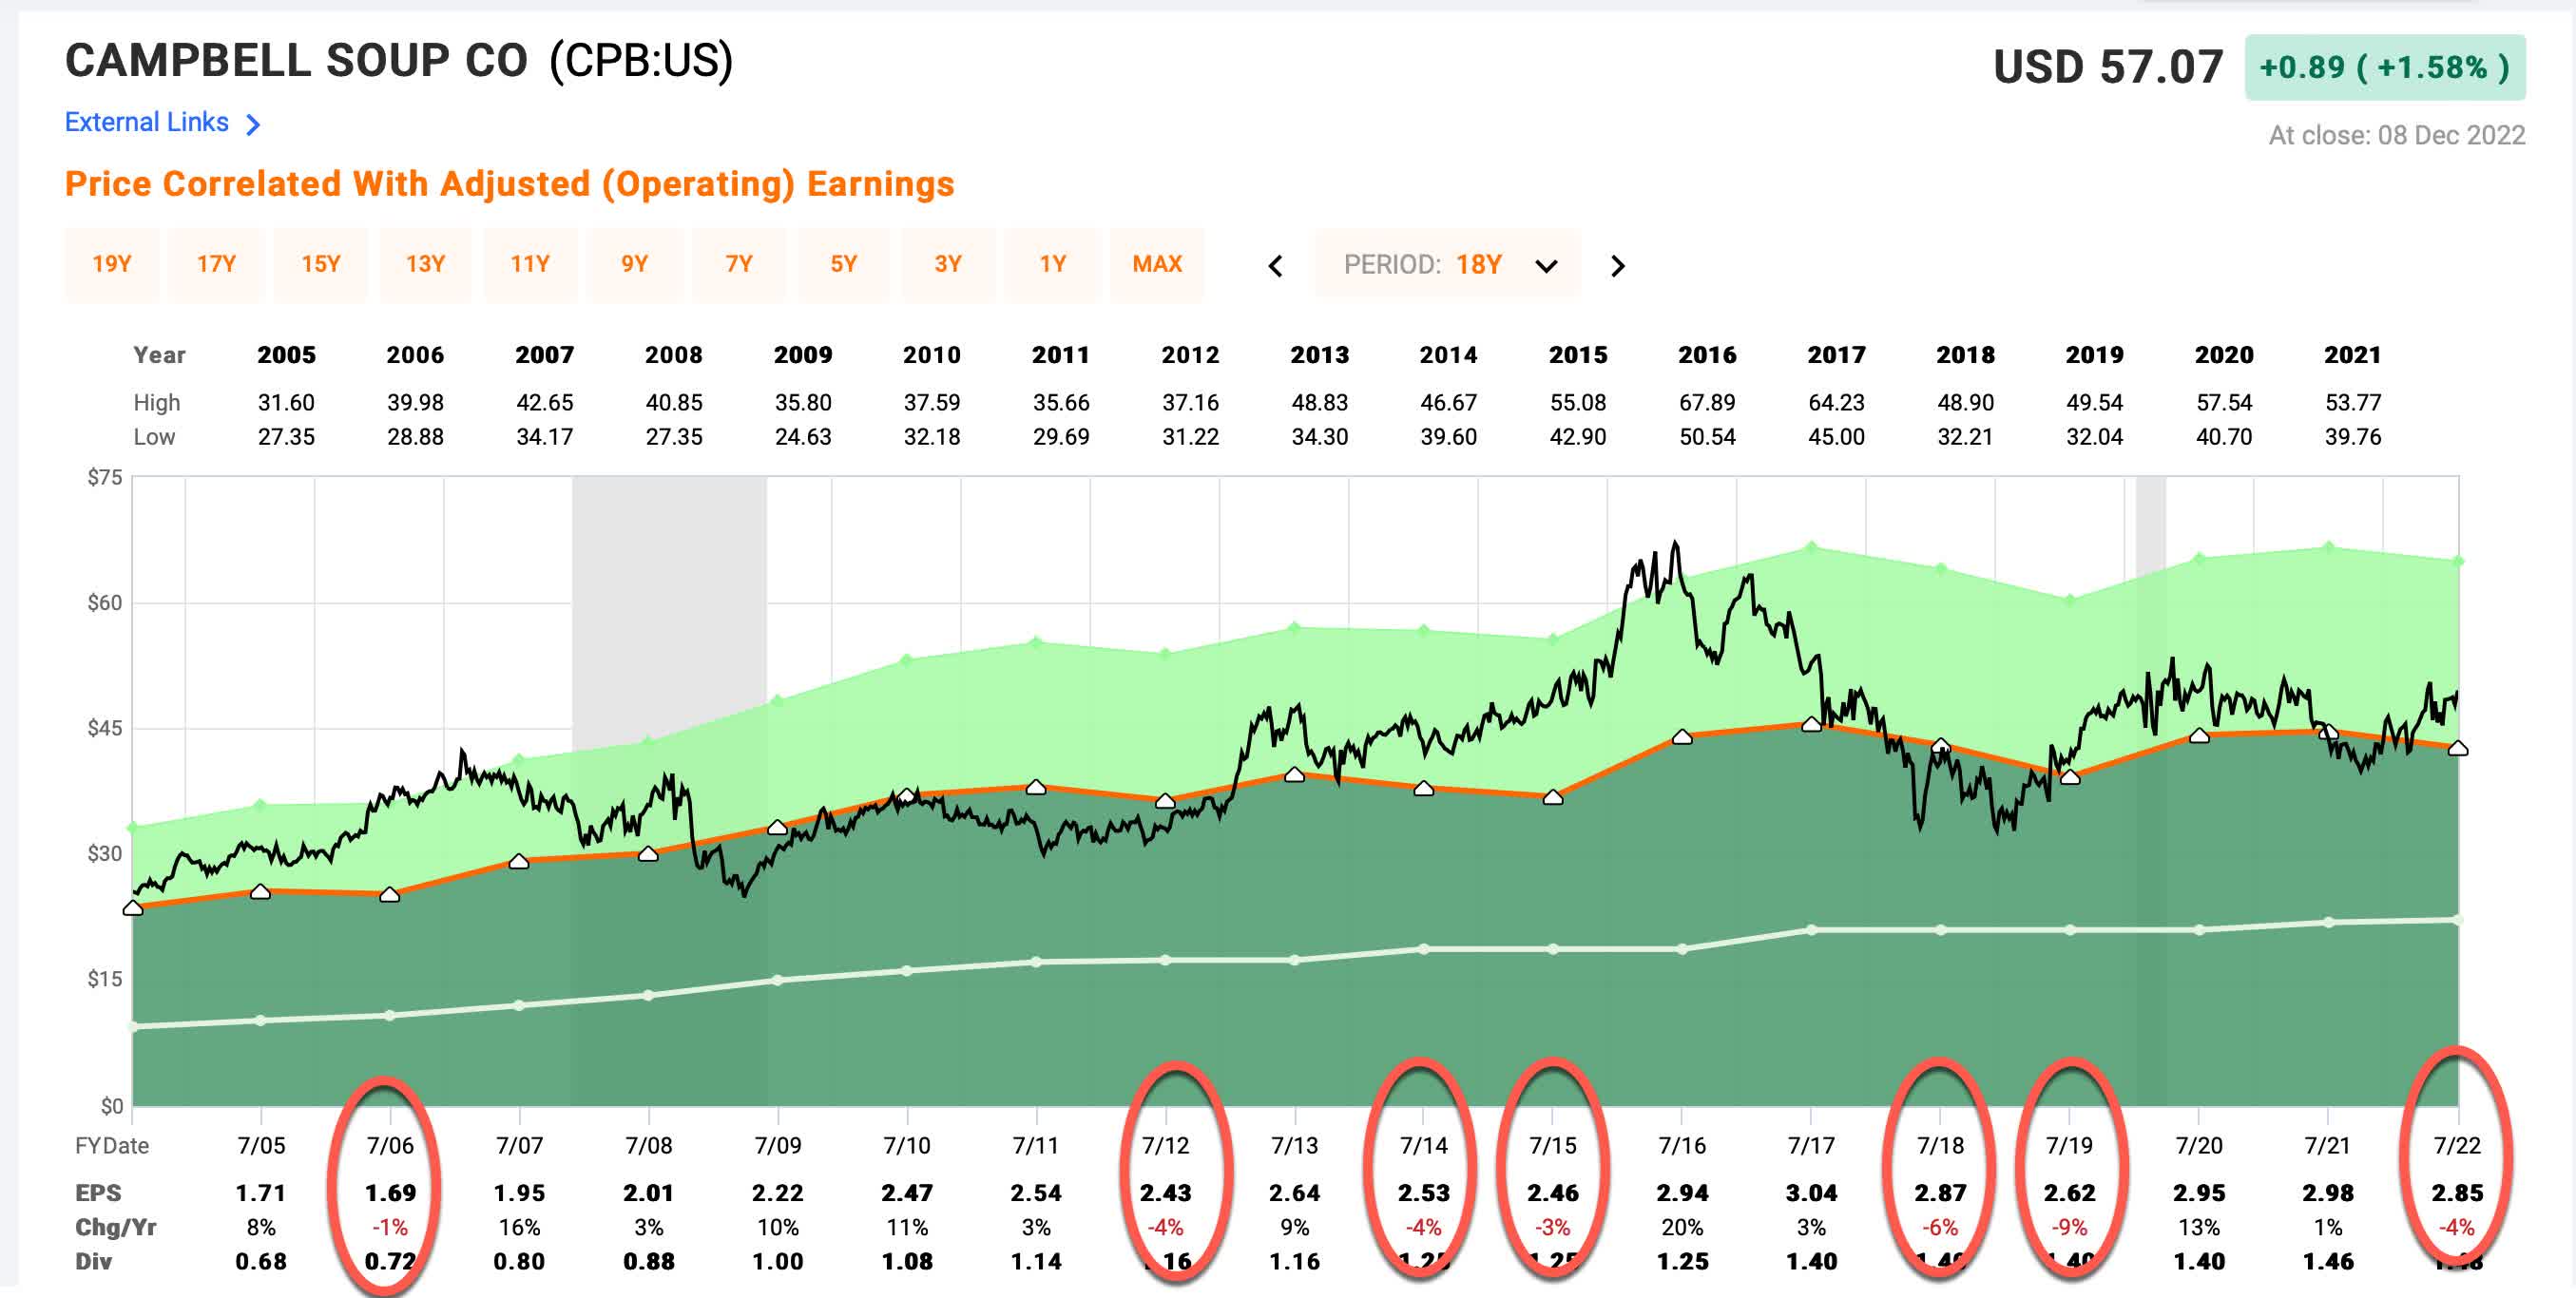
Since 2005 Campbell Soup has experienced 7 years where EPS declined from the previous year. This is a very high number of years for an S&P 500 stock. However, all the declines are less than -10% per year, so they are also extremely shallow. Additionally, while the stock price tends to decline in recessions, the earnings have grown during the past two recessions, which at least makes the business counter-cyclical to some degree, even if the stock hasn’t necessarily been.
In the end, Campbell’s low earnings cyclicality means that it’s pretty easy to use an earnings and earnings growth based valuation technique to value the stock, which is what I will do in this article.
Campbell’s Market Sentiment Return Expectations
In order to estimate what sort of returns we might expect over the next 10 years, let’s begin by examining what return we could expect 10 years from now if the P/E multiple were to revert to its mean from the previous economic cycle. For this, I’m using a period that runs from 2014-2023.
FAST Graphs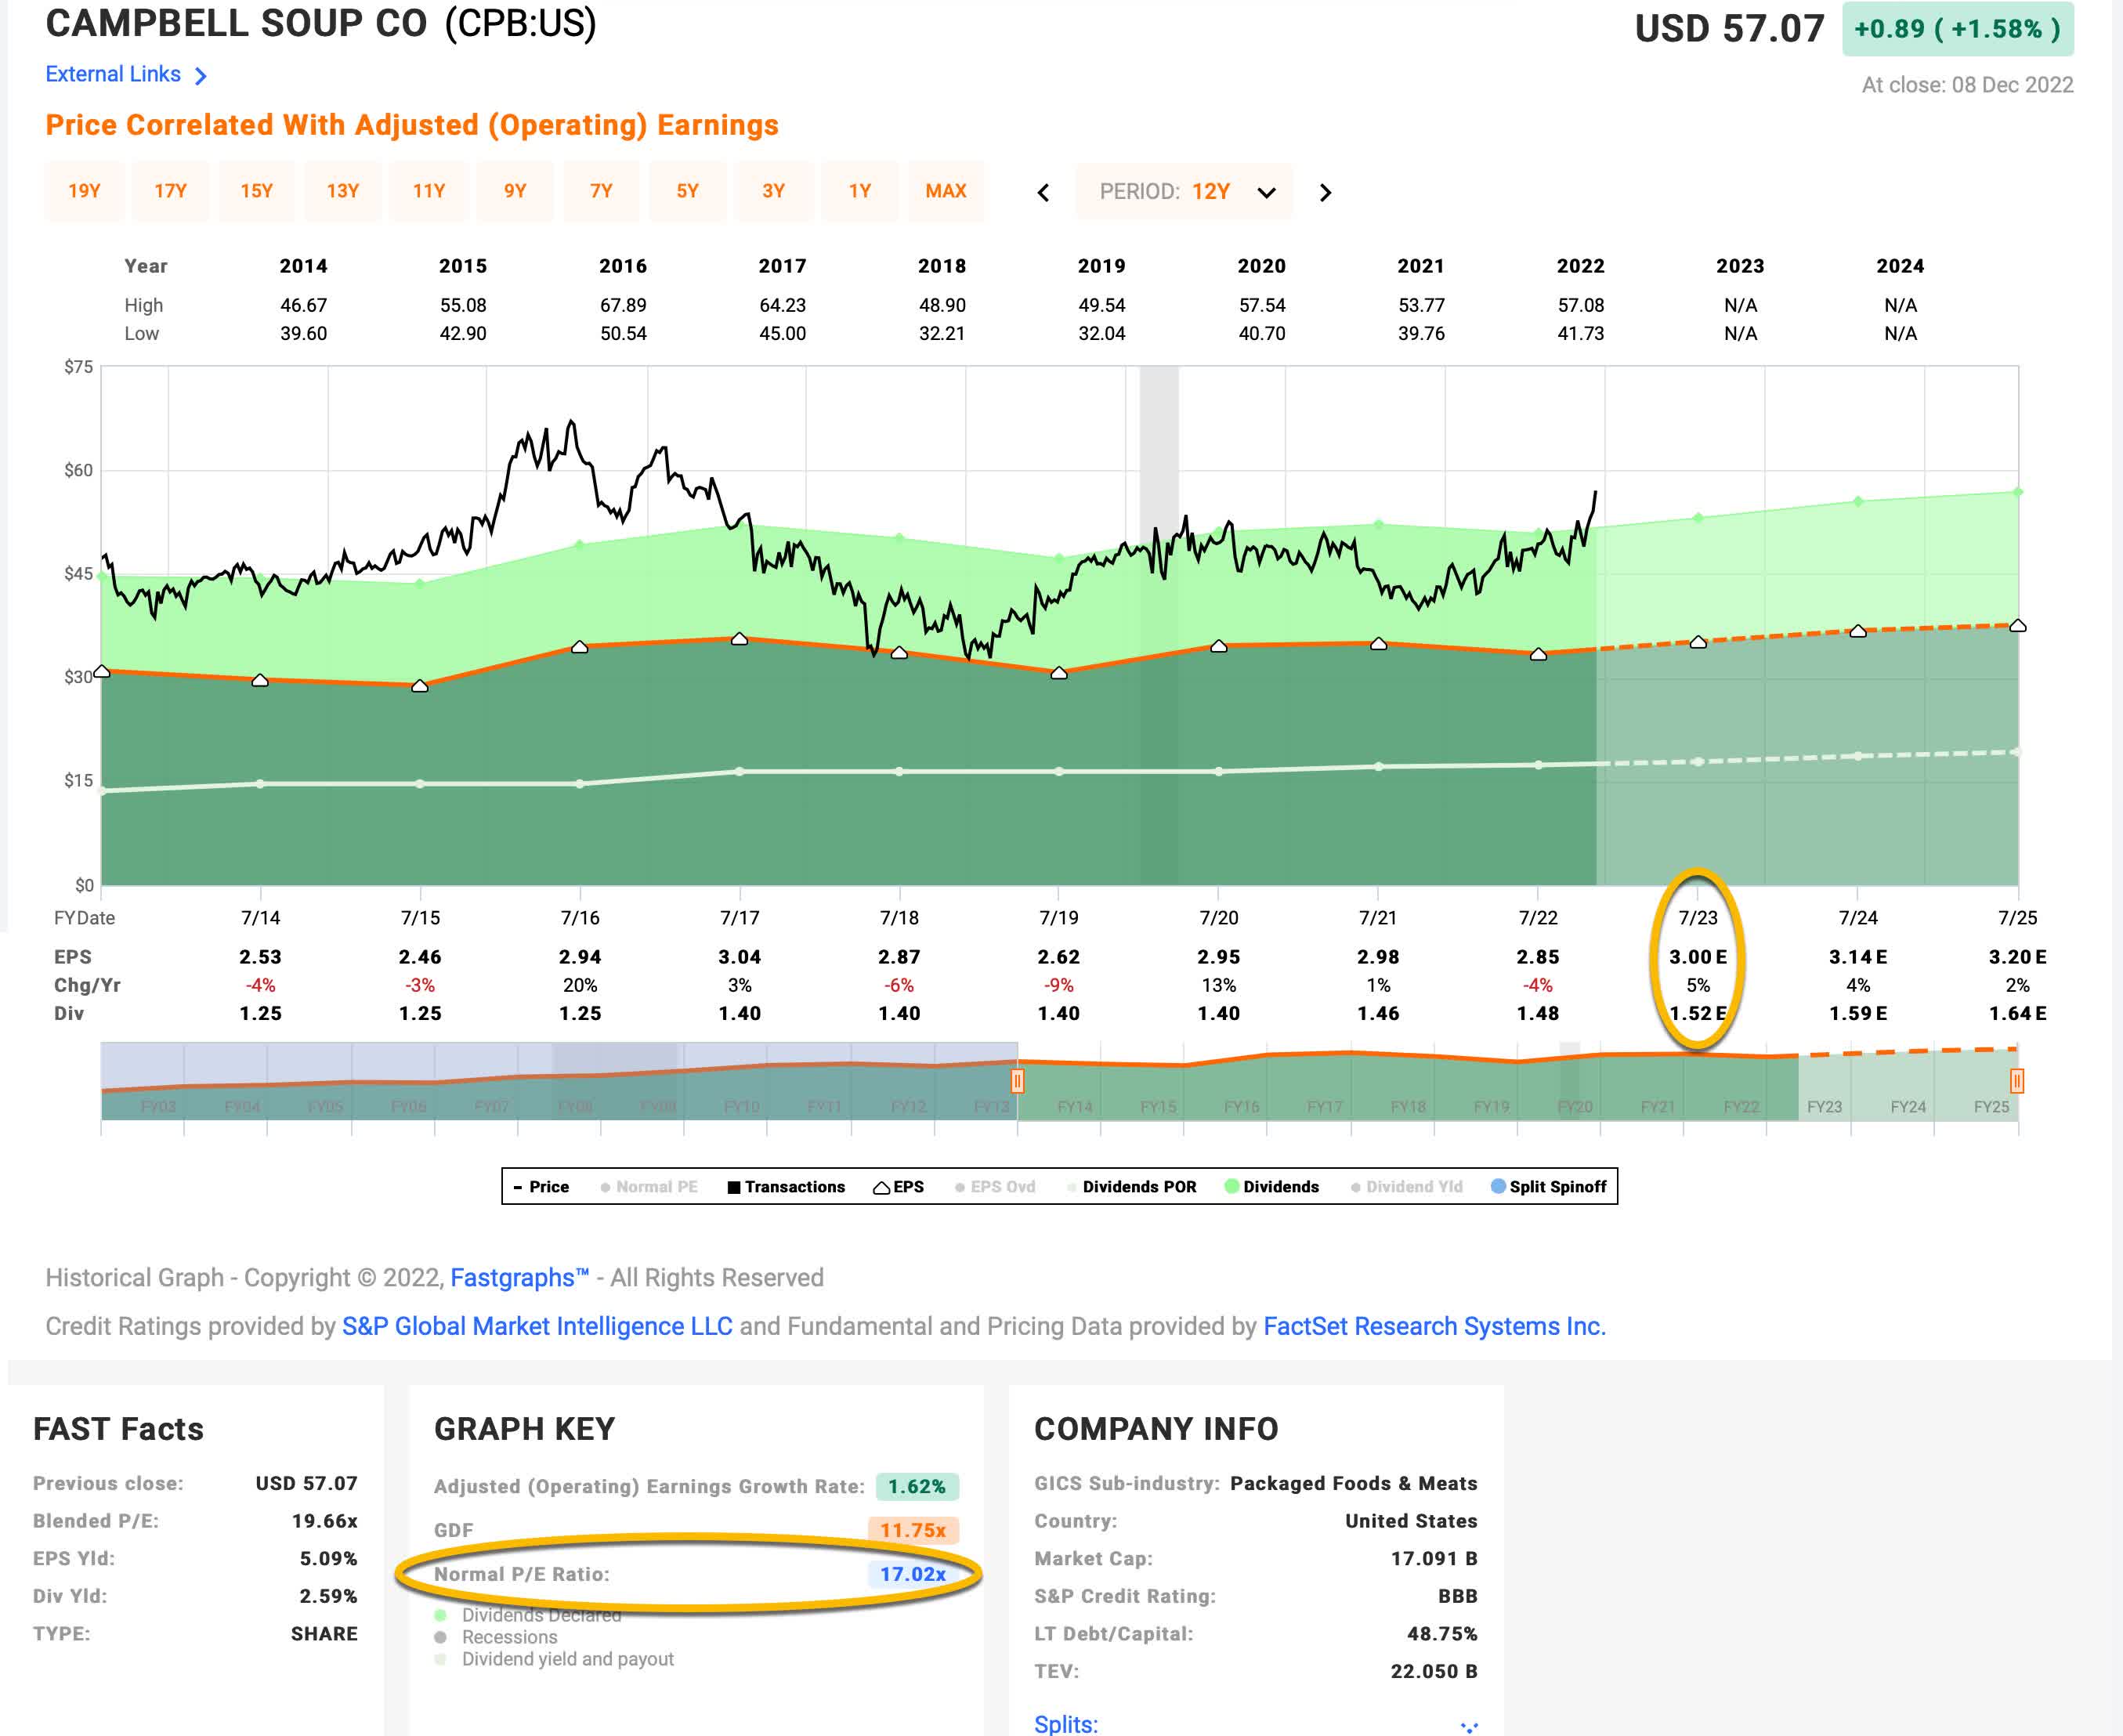
Campbell’s average P/E from 2014 to the present has been about 17.02 (the blue number circled in gold near the bottom of the FAST Graph). Using 2023’s forward earnings estimates of $3.00, Campbell has a current P/E of 18.76. If that 18.76 P/E were to revert to the average P/E of 17.02 over the course of the next 10 years and everything else was held the same, Campbell’s price would fall and it would produce a 10-Year CAGR of -0.97%. That’s the annual return we can expect from sentiment mean reversion if it takes 10 years to revert. If it takes less time to revert, the annual return would be lower.
Business Earnings Expectations
We previously examined what would happen if market sentiment reverted to the mean. This is entirely determined by the mood of the market and is quite often disconnected, or only loosely connected, to the performance of the actual business. In this section, we will examine the actual earnings of the business. The goal here is simple: We want to know how much money we would earn (expressed in the form of a CAGR %) over the course of 10 years if we bought the business at today’s prices and kept all of the earnings for ourselves.
There are two main components of this: the first is the earnings yield and the second is the rate at which the earnings can be expected to grow. Let’s start with the earnings yield (which is an inverted P/E ratio, so the Earnings/Price ratio). The current earnings yield is about +5.33%. The way I like to think about this is, if I bought the company’s whole business right now for $100, I would earn $5.33 per year on my investment if earnings remained the same for the next 10 years.
The next step is to estimate the company’s earnings growth during this time period. I do that by figuring out at what rate earnings grew during the last cycle and applying that rate to the next 10 years. This involves calculating the historical EPS growth rate, taking into account each year’s EPS growth or decline, and then backing out any share buybacks that occurred over that time period (because reducing shares will increase the EPS due to fewer shares).
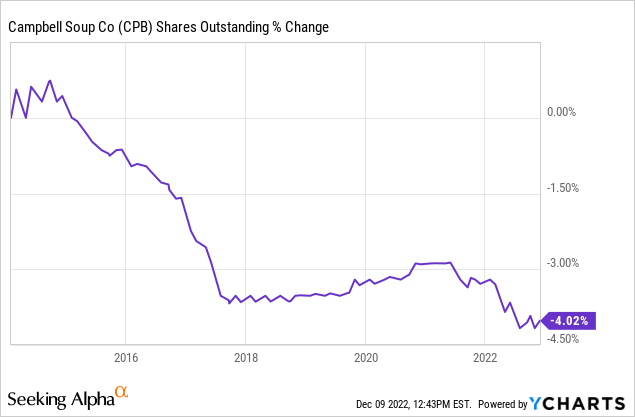
Campbell has only bought back about 4% of the shares outstanding since 2014, so there isn’t much to adjust for here, but I will also adjust for all those small earnings decline years I pointed out earlier. When I make those adjustments, I get an earnings growth rate for CPB of just +1.05% since 2014. This is a very slow earnings growth rate for a steady-earning stock.
Next, I’ll apply that growth rate to current earnings, looking forward 10 years in order to get a final 10-year CAGR estimate. The way I think about this is, if I bought Campbell’s whole business for $100, it would pay me back $5.33 plus +1.05% growth the first year, and that amount would grow at +1.05% per year for 10 years after that. I want to know how much money I would have in total at the end of 10 years on my $100 investment, which I calculate to be about $156.49 including the original $100. When I plug that growth into a CAGR calculator, that translates to a +4.58% 10-year CAGR estimate for the expected business earnings returns.
10-Year, Full-Cycle CAGR Estimate
Potential future returns can come from two main places: market sentiment returns or business earnings returns. If we assume that market sentiment reverts to the mean from the last cycle over the next 10 years for Campbell, it will produce a -0.97% CAGR. If the earnings yield and growth are similar to the last cycle, the company should produce somewhere around a +4.58% 10-year CAGR. If we put the two together, we get an expected 10-year, full-cycle CAGR of +3.61% at today’s price.
My Buy/Sell/Hold range for this category of stocks is: above a 12% CAGR is a Buy, below a 4% expected CAGR is a Sell, and in between 4% and 12% is a Hold. A +3.61% expected CAGR puts Campbell Soup stock into the “Sell” category.
Conclusion
I monitor the valuation metrics of nearly 600 stocks and update about 50 of them per week. Campbell Soup stock fits very firmly into a category of brand name, slow growing (or sometimes even shrinking) businesses that have very good brand recognition among retirees and also a relatively stable earnings history. Many of these stocks are trading at totally irrational valuations, just like Campbell Soup stock currently is. Even if a person was generous and assumed a 3% earnings growth rate for Campbell long-term. The stock is trading at a P/E multiple over 18. That’s a PEG ratio of 6! It doesn’t make any rational sense for this business to trade at that multiple. None.
Even as a dividend investment, it only yields +2.59%. I would need a 7-8% dividend yield to even get me interested when growth is as slow as it is for Campbell. This is the sort of stock that’s really easy to avoid. Investors who own it would be better off selling and holding cash or buying the S&P 500 index over the medium and long term in my view.
Be the first to comment