

Robert Way
Introduction
My thesis is that BYD (OTCPK:BYDDY) (OTCPK:BYDDF) is one of the companies that is helping to keep the world’s hydrocarbon growth from skyrocketing out of control.
This article relies on company reports that are found at HKEX news. The reports are accessed by filtering on Stock Code/Stock Name “01211 BYD COMPANY.”
At the time of this writing, 1 RMB is $0.14.
Encouraging Numbers
New energy vehicles (“NEVs”) are plug-in hybrid electric vehicles (“PHEVs”) and battery electric vehicles (“BEVs”) like Teslas (TSLA). BYD’s 2021 annual report says that 3.5 million NEVs were sold in China in 2021 out of a total of 26.3 million vehicles, such that NEV vehicles were about 13.4% of the country’s total. In December, the NEV penetration rate in China increased to pass the 19% mark:
China’s new energy vehicle industry has developed from policy-driven to the new stage of market-driven, showing a good developing trend of both market scale and quality. In addition, China’s new energy vehicle industry developed rapidly and gradually became an important engine and innovation highland in the electrification progress of the global automobile industry.
The annual report goes on to say that BYD’s share of the NEV market in China was over 17% in 2021. Not counting commercial vehicles, the 2021 CSR Report says BYD sold 593,745 passenger NEVs in 2021 and that alone gets us close to the 17% country-wide NEV share. The breakdown for BYD’s 2021 passenger NEVs was 272,935 PHEVs plus 320,810 BEVs. Sourcing a CleanTechnica writeup from @JosPontes7, InsideEVs shows that BYD’s BEV growth has been prodigious as they had more BEV registrations in the first 6 months of 2022 than they had sales of BEVs in all of 2021:
Tesla: 564,873 and 19% share (vs 22.7%)
BYD: 326,236 and 11% share (vs 5.5%)
*SAIC (incl. SAIC-GM-Wuling): 321,289 and 10.8% share (vs 14.5%)
Volkswagen Group: 216,004 and 7.3% share (vs 10.7%)
Hyundai Motor Group: 167,305 and 5.6% share
*Much of SAIC’s volume is made up of minis.
In January, BYD reported that they reached the milestone of 70,000 battery-electric bus deliveries to customers worldwide. They say these electric buses have driven a cumulative 3.4 billion miles and reduced CO2 emissions by 3.8 million tons. The January report goes on to explain that BYD has reduced over 9.3 million tons of CO2 emissions on the automobile side since entering the new energy vehicle sector:
The electric journey continues to evolve for BYD and extends beyond its electric bus operations. BYD is the world’s leading new energy vehicle (NEV) manufacturer, with electric trucks, vans and cars also forming part of its product portfolio. BYD delivered over 600,000 NEVs in 2021 alone. Since its entry into the NEV sector, BYD has delivered over 1.5 million new energy vehicles as of December 2021, reducing over 9.3 million tons of CO2 emissions. This is equivalent to planting more than 781 million trees.
BYD’s 2021 CSR Report reveals that 43 major energy-saving and emission-reduction technology transformation projects have been completed in the Shenzhen-Huizhou area in 2021:
Transformation projects (2021 CSR Report)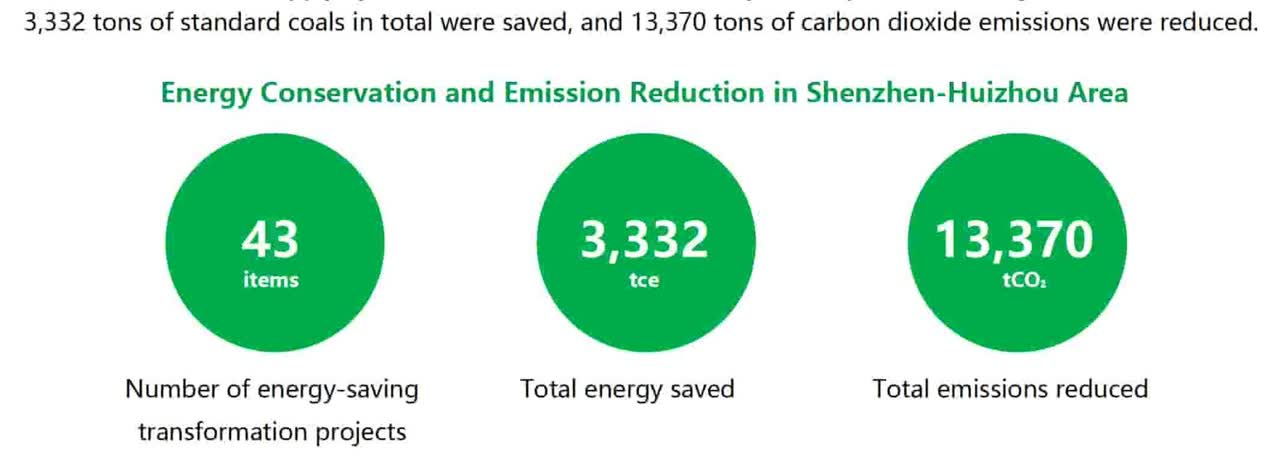
BYD’s 2022 interim report says they stopped making fuel-engine vehicles in March and it explains how things have picked up in the first half of 2022:
According to data from the China Automobile Association, the Group’s market share of new energy vehicles reached 24.7% in the first half of 2022, representing an increment of 7.5 percentage as compared to 2021, leading the domestic new energy vehicle market, and returning to the No. 1 position in the global sales of new energy vehicles, and led the rise of Chinese independent brands.
The 2022 Interim Report goes on to say that 1,000 BYD electric buses have been put into operation in the UK and Colombia. In China, BYD’s sales volume of battery electric and plug-in hybrid models increased rapidly in July, reaching a market share of almost 29%.
Tesla is making serious contributions as well, but they are already widely covered in the headlines. Tesla’s 2021 impact report says their global fleet of vehicles, energy storage and solar panels enabled their customers to avoid emitting 8.4 million metric tons of CO2e in the last year; the breakdown was 6.8 million from vehicles and 1.6 million from solar + storage.
The Big Picture
A December 2021 Nikkei Asia article points out a complicated reality:
China may look as if it is moving toward decarbonization with EVs, but the reality is more complicated.
The above article says China’s increased use of coal for electricity generation is a big part of the complexity:
More than 60% of the power that moves these electrified vehicles in China comes from coal-fired plants.
The good news is that companies like BYD are quickly figuring out how to make BEVs on par with internal combustion (“ICE”) vehicles. The bad news is that we still have a lot of work to do in terms of figuring out how to cheaply store solar and wind power for electricity. China feels inclined to go with reliable 24/7 sources of electricity like coal until we make more progress in the storage area. In the U.S., we face a similar issue and what one hand giveth, the other hand taketh away; the U.S. has been reducing coal use but increasing natural gas use. An August 2022 summary from @MarkPMills at the Manhattan Institute talks about the storage challenges for solar and wind:
Storing electricity itself – the output from solar/wind machines – remains extremely expensive despite the vaunted battery revolution. Lithium batteries, a Nobel-winning invention, are some 400% better than lead-acid batteries in terms of energy stored per unit of weight (which is critical for vehicles). And the costs for lithium batteries have declined more than 10-fold in the past two decades. Even so, it costs at least $30 to store the energy equivalent of one barrel of oil using lithium batteries. That alone explains why, regardless of mandates and subsidies, batteries aren’t a solution at grid scales for days, never mind weeks, of storage. Even though wind/solar machines don’t have fuel costs and have lower maintenance costs than combustion machines, grid-scale battery costs would have to drop at least 20-fold to match the reliability economics of conventional dispatchable power.
BYD makes their vehicles in China, although they’ve announced that they’re building a production plant in Thailand. BYD sells electric buses worldwide, and they started selling their Tang EV in Norway in August 2021. However, the vast majority of their vehicles are sold to customers in China. Given the above storage problem, China has been increasing the use of coal. BP’s (BP) Statistical Review of World Energy 2022 shows that in 2021, China consumed 86.17 EJ of coal, which was nearly 68% of the 127.63 EJ Asia Pacific coal total and 54% of the 160.10 EJ world coal total. The BP report goes on to show that China’s coal electricity generation in 2021 was 5,339.1 TWh which was 67% of the 7,965.6 TWh Asia Pacific total and 52% of the 10,244.0 TWh world total.
Just as renewables don’t even appear in BP’s consolidated consumption by fuel table for 2006, the energy savings from companies like BYD and Tesla are very small right now. However, they will grow in time, and eventually they will make a substantial difference. We still have a long way to go in terms of containing our reliance on oil, seeing as BP’s Statistical Review of World Energy 2022 reports that the world produced 4,221 million tonnes of oil in 2021. Part of the challenge is that oil has many uses apart from transportation. The EIA reports that China consumed 14 million barrels of oil per day in 2019 which was about 14% of the world’s total. Economist Intelligence shows that nearly 54% of China’s oil went to the transport sector in 2018 while 23% went to non-energy, 8.4% went to industry, 8.2% went to residential and the remaining 6.5% went to agriculture/commercial.
China recognizes that we have better BEV technology to help with oil than we do wind/solar electric storage technology to help with coal and natural gas. I believe they feel that the wind/solar electric storage technology will be better in 2030 so that we’ll have improved economics for making and storing more of our electricity from renewable sources. BYD talks about China’s carbon planning in the 2021 CSR Report:
In 2020, after China announced to the world that it would strive to achieve carbon peak by 2030 and carbon neutral by 2060, BYD made quick responses by launching a carbon neutral planning study in February 2021 to explore carbon footprint standards for the new energy vehicle industry.
The Tesla 2021 impact report shows that transportation is responsible for 17% of the world’s greenhouse gas emissions, trailing sectors like “electricity & heat production” which is 31% and “industry” which is 19%. The world is consuming more oil, natural gas and coal than ever but I’m optimistic that companies like BYD will help us from spiraling out of control as their EVs help mitigate our otherwise high demand for oil:
Global consumption by fuel (Author’s spreadsheet from BP’s Statistical Review of World Energy reports)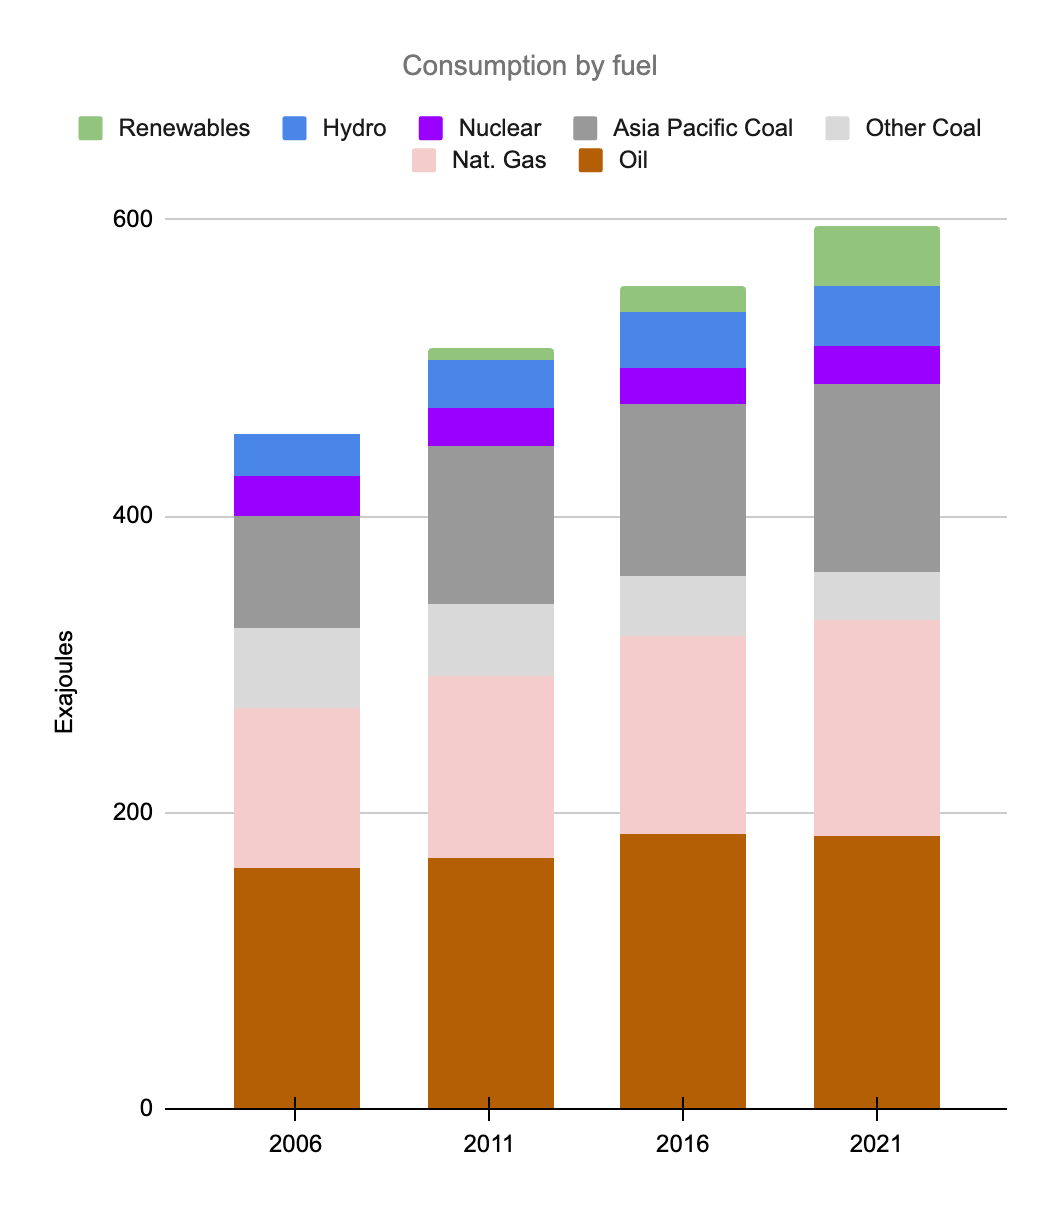
*BP uses million tonnes oil equivalent for 2016 and earlier years above so we multiplied by 0.041868 to convert the older years to exajoules such that they would be consistent with 2021.
We see above that coal consumption is down significantly in North America and Europe but it is up substantially in Asia Pacific. Renewables are on the rise, but they need to keep going, especially in Asia Pacific as we improve our wind/solar storage technology. It is encouraging that consumption of renewables outside of Asia Pacific is getting close to passing consumption of coal outside of Asia Pacific; the 2021 numbers are 22.69 EJ and 32.47 EJ, respectively.
The global electricity generation numbers from 2017 to 2021 show that renewables are increasing nicely even though we have limitations with the economics on the storage side:
Global electricity by fuel (Author’s spreadsheet from BP’s Statistical Review of World Energy reports)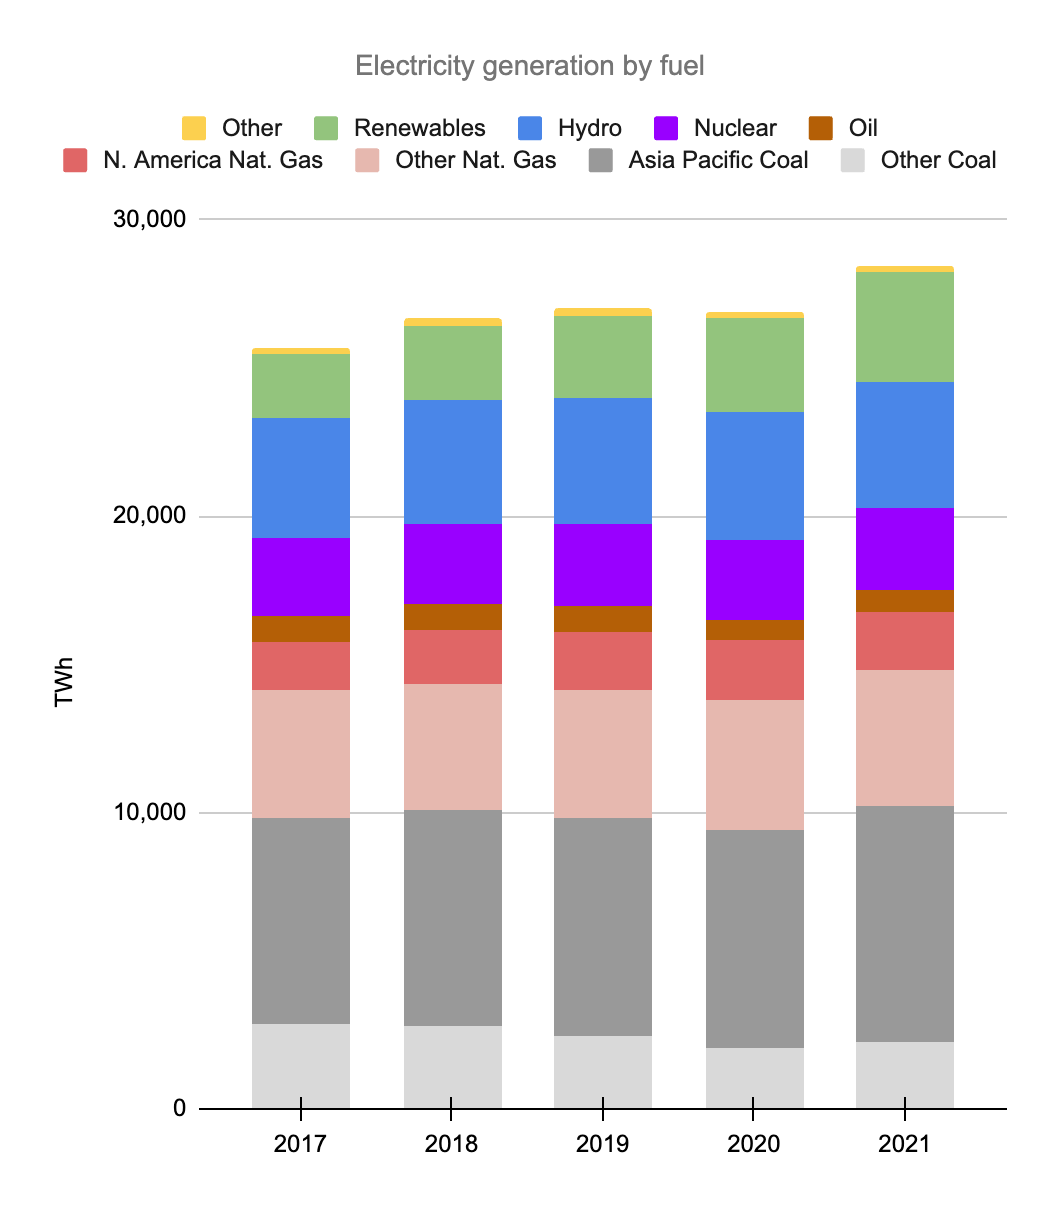
Looking at the 2021 year, electricity generated from renewables outside of Asia Pacific was 1,967.1 TWh and electricity generated from coal outside of Asia Pacific was 2,278.4 TWh. Thankfully, I think the former will pass the latter in 2022. In other words, we are on the verge of generating more electricity from renewables than from coal outside of Asia Pacific.
We have to be careful when going back and forth between the above consumption input-equivalents in exajoules (“EJ”) and the electricity generation numbers in TWh. Looking at hydro as an example, the BP Statistical Review of World Energy 2022 report says global hydroelectricity consumption was 40.26 exajoules. Their table shows an efficiency factor of 40.6% for 2021 and it was a lower percentage in previous years. Their report shows that global electricity generated by hydro was 4,273.8 TWh. Using the efficiency factor table, 4,273.8 TWh/0.406 = 10,527 TWh. The BP calorific equivalents table states that 1 EJ is about 278 TWh. As such, 10,527 TWh is about 37.9 EJ which is fairly close to the 40.26 EJ figure we see in their consumption table.
BYD Stock’s Valuation
The 2022 Interim Report says 1H22 revenue was RMB 150,607 million, up almost 66% from 1H21. RMB 109,267 million came from automobiles, while handset/mobile revenue was RMB 41,070 million. 1H22 gross profit was RMB 20,342 million. 1H22 profit before adjustments was RMB 3,856.3 million for automobiles and RMB 674.8 million for handset/mobile. The business is worth the amount of cash that can be pulled out of it from now until judgment day but the cash flow from operating activities section of the cash flow statement in the 2021 annual report has more lines than what I’m used to seeing. Typically, free cash flow (“FCF”) is defined as cash provided by operating activities less capex but management at some companies defines it differently. For example, Union Pacific (UNP) defines it as cash provided by operating activities less all the cash used in investing activities, not just the capex from investing activities; Union Pacific also subtracts dividends paid. It is hard for me to distinguish capex from other lines in BYD’s “cash used in investing activities” section and in some ways I think it makes sense to take the approach used by Union Pacific’s management, although I don’t subtract dividends. Either way, BYD is growing revenue rapidly and it is hard to know what their net earnings and free cash flow would look like in a more steady-state environment. As such, I’m not yet comfortable putting a valuation range on them. Forward-looking investors should look for explanations from management regarding the outlook for future cash flows.
YCharts shows a market cap of nearly $80 billion based on the September 13th BYDDF share price of $27.27 and the 2,910 million shares outstanding. Again, I’m not sure of my valuation range at the time of this writing, so it’s hard to say if Mr. Market is right about today’s levels.
Be the first to comment