

BTCUSD – Rounding Bottom Pattern Above $17600
Bitcoin was unable to sustain its bearish momentum and after touching a low of 17678 on 18th June started to correct upwards and is now trading above $21000 handle in the European Trading session.
We can see that after touching an 18-month low the prices of Bitcoin have pulled back due to the buying seen at lower levels from the long-term investors.
Bitcoin entered into a Consolidation channel above the $18000 handle and continues to rise above these levels.
The Global demands for Bitcoin have improved now and the prices are expected to cross $22000 levels.
We can clearly see a Rounding Bottom Pattern Above the $17600 handle which is a Bullish reversal pattern because it signifies the end of a Downtrend and a shift towards an Uptrend.
Both the STOCH and STOCHRSI are indicating Overbought levels which means that in the immediate short term a decline in the prices is expected.
Relative Strength Index is at 66 indicating a STRONGER demand for the Bitcoin at the current market levels.
Bitcoin is now moving Above its 100 hourly Simple Moving average and its 200 hourly Simple Moving averages.
All of the Major Technical Indicators are giving a STRONG BUY Signal, which means that in the immediate short term we are expecting targets of 22000 and 23500.
Average True Range is indicating LESS Market Volatility with a Strong Bullish Momentum.
· Bitcoin Bullish Reversal seen Above $17600.
· Williams Percent Range is Indicating OVERBOUGHT Levels.
· The price is now trading just Above its Pivot Levels of $21263.
· All of the Moving Averages are giving a STRONG BUY market signal.
Bitcoin Bullish Reversal Seen Above $17600
The prices of Bitcoin have entered into a consolidation channel above the $18000 handle and the pullback seen is expected to continue touching levels of $22000.
We can see the formation of a Rising Trend channel above the $18000 handle and now we are looking at the projected levels of $22000 and $24000.
The immediate short-term outlook for Bitcoin is Strong Bullish, Medium-term outlook has turned as Bullish, and the long-term outlook remains Neutral under present market conditions.
Bitcoin continues to consolidate above its important support levels of $21000 and further appreciation in its prices is expected in the US Trading session.
The price of BTCUSD is now facing its Classic resistance levels of 21486 and Fibonacci resistance levels of 21633 after which the path towards 22000 will get cleared.
In the last 24hrs BTCUSD has increased by 3.43% by 705$ and has a 24hr trading volume of USD 32.005 Billion. We can see a Decrease of 12.38% in the Trading volume as compared to yesterday, which is due to the buying by the long-term investors.
The Week Ahead
The prices of Bitcoin are moving in a Strong Bullish momentum and the immediate targets are $22000 and $23500
The Daily RSI is printing at 31 which means that the medium range demand continues to be WEAK.
We can see that the prices of Bitcoin have stabilized above the $21000 handle and now we are looking at the important support levels of $21237 and $21305.
The prices of BTCUSD will need to remain above the important support levels of $21000 this week.
Weekly outlook is projected at $22500 with a consolidation zone of $21000.
Technical Indicators:
Moving Averages Convergence Divergence (12,26): It is at 279 indicating a BUY.
Ultimate Oscillator: It is at 64.37 indicating a BUY.
Rate of Price Change: It is at 5.69 indicating a BUY.
Commodity Channel Index(14days): It is at 171.10 indicating a BUY.
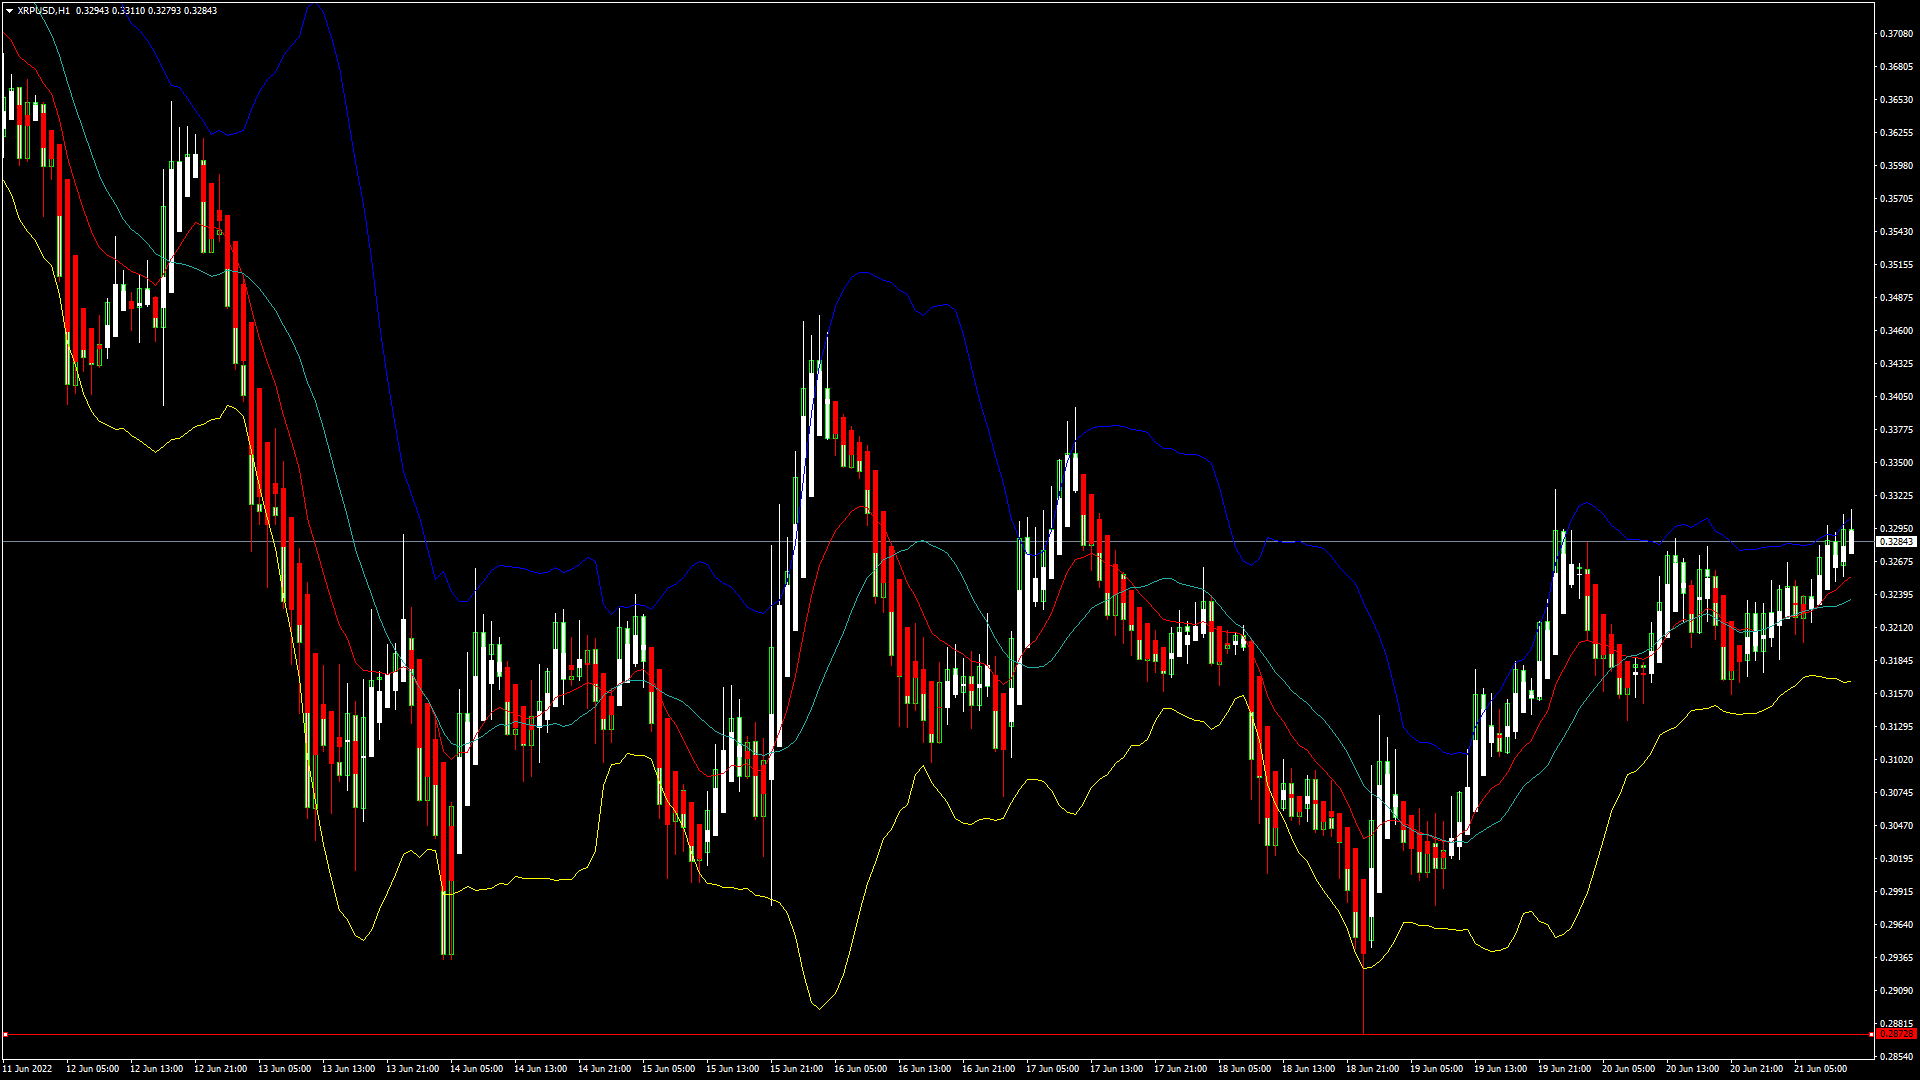
XRPUSD – Doji Star Bullish Pattern Above 0.2872
Ripple was unable to sustain its bearish momentum and after touching a low of 0.2872 started to correct upwards crossing the 0.3200 handle in the European Trading session today.
We can see that prices have crossed the 100-day Moving Average in the 2 hours timeframe indicating that the trend is upwards.
We can see that the prices of Ripple continue to correct upwards, now trading above the 0.3200 handle in the European Trading session today.
We can clearly see a Doji Star Bullish Pattern above the 0.2872 handle which signifies the end of a Downtrend and a shift towards an Uptrend.
The Short-term outlook for Ripple has turned as Strong Bullish, Medium-term outlook is Neutral, and the Long-Term outlook is Neutral under present market conditions.
Relative Strength Index is at 60 which signifies a STRONG demand for the Ripple at the current market prices and the continuation of the Uptrend this week.
All of the Moving Averages are giving a STRONG BUY Signal at the current market levels of 0.3286
Ripple is now trading Below its Pivot levels of 0.3287 and is now facing its Classic Resistance levels of 0.3316 and Fibonacci Resistance levels of 0.3337 after which the path towards 0.3500 will get cleared.
ALL of the Major Technical Indicators are giving a STRONG BUY Signal.
· Ripple Bullish Reversal seen Above the 0.2872 levels.
· The Williams Percent Range is indicating OVERBOUGHT levels.
· Average True Range indicates LESS Market Volatility.
· The Daily RSI is Below 50 at 38 indicating BEARISH trends.
Ripple Bullish Reversal Seen Above 0.2872
We can see that the prices of Ripple have entered into a consolidation channel above the 0.3200 handle in the European Trading session today.
We can see that the Commodity Channel Index is indicating a Bullish Divergence pattern in the daily time frame.
The recovery that is seen in the prices of Ripple is expected to continue pushing it above the 0.3300 levels.
We can see that XRP touched a Low of 0.3174 in the Asian Trading session and an Intraday High of 0.3309 in the European Trading session today.
The price of XRPUSD has increased by 1.57% with a price change of $0.005065 in the past 24hrs and has a trading volume of 1.223 Billion USD.
We can see a Decrease of 3.68% in the Trading volumes of Ripple as compared to yesterday, which appears to be Normal.
This Week Ahead
The prices of XRPUSD are now moving into a Consolidation Channel above the 0.3200 handle and the next visible targets are 0.3300 and 0.3500
We can see that US SEC case against the Ripple Labs continues to weigh down on its prices and a positive outcome will instill the investor confidence and favor the Bullish trend that we have seen this week.
In the next week Ripple is expected to enter into a fresh wave of buying above the 0.3200 handle
The weekly outlook for Ripple is projected at 0.3350 with a consolidation zone of 0.3200
Technical Indicators:
Moving Averages Convergence Divergence (12,26): It is at 0.002 indicating a BUY.
Average Directional Change(14days): It is at 23.87 indicating a BUY.
Rate of Price Change: It is at 3.28 indicating a BUY.
Ultimate Oscillator: It is at 60.15 indicating a BUY.
Be the first to comment