

herkisi
This article was published on Dividend Kings on Tuesday, November 29th.
One year ago the global chip shortage was causing chip makers to mint money, and their stocks were Wall Street darlings. Wall Street was abuzz about the end of semiconductor cyclicality and a glorious new era for chip stocks.
YCharts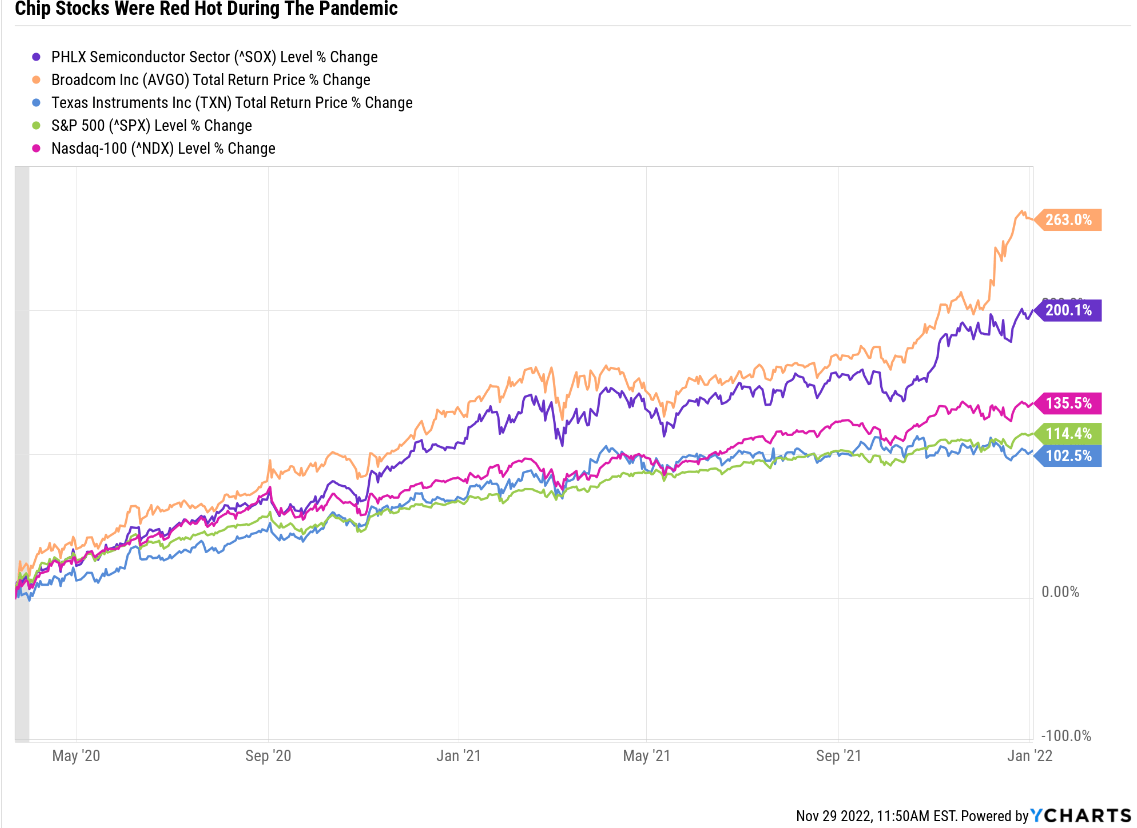
Alas, it turns out the chip industry is still cyclical, and a global recession has caused demand for chips to drop significantly. Smart phone demand and GRUs for crypto mining have been especially hard hit.
YCharts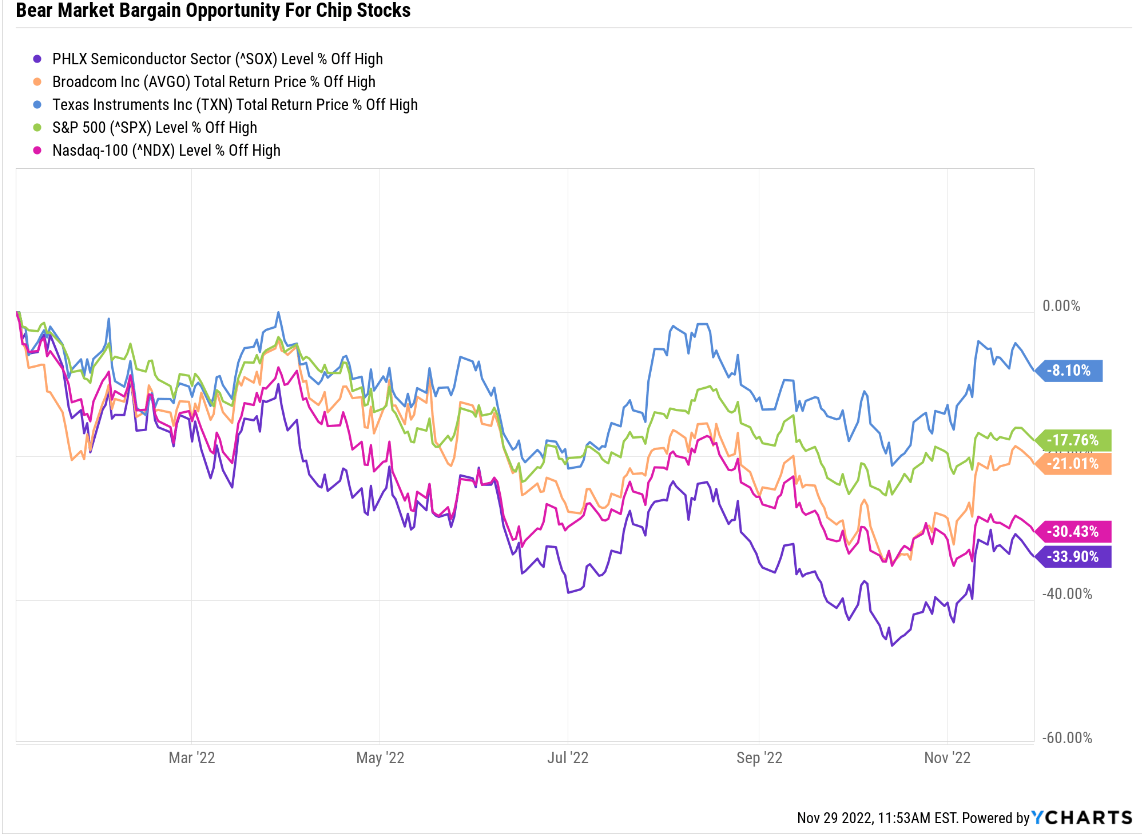
On October 13th, the bear market low so far, chip makers were down almost 50%. Even world-beater blue-chips like Texas Instruments (NASDAQ:TXN) was in a bear market while Broadcom (NASDAQ:AVGO) was down 35%.
Since then, yet another “fed pivot” bear market rally has caused chip stocks to recover, though the rally appears to have stalled.
Daily Shot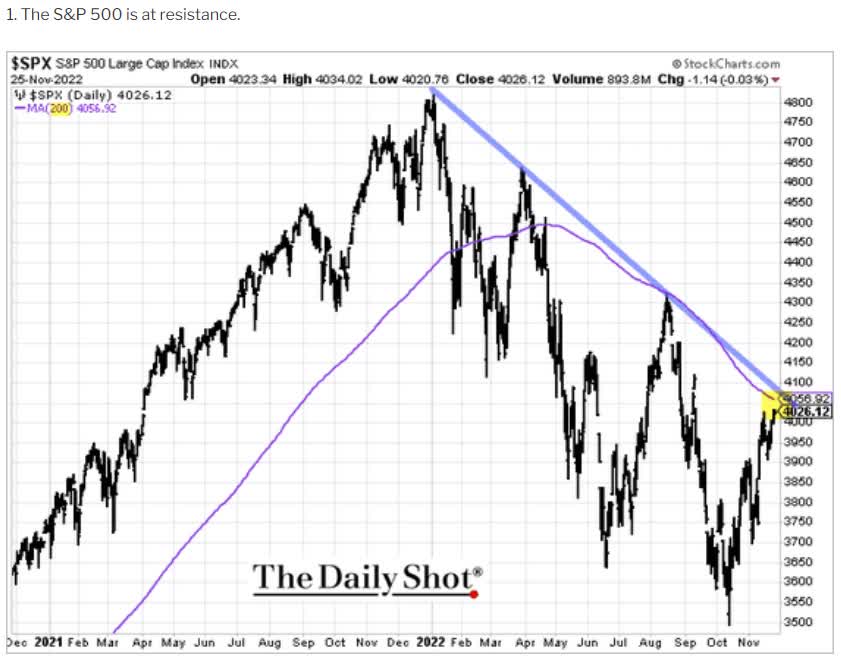
That’s exactly what Morgan Stanley, the most accurate economist team of 2022, was predicting. Why? Because the 2022 bear market has not priced in the 2023 recession.
- FactSet consensus is still for 6% EPS growth next year
With a recession likely three to five months away, based on 18 economic indicators, it’s likely stocks haven’t bottomed yet. How low could they fall?
- Morgan Stanley’s base-case is the S&P has 17% lower to fall, bottoming around 3,300 in February or March
- peak earning pessimism
- Goldman and UBS think the market bottoms around 3,150 to 3,200 in mid 2023
- JPMorgan thinks it might be Q4 2023
- blue-chip consensus range is S&P bottoms at 3,000 to 3,400 sometime in 2023
The good news for both Wall Street and Main Street is that the 2023 recession is likely to be mild.
Daily Shot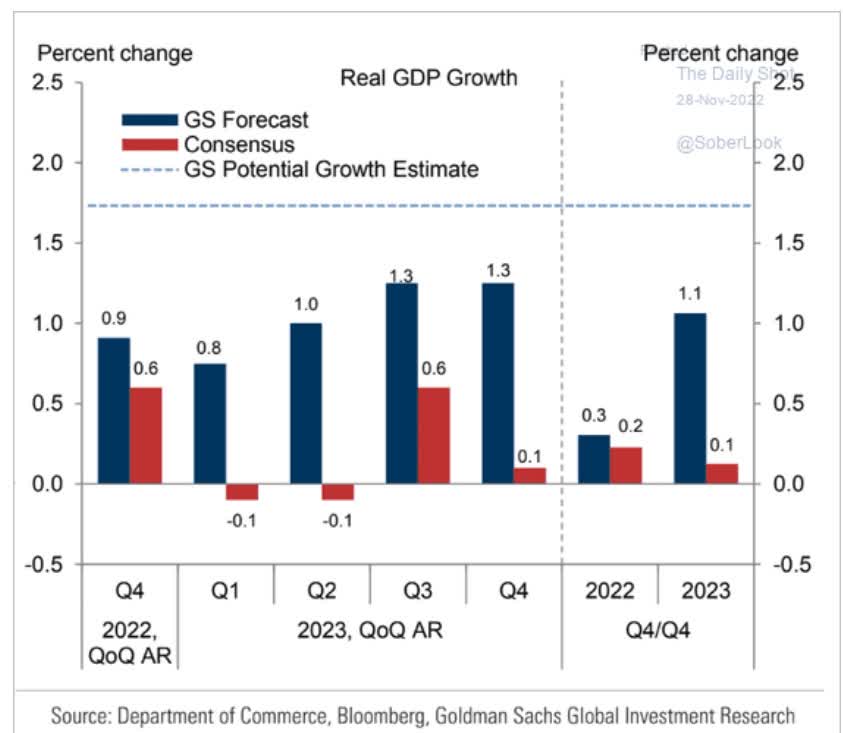
In fact, the blue-chip consensus thinks the 2023 recession will be a 0.2% peak decline lasting six months. That would be the mildest recession in history. Why so mild? Isn’t the Fed on the inflation-fighting warpath?
Daily Shot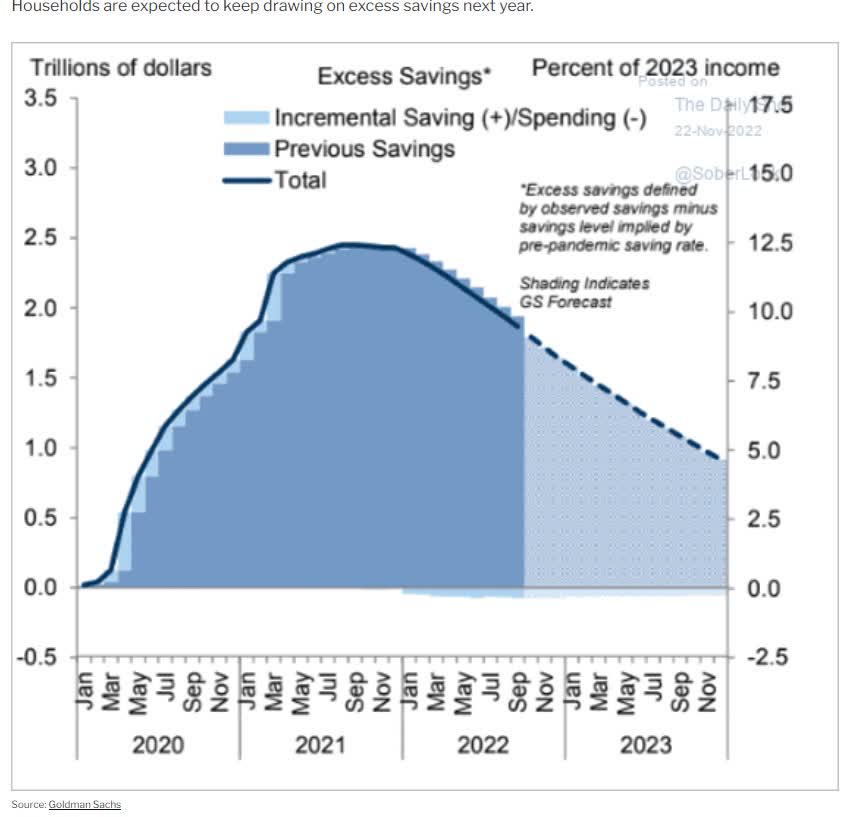
Because Americans are still sitting on $2 trillion in excess savings, and Goldman thinks we’ll still have $1 trillion left at the end of next year.
According to the CEO survey from the Conference Board:
- 85% of CEOs expect a “mild and short” recession in 2023
- 44% are planning to keep hiring in 2023
- just 16% are planning to cut back on growth spending in 2023
What about rising unemployment? Won’t that hurt consumer spending which drives 70% of the economy?
- unemployment is expected to peak at 4.5% to 6% in 2023
- since 1948 the average unemployment rate is 5.74%
In other words, even if unemployment rises by 2%, and 3 million people lose their jobs, 5.5% unemployment would still be slightly below average for the last 74 years.
- Since 1948 the US economy was growing 92% of the time
Growth near zero in 2022 and 2023 isn’t bullish for stocks, but it also means that the market is likely closer to bottom than many investors fear.
And that’s why it’s worth having a watchlist of blue-chips ready to pounce on the amazing bargains that might be coming soon.
Recently several Dividend Kings members have asked for an update on Texas Instruments and Broadcom, two of our favorite dividend chip makers.
So let’s take a look at why you might want to be ready to buy both AVGO and TXN with both hands, to take advantage of the most anticipated and possibly mildest recession in US history.
Why You Want To Buy Texas Instruments In This Recession
Texas Instruments isn’t just a high quality dividend chip stock, it’s the 2nd highest quality dividend chip maker on the DK Master List.
- 2nd to TSM
- 81st highest quality company on the Master List
- 84th percentile among the world’s highest quality blue-chips
Why is TXN such a high-quality chip maker? More importantly why should almost all dividend investors at least consider owning it.
Let’s start with the dividend streak.
Ben Graham considered 20+ years without a dividend cut an important sign of quality and a 20+ year dividend growth streak a sign of excellence.
TXN has been raising its dividend for 19 consecutive years, almost achieving the Graham standard of excellence.
More impressively? The company has a 60-year consecutive dividend streak (no cuts).
investor presentation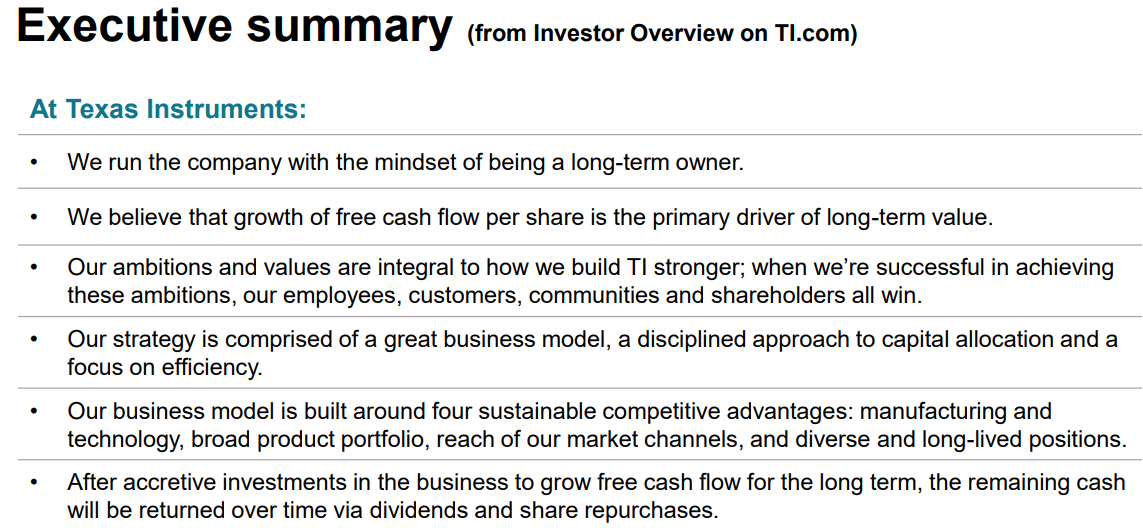
This isn’t just a shareholder friendly company, it’s quite possibly the most shareholder friendly company in the world.
You couldn’t ask for a better capital allocation strategy then what TXN offers.
Maximizing free cash flow per share over the long-term? Amen! That is indeed the truest source of intrinsic value.
Managing the business for the benefit of all stakeholders? That’s brilliant according to S&P, Moody’s, Fitch, Morningstar, and pretty much every major investment bank.
Returning 100% of free cash flow each year to shareholders via a steadily growing dividend and buybacks? That’s the optimal strategy for any company.
Why? Because free cash flow is what’s left over after running the business and investing in all future growth. A 100% FCF cash return payout ratio means TXN always invests in the business first, and then gives us shareholders whatever is left over.
Ben Graham, if he were alive today, would almost certainly say that TXN’s management policies are as close to ideal as is possible on Wall Street.
investor presentation investor presentation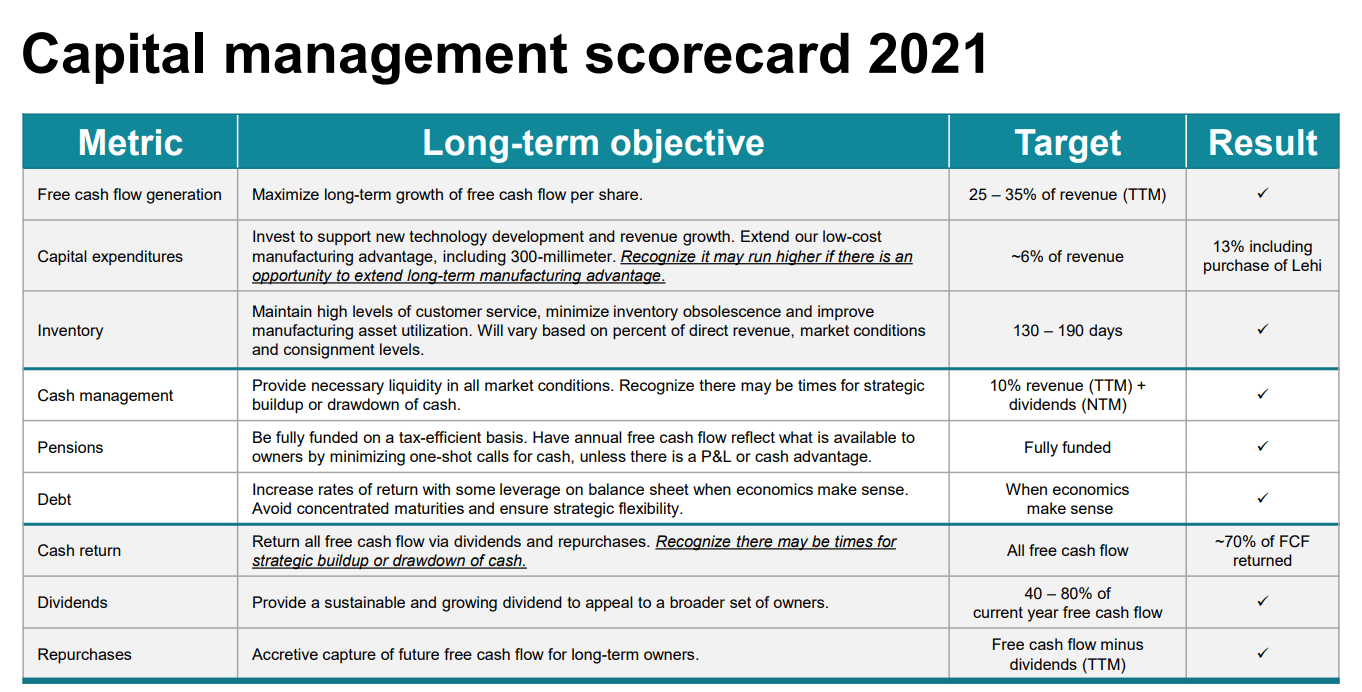
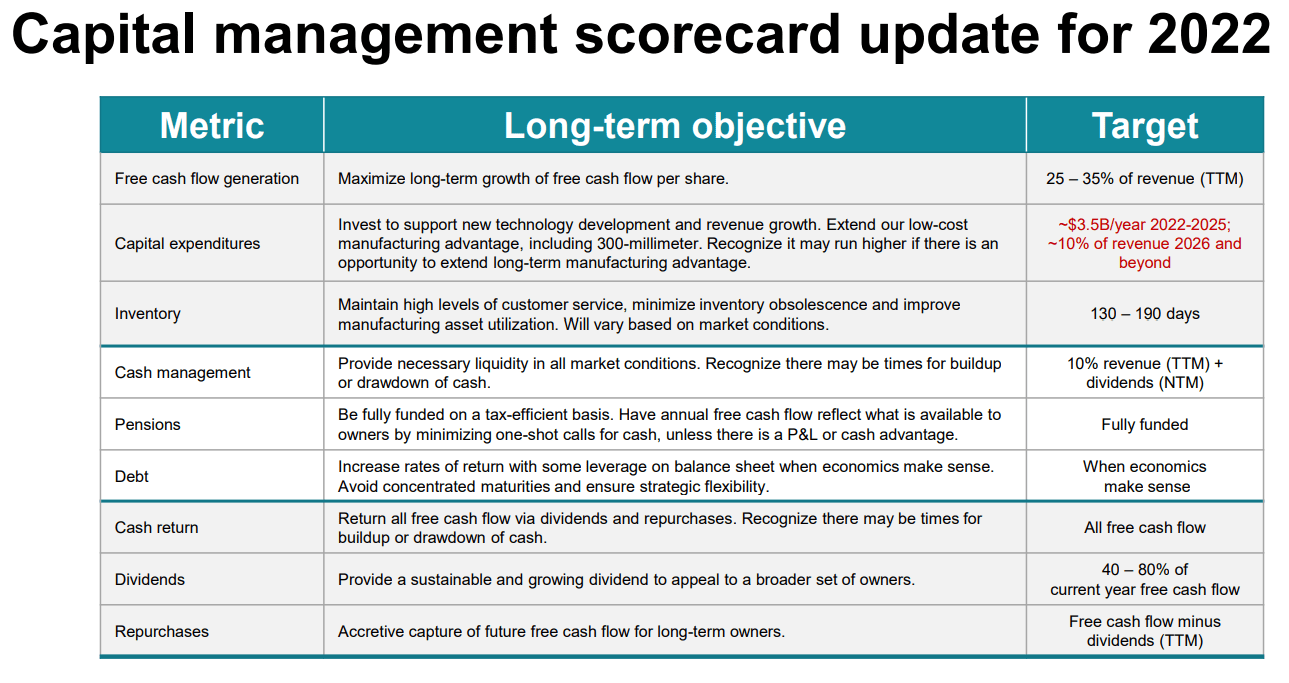
That doesn’t mean that management always achieves its goals, but it usually comes very close.
YCharts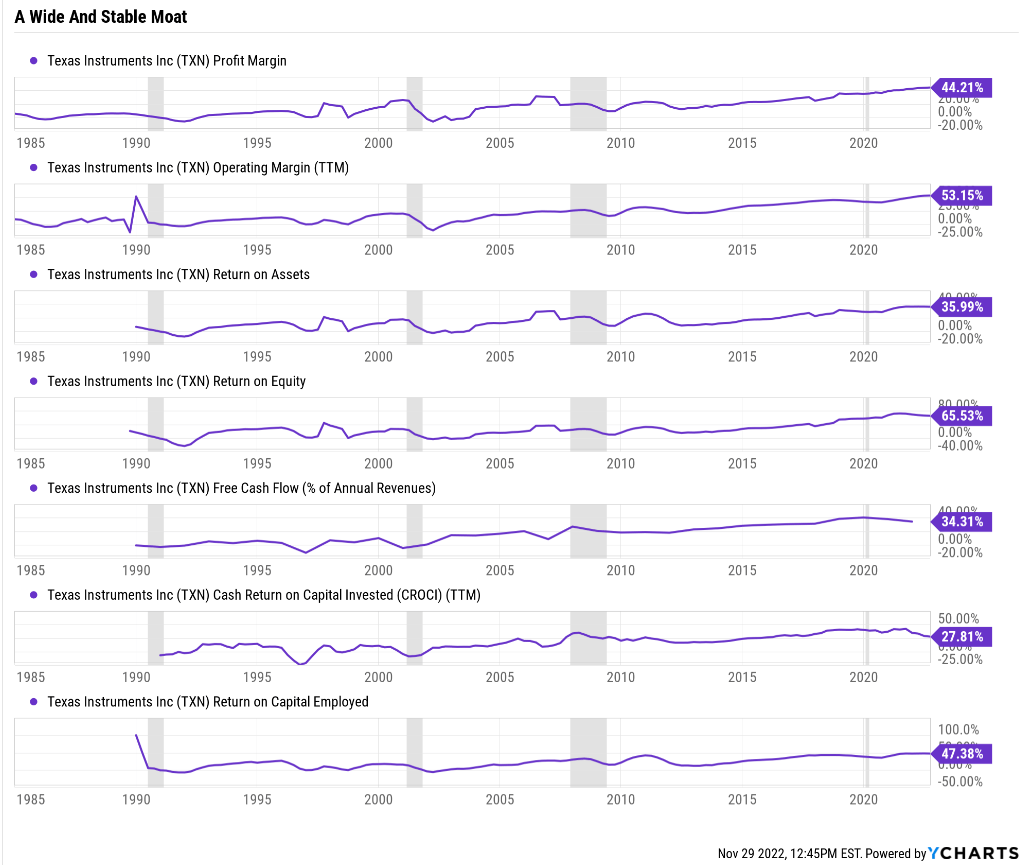
TXN’s profits are the stuff of legends. Historically they are in the top 4% of its peers.
In fact, TXN’s 34% free cash flow margins are in the top 11% of the S&P 500.
For context, Apple’s FCF margins are 25%, 10% lower than TXN, who operates its own manufacturing plants, while Apple outsources all of its production.
FactSet Research Terminal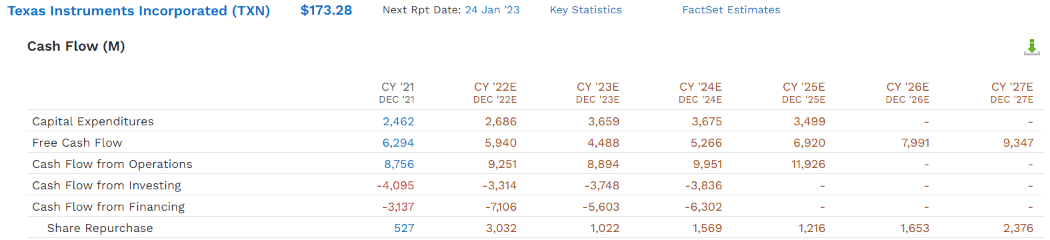
TXN’s free cash flow is expected to nearly double by 2027, to $9.4 billion.
- 39% FCF margin consensus in 2027
- top 5% of all companies on earth
shareholder presentation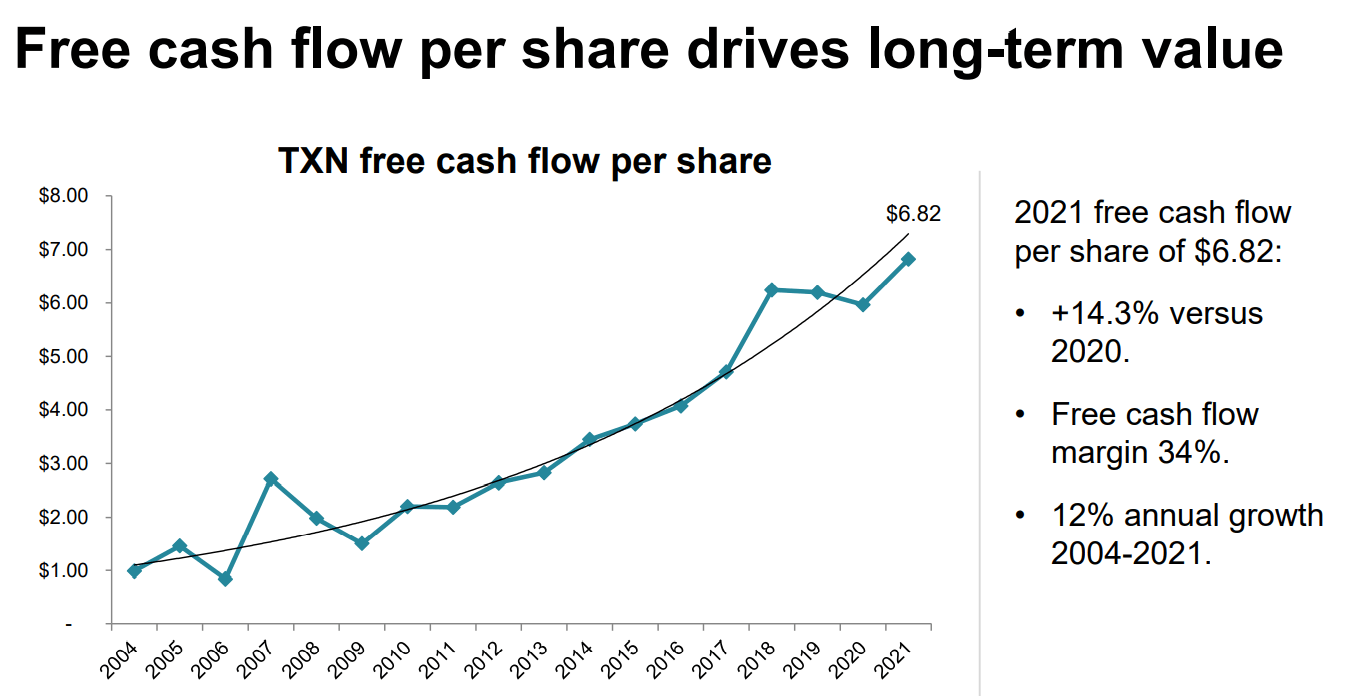
TXN’s FCF is remarkably stable for a chip maker, thanks to its incredible capital efficiency.
shareholder presentation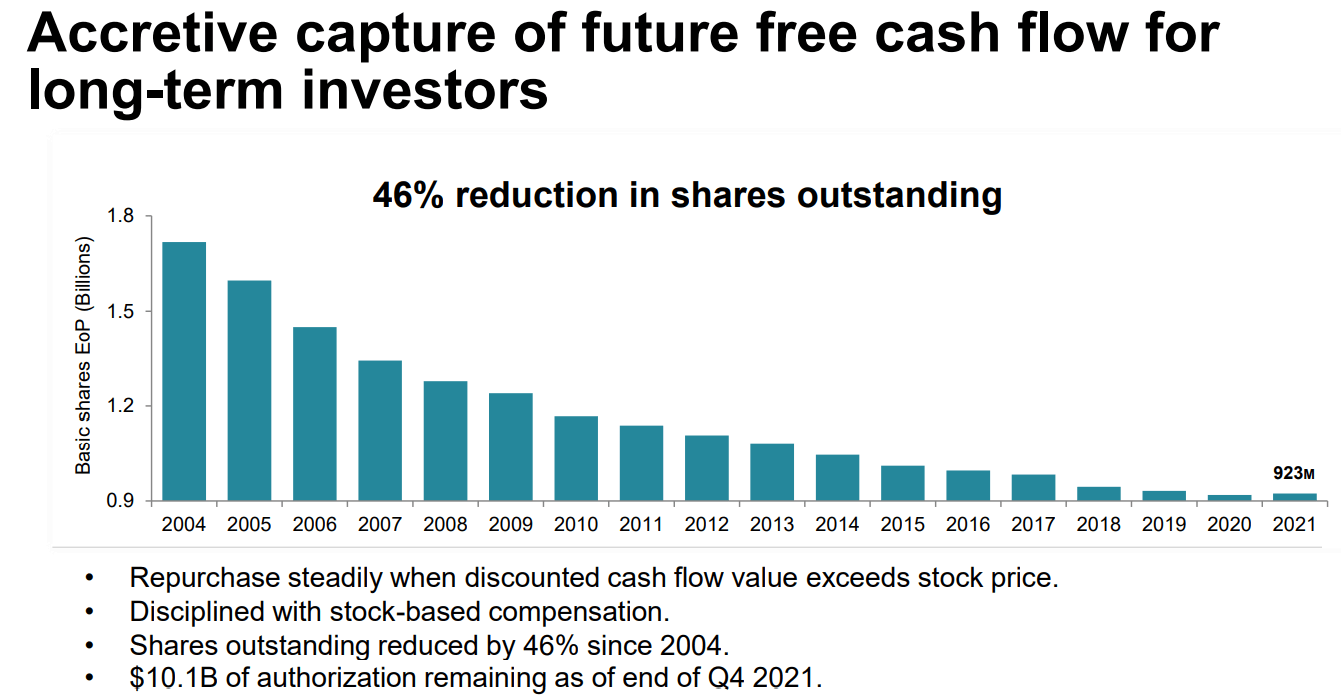
Since beginning its buyback program in 2004 TXN has cut its share count in half.
FactSet Research Terminal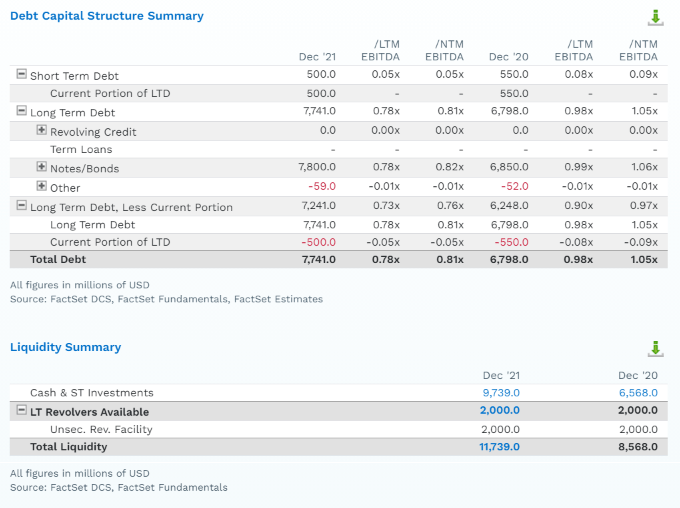
TXN has more cash than debt and a stable A+ credit rating.
- 0.6% 30-year bankruptcy risk according to S&P
What about TXN’s risk management? All companies face challenges, both secular and cyclical, and TXN is no exception.
Risk Management You Can Trust
DK uses S&P Global’s global long-term risk-management ratings for our risk rating.
- S&P has spent over 20 years perfecting their risk model
- which is based on over 30 major risk categories, over 130 subcategories, and 1,000 individual metrics
- 50% of metrics are industry specific
- this risk rating has been included in every credit rating for decades
The DK risk rating is based on the global percentile of how a company’s risk management compares to 8,000 S&P-rated companies covering 90% of the world’s market cap.
TXN Scores 80th Percentile On Global Long-Term Risk Management
S&P’s risk management scores factor in things like:
- supply chain management
- crisis management
- cyber-security
- privacy protection
- efficiency
- R&D efficiency
- innovation management
- labor relations
- talent retention
- worker training/skills improvement
- occupational health & safety
- customer relationship management
- business ethics
- climate strategy adaptation
- sustainable agricultural practices
- corporate governance
- brand management
If you can think of something that can go wrong with TXN’s business, rest assured S&P has already thought of it and included it into its risk management model.
| Classification | S&P LT Risk-Management Global Percentile |
Risk-Management Interpretation |
Risk-Management Rating |
| BTI, ILMN, SIEGY, SPGI, WM, CI, CSCO, WMB, SAP, CL | 100 | Exceptional (Top 80 companies in the world) | Very Low Risk |
| Strong ESG Stocks | 86 |
Very Good |
Very Low Risk |
| Texas Instruments | 80 |
Very Good |
Very Low Risk |
| Foreign Dividend Stocks | 77 |
Good, Bordering On Very Good |
Low Risk |
| Ultra SWANs | 74 | Good | Low Risk |
| Dividend Aristocrats | 67 | Above-Average (Bordering On Good) | Low Risk |
| Low Volatility Stocks | 65 | Above-Average | Low Risk |
| Master List Average | 61 | Above-Average | Low Risk |
| Dividend Kings | 60 | Above-Average | Low Risk |
| Hyper-Growth stocks | 59 | Average, Bordering On Above-Average | Medium Risk |
| Dividend Champions | 55 | Average | Medium Risk |
| Monthly Dividend Stocks | 41 | Average | Medium Risk |
(Source: DK Research Terminal)
It’s no surprise that TXN is one of the best performing stocks in history. Over the long-term, as Graham teaches us, the market almost always correctly “weighs the substance of a company”.
And the market’s conclusion on TXN is unquestionably that this is a world-beater blue-chip.
Total Return Since 1985
Portfolio Visualizer Premium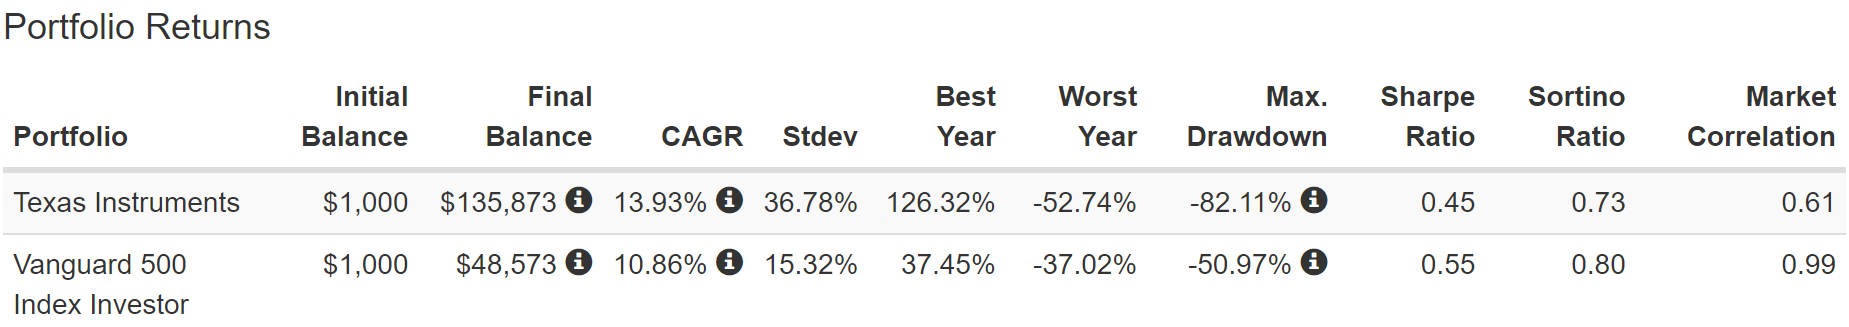
TXN has delivered 14% annual returns for 37 years, a 136X return.
Portfolio Visualizer Premium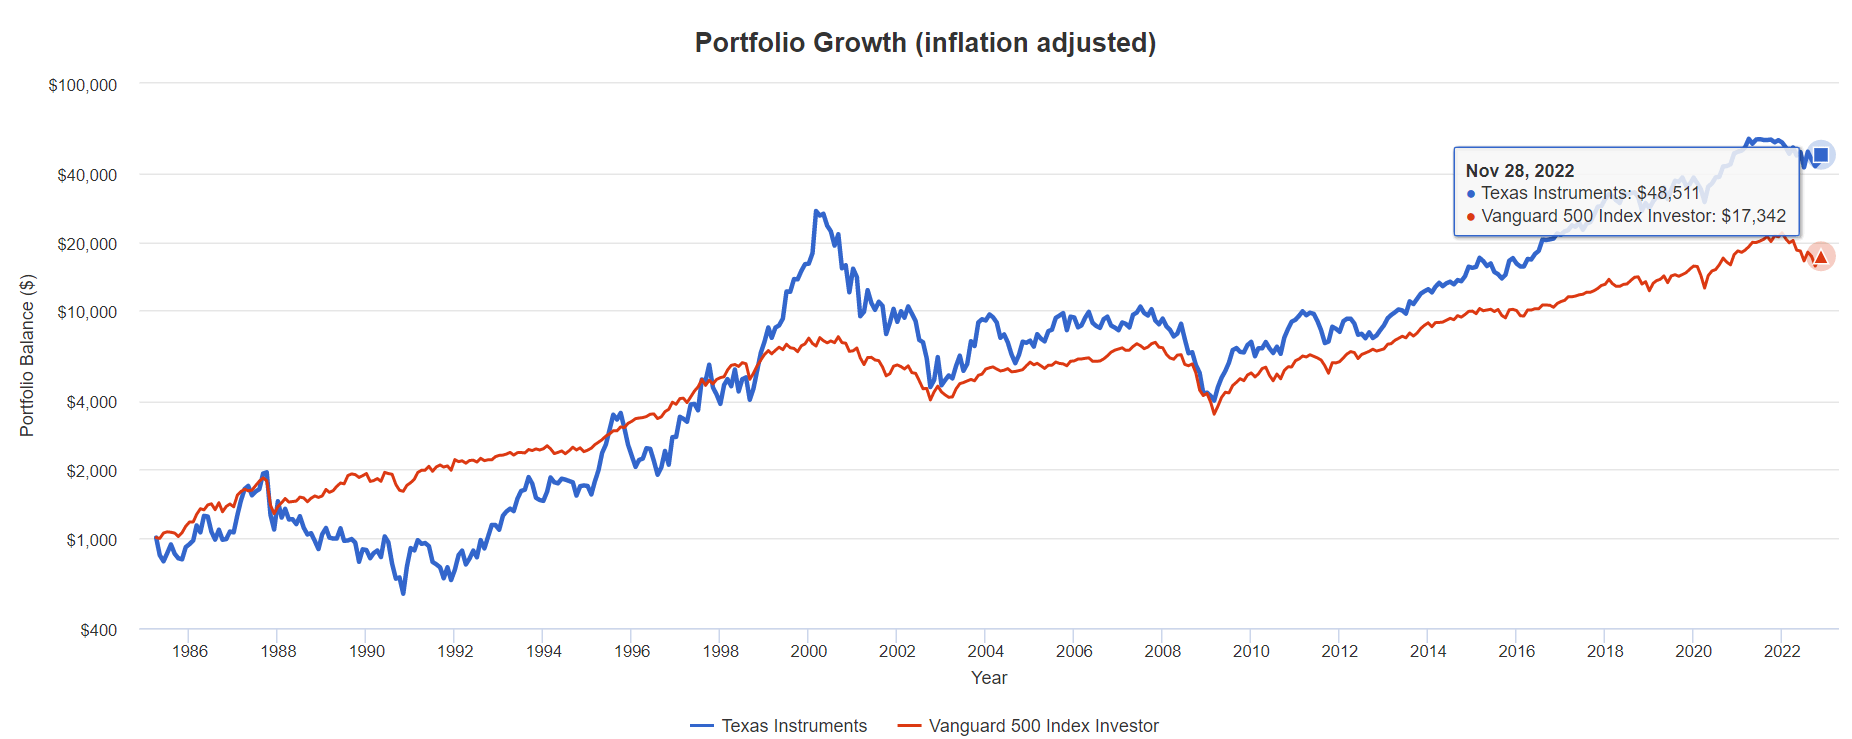
Adjusting for inflation that’s a 49X return, 3X more than the S&P 500.
16% Annual Dividend Growth For 36 Years!
Portfolio Visualizer Premium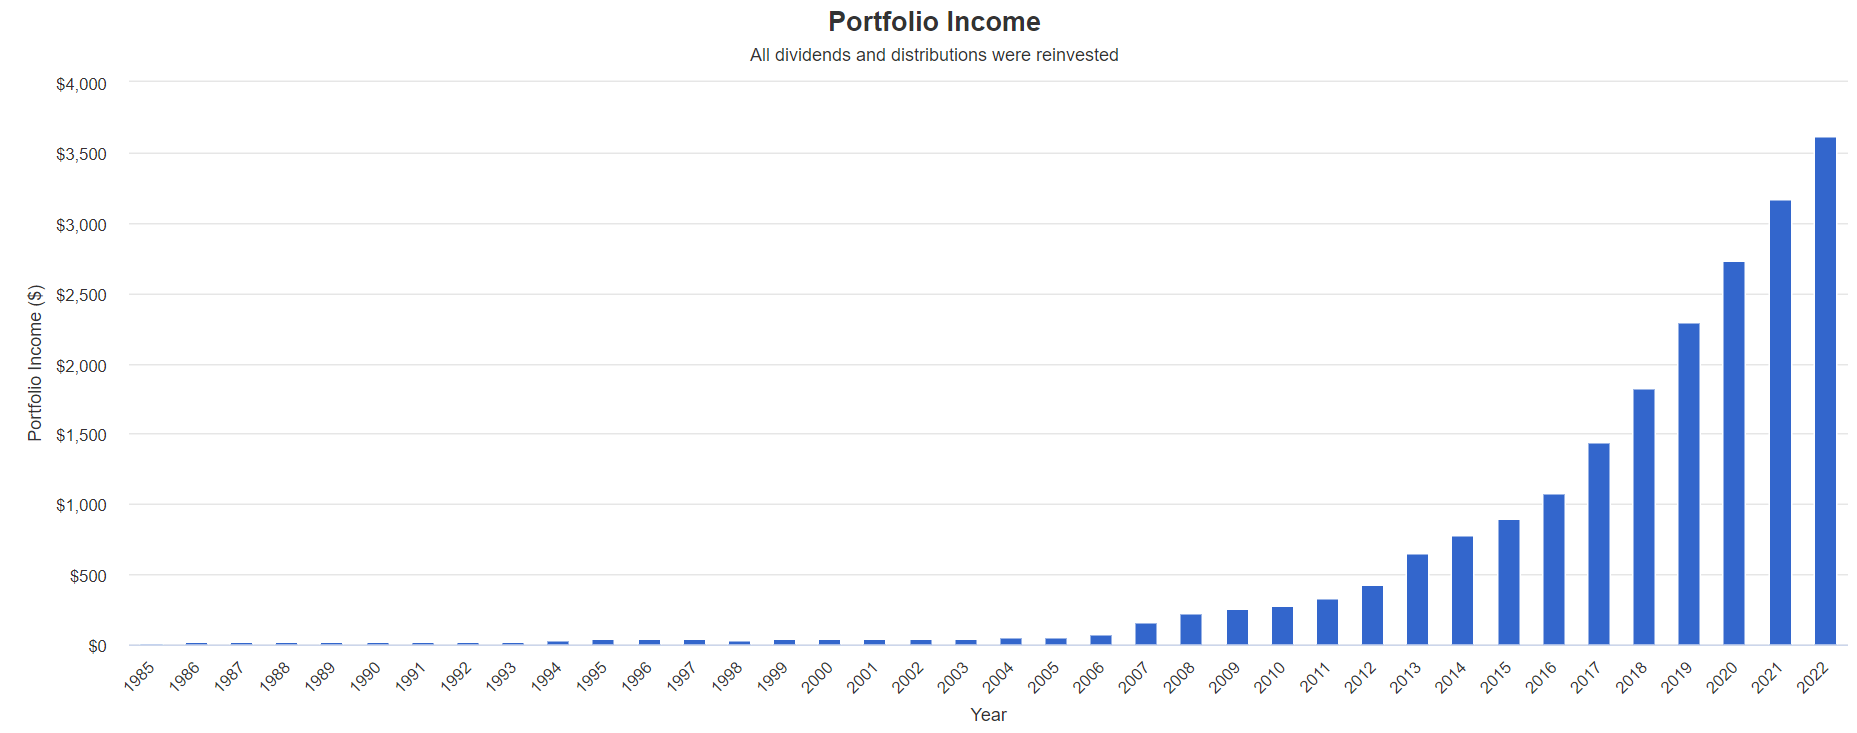
TXN has been doubling its dividend every five years, for nearly four decades.
$1 invested in TXN in 1985 is now paying almost $4 in annual dividends.
What about the future?
FactSet Research Terminal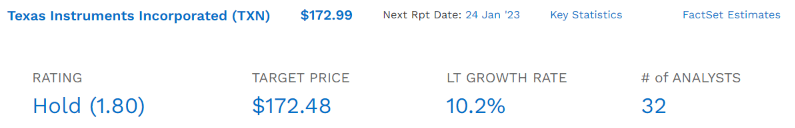
The median long-term growth consensus for TXN from all 32 analysts is 10.2%. What does that mean for long-term income investors?
Consensus Total Return Potential: Ignoring Valuation
| Investment Strategy | Yield | LT Consensus Growth | LT Consensus Total Return Potential | Long-Term Risk-Adjusted Expected Return | Long-Term Inflation And Risk-Adjusted Expected Returns | Years To Double Your Inflation & Risk-Adjusted Wealth |
10-Year Inflation And Risk-Adjusted Expected Return |
| Texas Instruments | 2.9% | 10.2% | 13.1% | 9.2% | 6.8% | 10.5 | 1.94 |
| Nasdaq | 0.8% | 11.8% | 12.6% | 8.8% | 6.5% | 11.0 | 1.88 |
| Schwab US Dividend Equity ETF | 3.5% | 8.5% | 12.0% | 8.4% | 6.0% | 11.9 | 1.80 |
| Dividend Aristocrats | 2.6% | 8.5% | 11.1% | 7.8% | 5.4% | 13.2 | 1.70 |
| S&P 500 | 1.7% | 8.5% | 10.2% | 7.1% | 4.8% | 15.0 | 1.60 |
(Sources: DK Research Terminal, FactSet, Morningstar, YCharts)
TXN has historically delivered 14% returns and analysts expect 13% in the future. That’s better than just about every popular ETF you can buy, including the Nasdaq.
Why Analysts Are Bullish On TXN And You Should Be Too
Few companies in the world spend shareholder money better than TXN.
investor presentation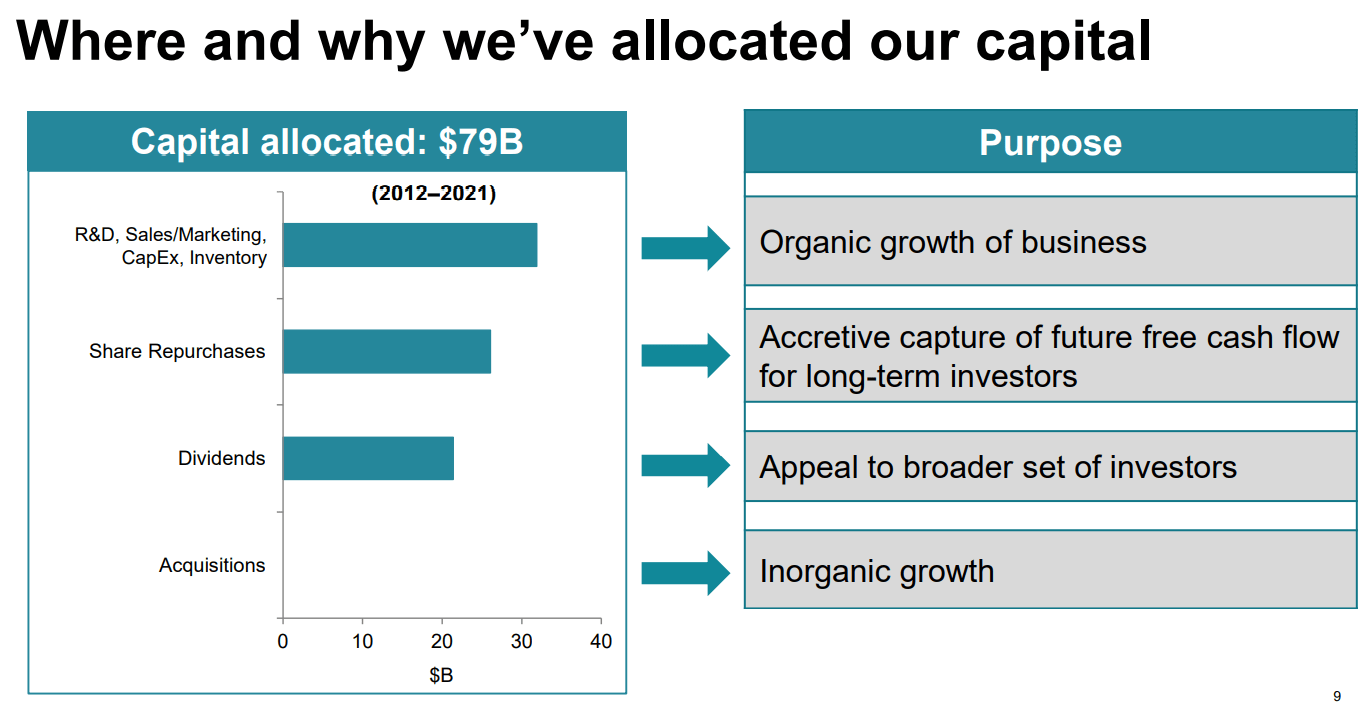
In the last decade they’ve wisely invested in growing the business first, and then showering investors with buybacks and dividends.
investor presentation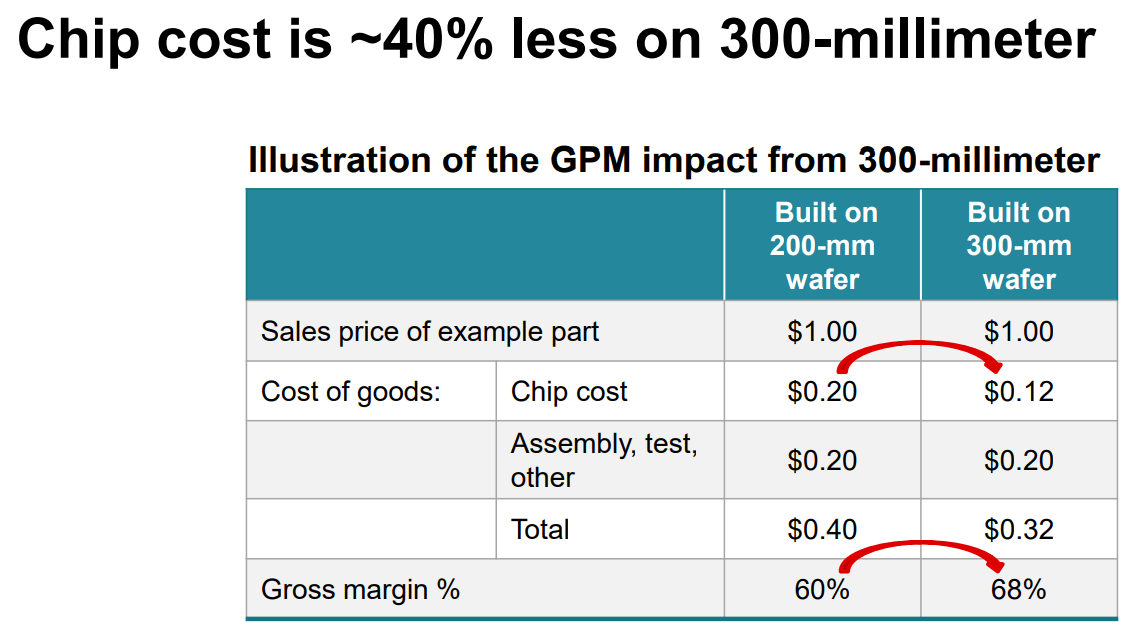
TXN isn’t focused on the bleeding edge of technology, they specialize in larger and cheaper analog chips.
- the kind you find in cars
Dailys Shot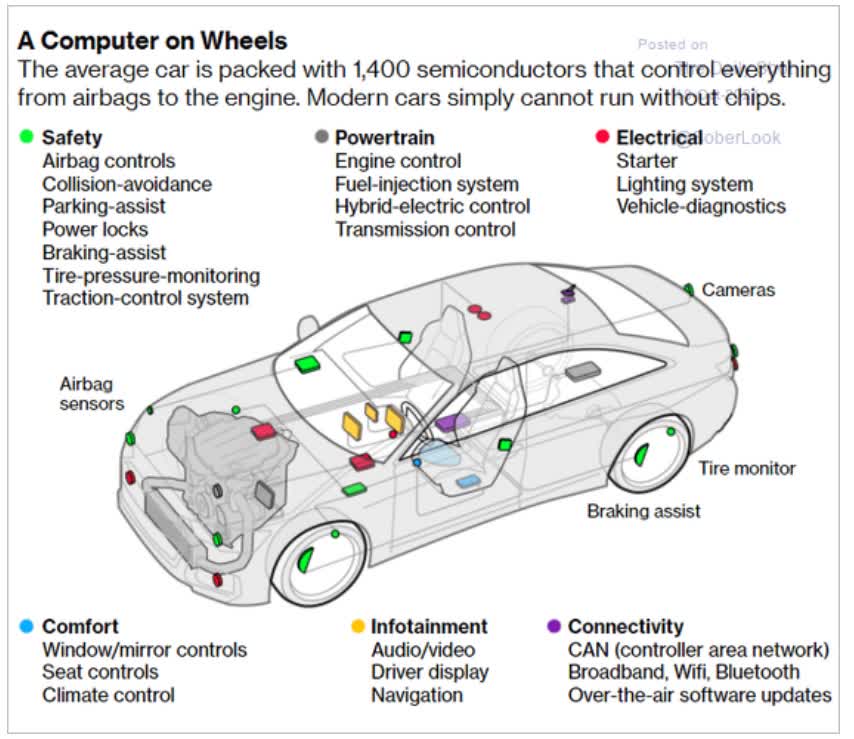
The average car has 1,400 chips in it, and TXN is the industry leader.
- electric cars average close to 3,000 chips
Reliability is the top concern for its clients, and TXN’s chip plants are able to offer great value to customers, while also maximizing its own margins.
investor presentation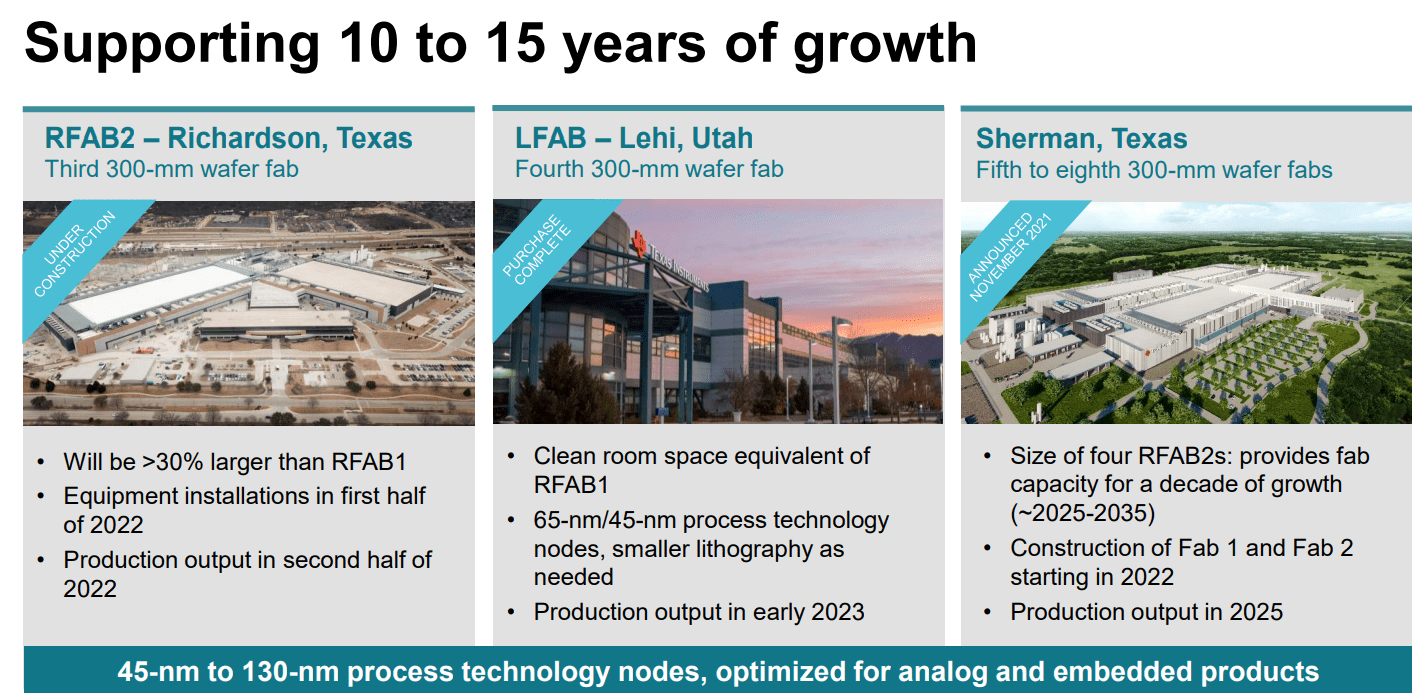
TXN is spending almost $11 billion over the next three years building out three new chip factories.
- at approximately 1/4th the cost of cutting edge chip plants
investor presentation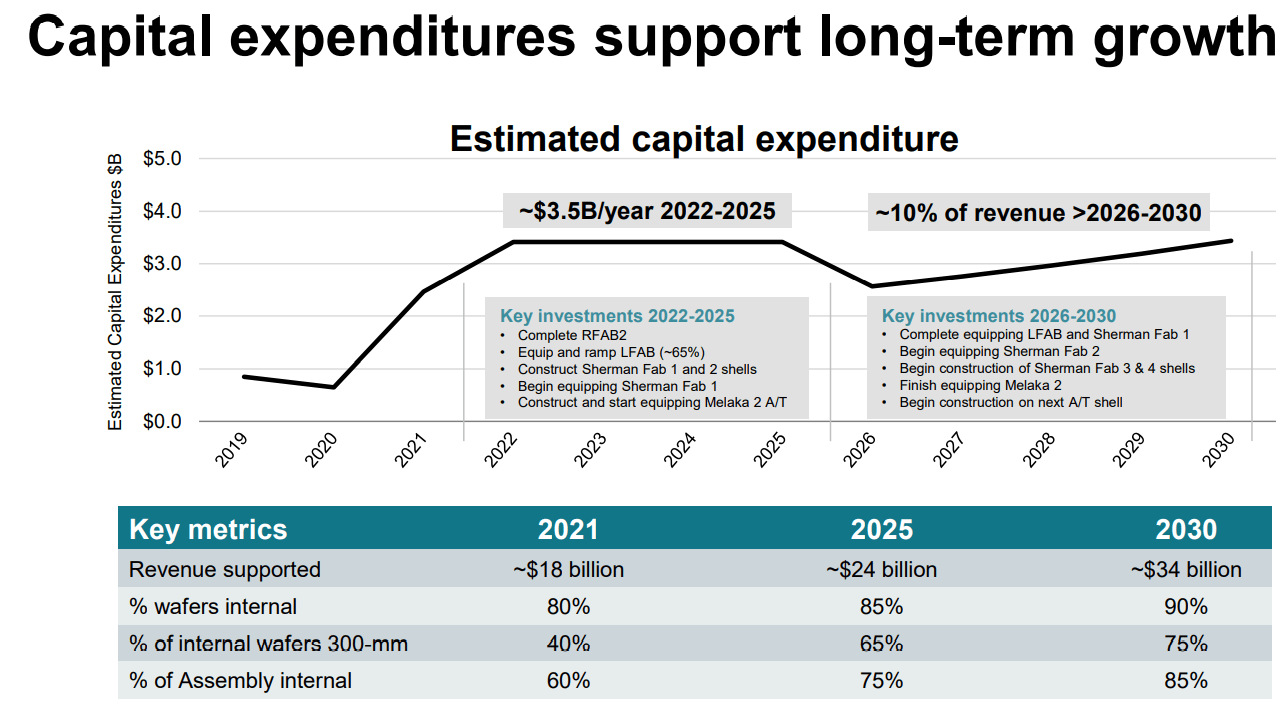
That’s the benefits of specializing in analog chips that don’t need to be cutting edge.
investor presentation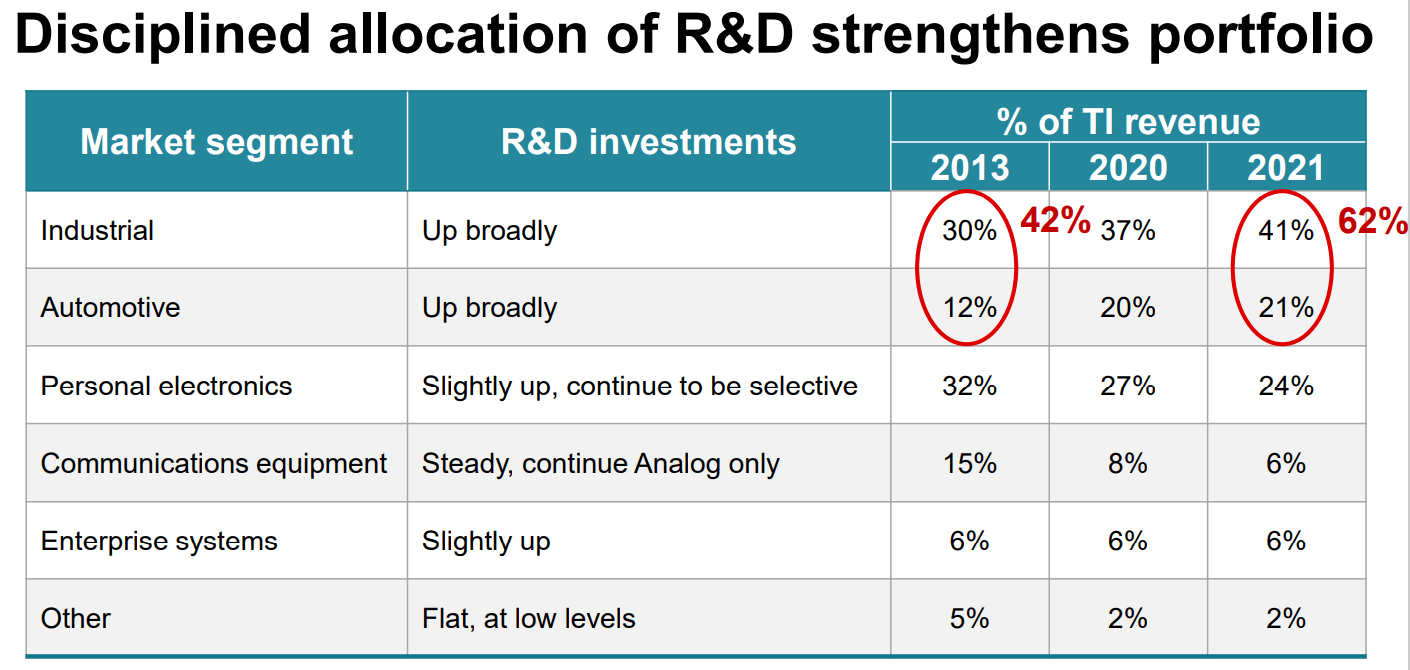
TXN’s R&D efficiency is exceptional and continues to get better over time.
Shareholders can be confident that TXN’s $1.7 billion in annual R&D spending is being put to productive uses.
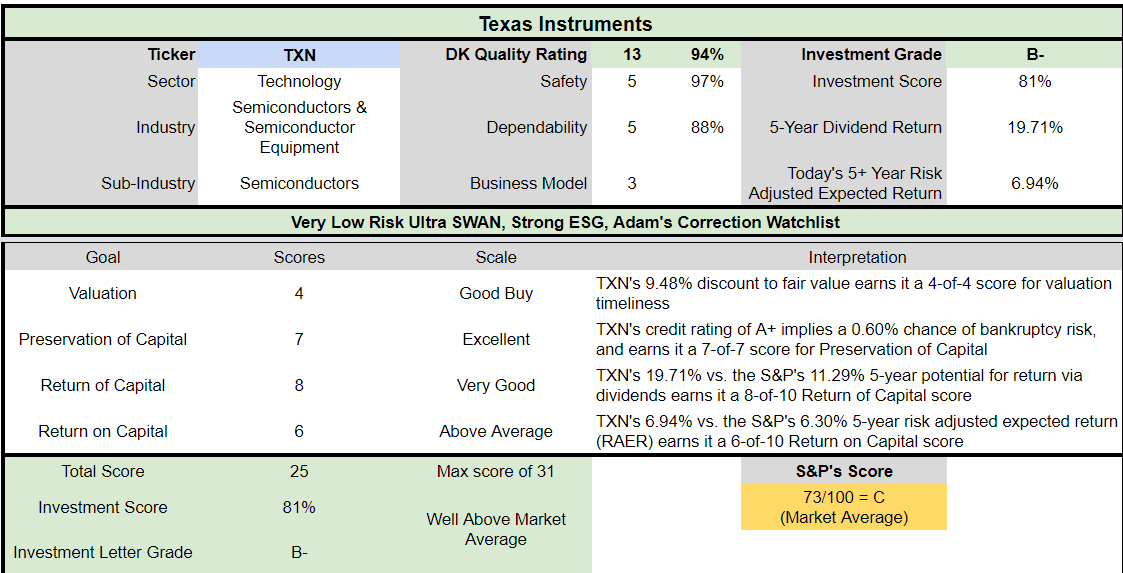
Valuation: A Wonderful Company At A Fair Price
- quality: 94% very low risk 13/13 Ultra SWAN (sleep well at night) chip maker
- fair value: $190.84
- current price: $172.98
- discount to fair value: 9%
- DK rating: potential good buy
TXN 2024 Consensus Total Return Potential
(Source: FAST Graphs, FactSet)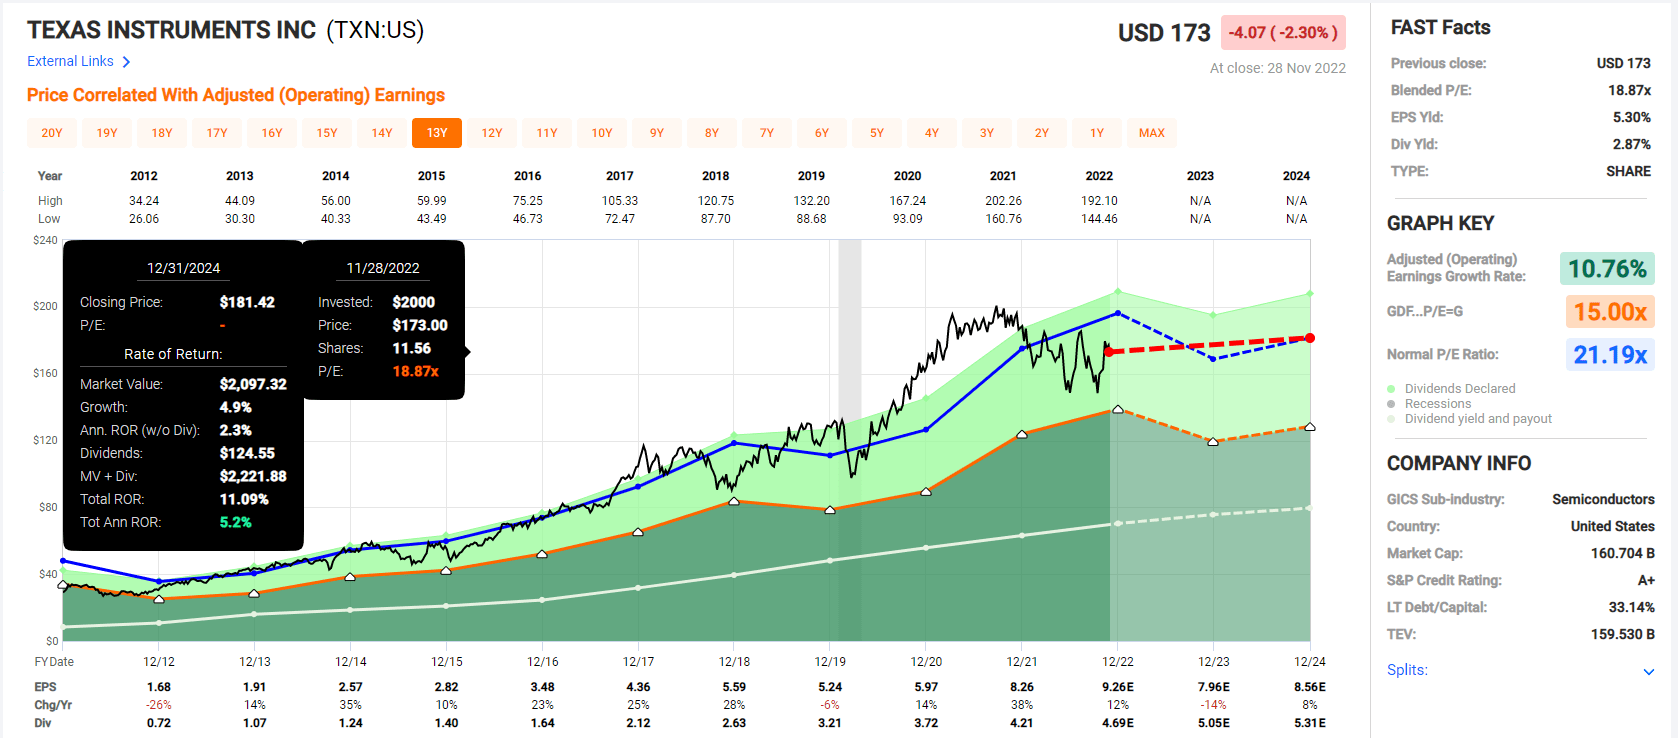
TXN’s 2023 results are expected to take a hit due to the global recession, though it’s still expected to generate positive returns over the next few years.
TXN 2028 Consensus Total Return Potential
(Source: FAST Graphs, FactSet)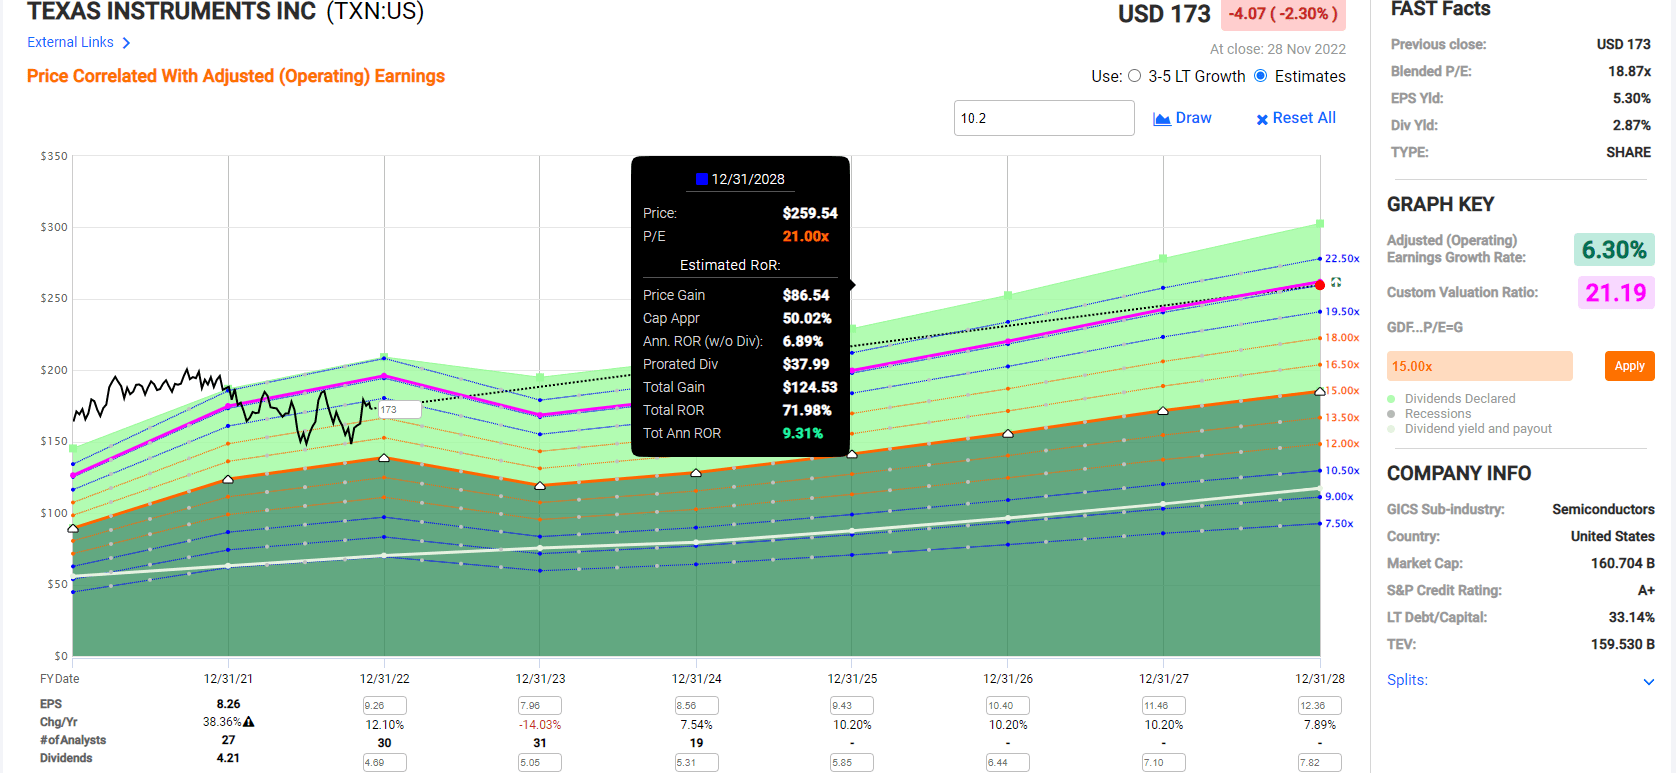
TXN’s consensus return potential over the next five years is a decent 9% annually, slightly better than the S&P 500’s 8%.
TXN Investment Decision Tool
DK Dividend Kings Automated Investment Decision Tool
TXN is a potentially reasonable fast-growing Ultra SWAN opportunity for anyone comfortable with its risk profile. Look at how it compares to the S&P 500.
- 10% discount to fair value vs. 2% premium S&P = 12% better valuation
- 2.8% very safe yield vs. 1.7% (faster-growing and much safer)
- approximately 13% long-term annual return potential vs. 10.2% CAGR S&P
- 2X higher income potential over five years
| Rating | Margin Of Safety For Very Low Risk 13/13 Ultra SWAN Quality Companies | 2022 Fair Value Price | 2023 Fair Value Price |
12-Month Forward Fair Value |
| Potentially Reasonable Buy | 0% | $190.84 | $190.84 | $190.84 |
| Potentially Good Buy | 5% | $181.30 | $181.30 | $181.30 |
| Potentially Strong Buy | 15% | $162.22 | $162.22 | $162.22 |
| Potentially Very Strong Buy | 25% | $135.98 | $143.13 | $143.13 |
| Potentially Ultra-Value Buy | 35% | $124.05 | $124.05 | $124.05 |
| Currently | $172.66 | 9.53% | 9.53% | 9.53% |
| Upside To Fair Value (Including Dividends) | 13.40% | 13.40% | 13.40% |
For anyone comfortable with its risk profile, TXN is a potentially good buy. If the market sells off as analysts expect in 2023 it could become a potentially strong buy or very strong buy.
Broadcom: The Utility Of The Chip Industry
Broadcom isn’t as high quality as TXN.
- 83% medium-risk 12/13 Super SWAN quality
FactSet Research Terminal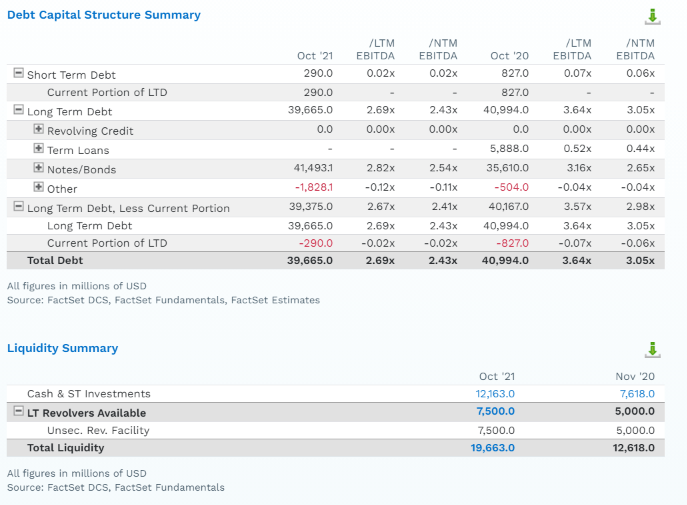
That’s mainly due to its more aggressive leverage courtesy of management’s brilliant though riskier approach to driving growth.
(Source: investor presentation)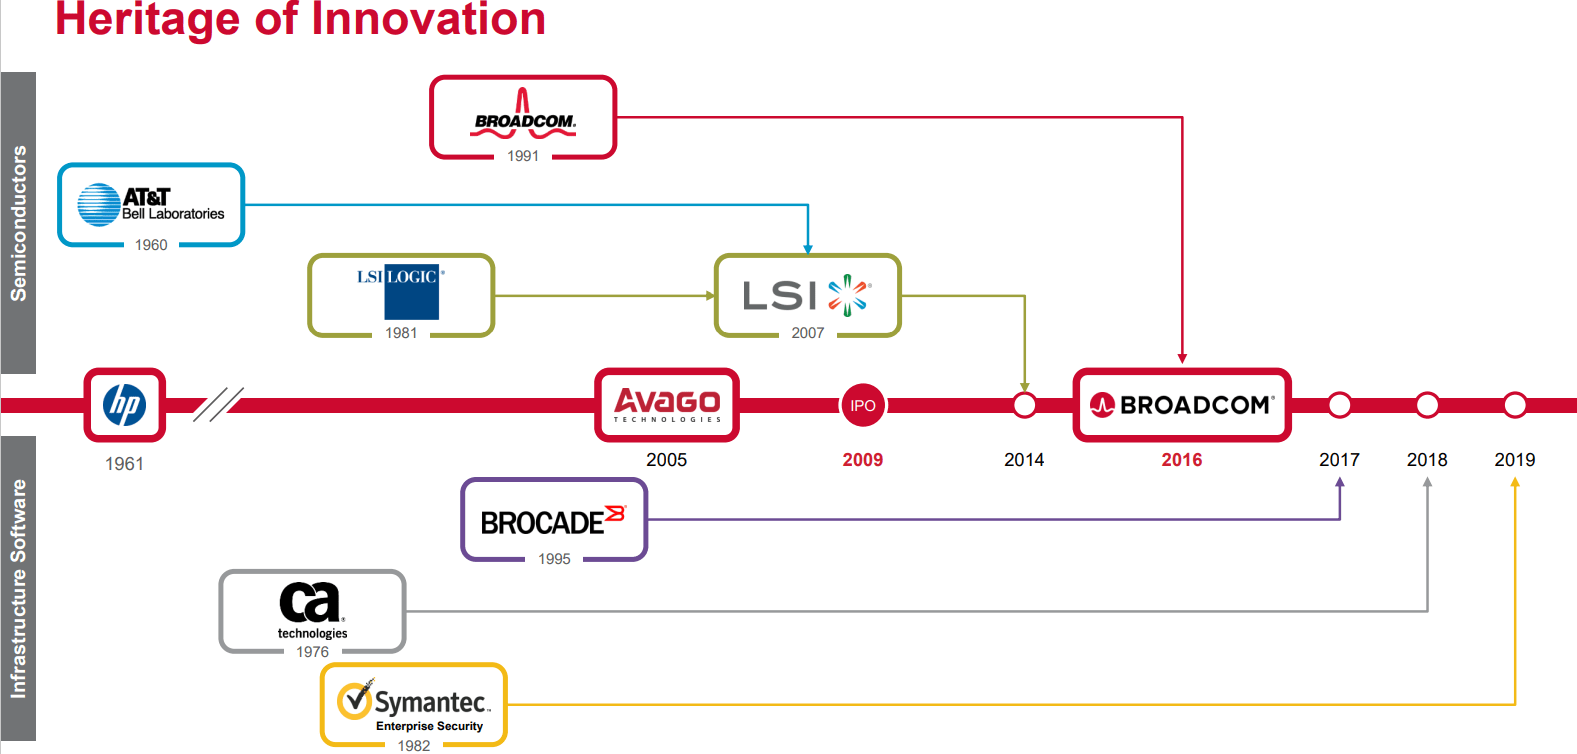
Broadcom has built an empire that includes chips and enterprise software, with a wide and stable moat protected by over 19,000 patents and almost $5 billion in annual R&D spending.
VMWare (NYSE:VMW): AVGO’s Biggest Acquisition Yet
AVGO plans to close on its $61 billion acquisition of VMW next year, and it’s a brilliant move.
(Source: investor presentation)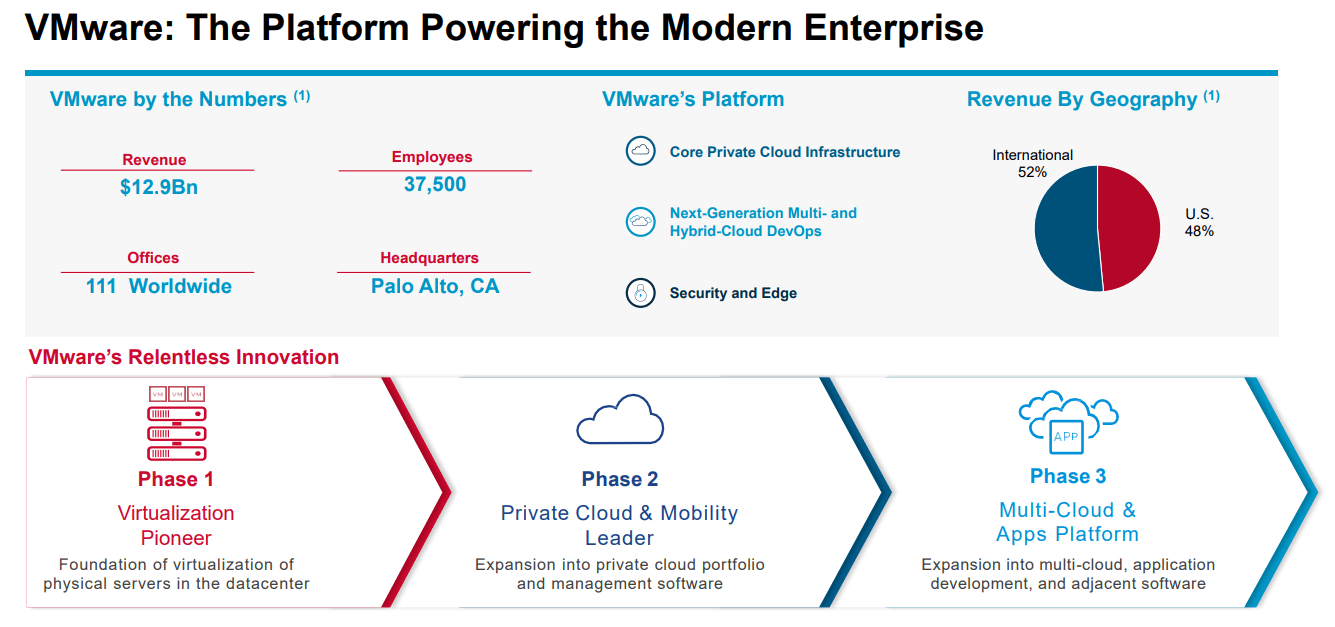
After the deal closes, 49% of sales at AVGO will be from recurring revenue infrastructure software – the most stable cash flow in the industry.
That’s why S&P has upgraded AVGO to BBB- positive outlook, despite AVGO taking on $32 billion in additional debt to fund this deal.
VMWare’s roughly $13 billion of revenue will significantly shift Broadcom’s business mix away from semiconductors, bringing the share of sales from infrastructure software to roughly half of the pro-forma total. We view this transition as improving the risk profile of Broadcom’s business, as the firm’s software segment benefits from significant recurring revenues, entrenched customer relationships in mature markets, and strong share in core product markets. – S&P
Effectively, AVGO is becoming the utility of the chip industry. The more stable the cash flow the safer the business and the higher the PE the market tends to give it.
(Source: investor presentation)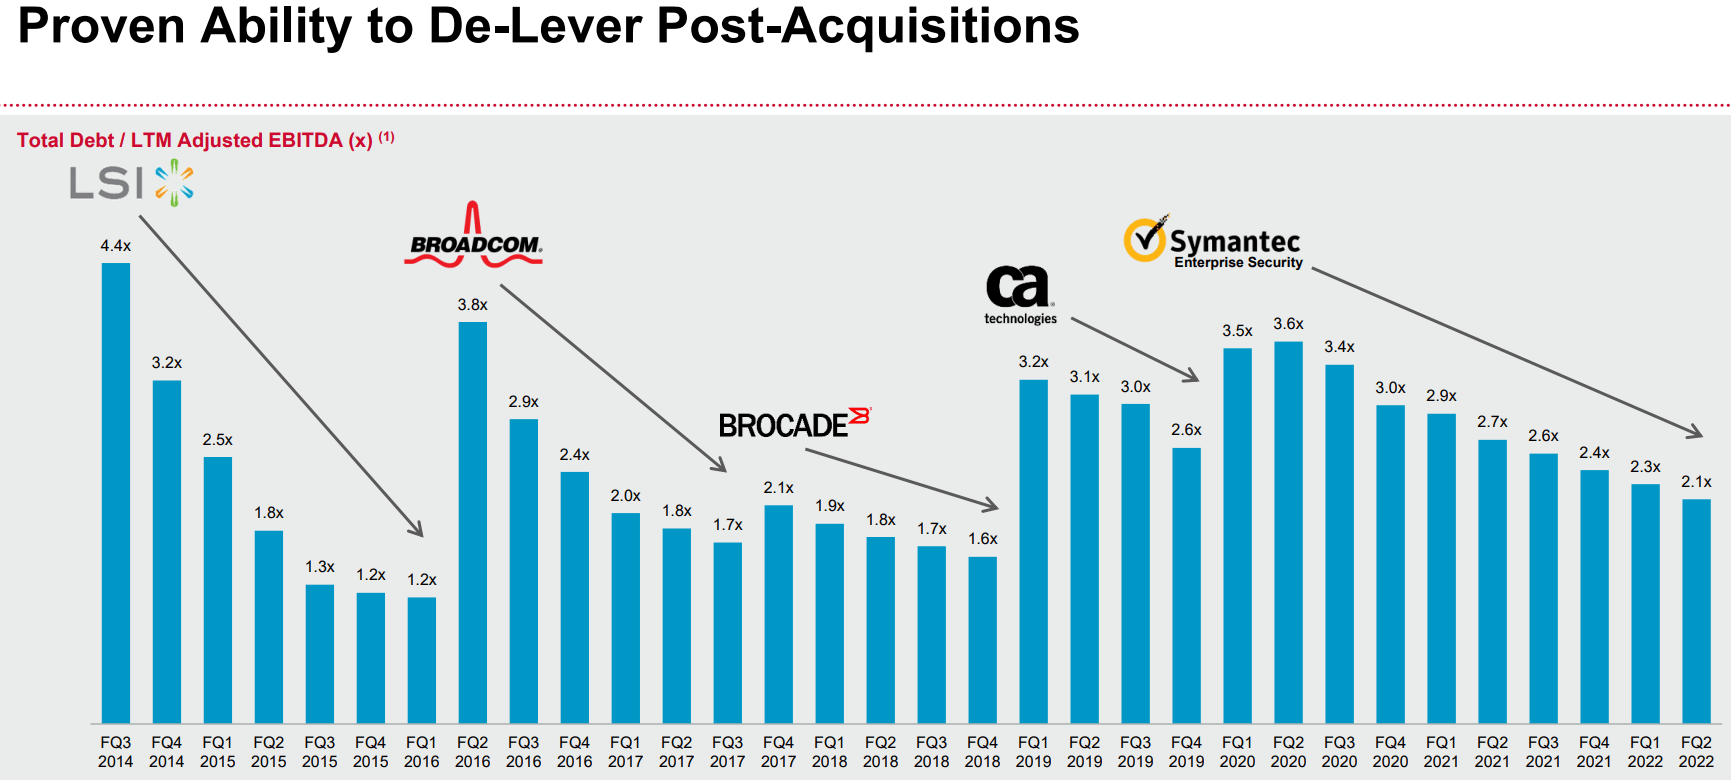
Hock Tan, CEO of AVGO, is a master of M&A, the Warren Buffett of this industry.
In the hands of a lesser executive, AVGO could have floundered with dangerous levels of debt. Instead, it’s managed to become one of the best dividend growth blue-chips of the last six years.
(Source: investor presentation)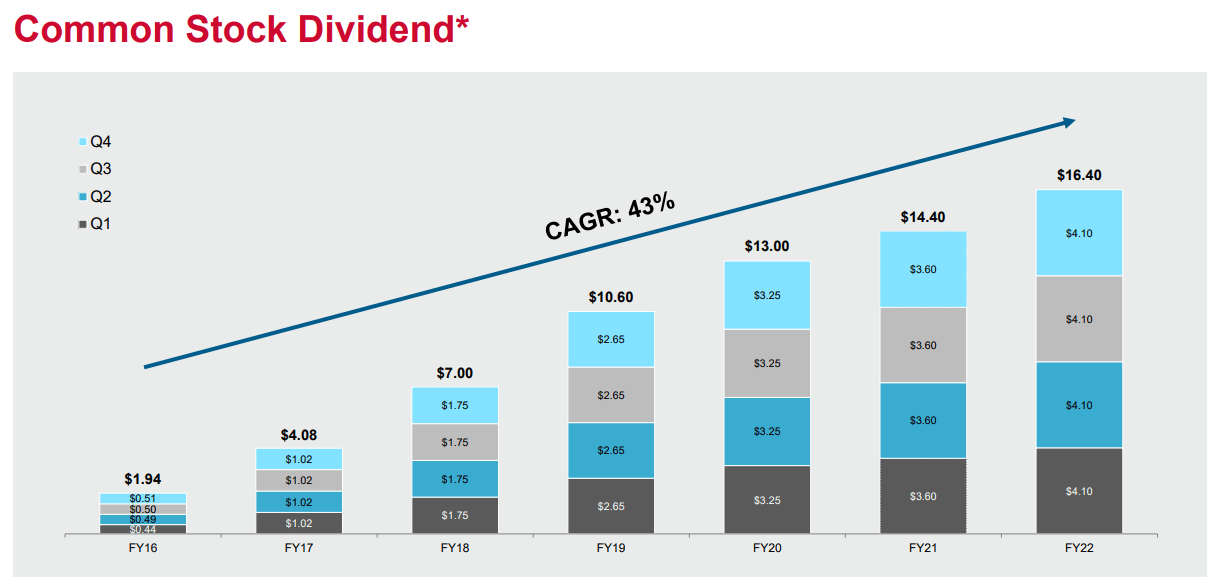
And what about VMWare? How does the largest deal in AVGO’s history change the safety of the dividend?
(Source: investor presentation)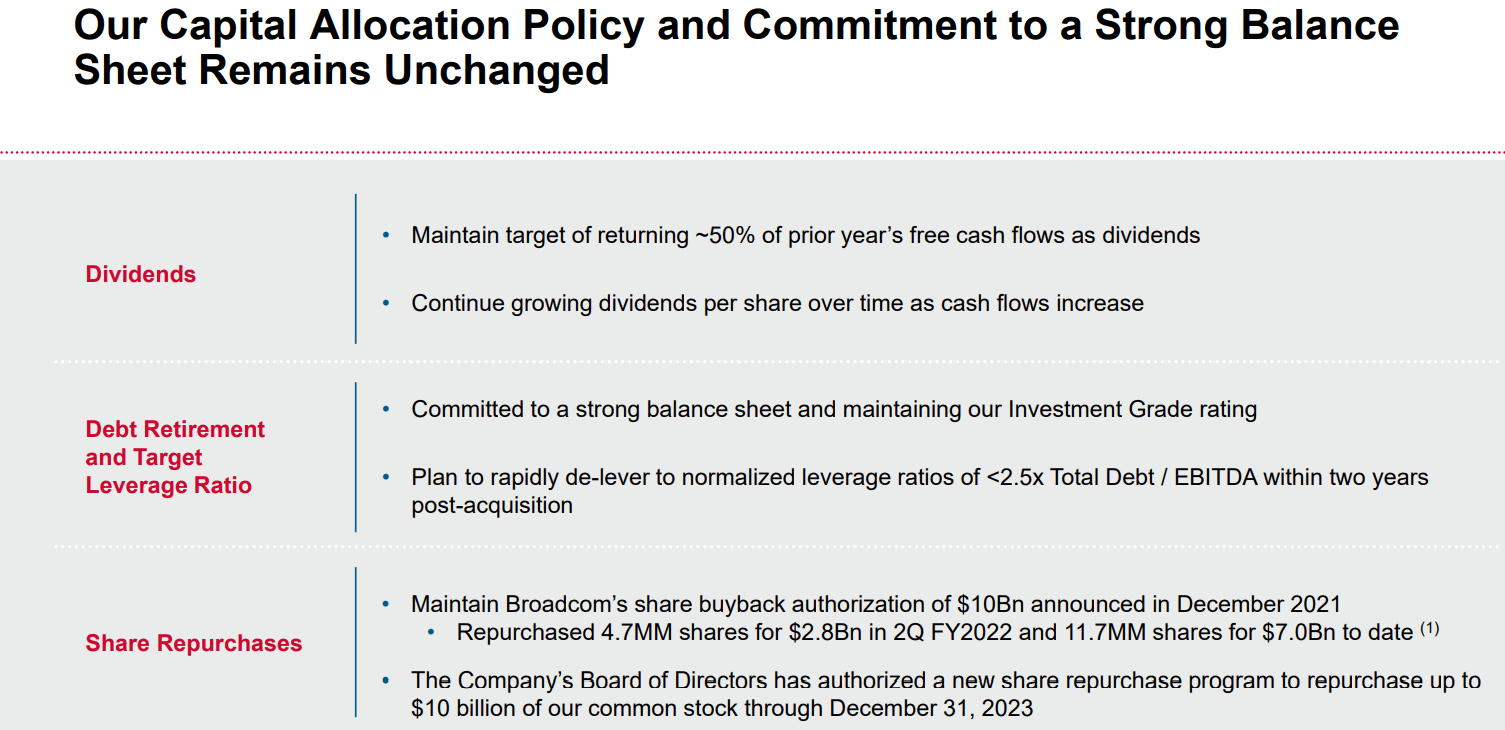
It doesn’t, because management plans to keep paying 50% of FCF as dividends and is committed to a BBB- investment grade balance sheet.
Rating agencies have already blessed the deal and the company’s plans to deleverage rapidly in the coming years.
But unlike with the last two acquisitions, AVGO’s free cash flow is now large enough to maintain a buyback program. The company just authorized a brand new $10 billion buyback program that runs through the end of next year.
FactSet Research Terminal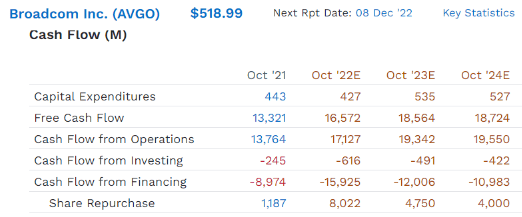
AVGO’s free cash flow is expected to reach almost $19 billion in 2024, allowing it to rapidly pay down debt, fund a dividend growing at 9% annually over the next two years, AND buyback almost $9 billion in stock.
YCharts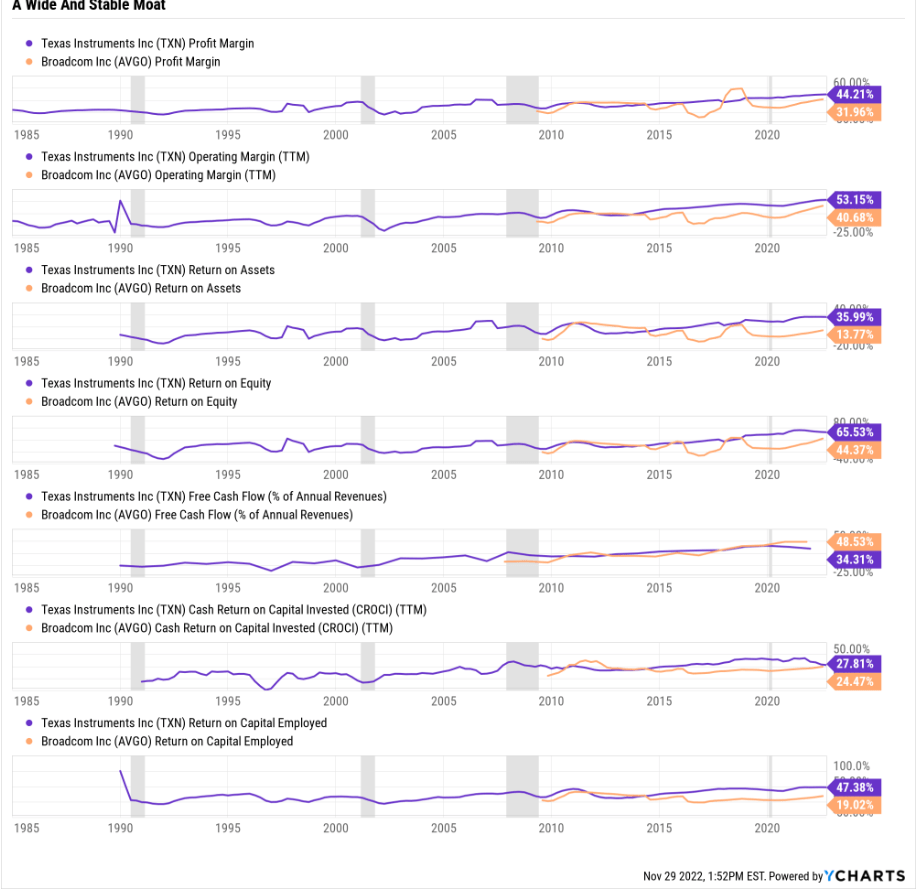
AVGO’s FCF margins put even TXN to shame. Almost 50% of every dollar that comes in drops straight to the bottom line.
- because AVGO is a very capital light business
- and its software businesses mint free cash and that’s soon going to be 50% of sales
How high can AVGO’s FCF margins climb?
- 2024 FCF consensus margin: 51%
- top 1% of all companies on earth
Broadcom proves that you can have it all, a generous safe and rapidly growing yield, as well as growth good enough to make grown men weep with joy.
How good?
FactSet Research Terminal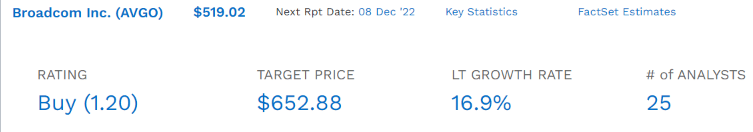
AVGO remains a hyper-growth dividend blue-chip and one that yields slightly more than TXN.
Consensus Total Return Potential: Ignoring Valuation
| Investment Strategy | Yield | LT Consensus Growth | LT Consensus Total Return Potential | Long-Term Risk-Adjusted Expected Return | Long-Term Inflation And Risk-Adjusted Expected Returns | Years To Double Your Inflation & Risk-Adjusted Wealth |
10-Year Inflation And Risk-Adjusted Expected Return |
| Broadcom | 3.1% | 16.9% | 20.0% | 14.0% | 11.7% | 6.2 | 3.02 |
| Texas Instruments | 2.9% | 10.2% | 13.1% | 9.2% | 6.8% | 10.5 | 1.94 |
| Nasdaq | 0.8% | 11.8% | 12.6% | 8.8% | 6.5% | 11.0 | 1.88 |
| Schwab US Dividend Equity ETF | 3.5% | 8.5% | 12.0% | 8.4% | 6.0% | 11.9 | 1.80 |
| Dividend Aristocrats | 2.6% | 8.5% | 11.1% | 7.8% | 5.4% | 13.2 | 1.70 |
| S&P 500 | 1.7% | 8.5% | 10.2% | 7.1% | 4.8% | 15.0 | 1.60 |
(Source: DK Research Terminal, FactSet, Morningstar, YCharts)
That means potentially Buffett-like 20% annual returns for years to come.
Total Returns Since September 2009
Portfolio Visualizer Premium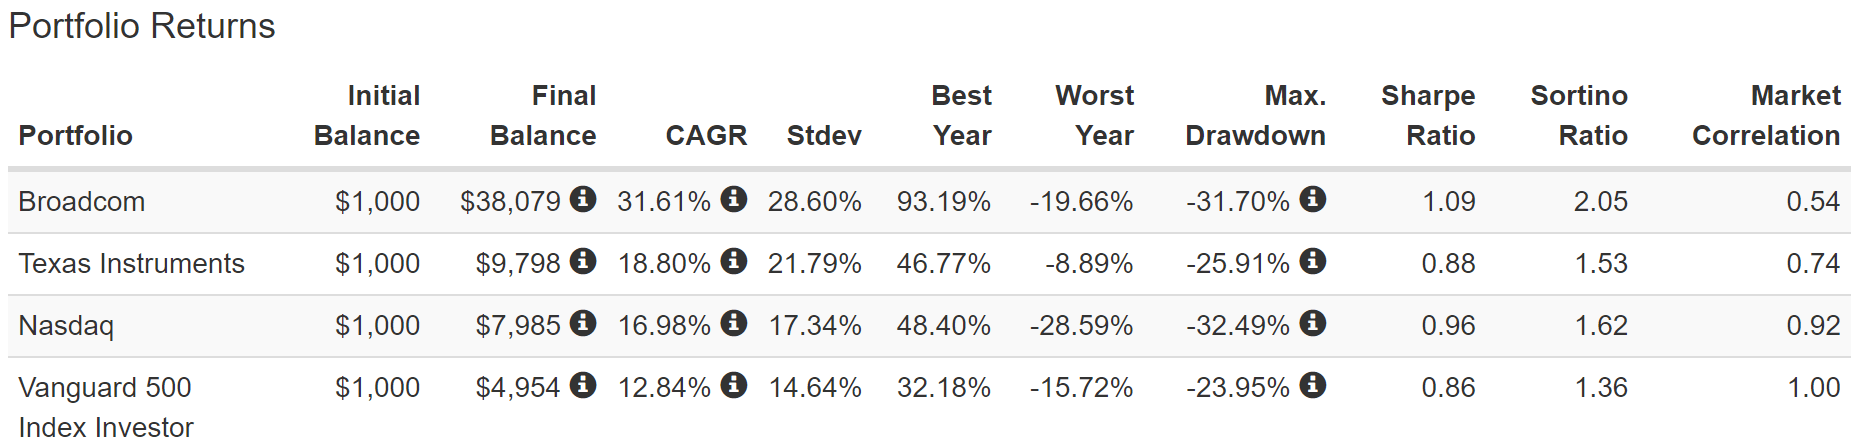
Given AVGO’s exceptional management and M&A prowess, as well as its numerous growth catalysts, I consider that a reasonable consensus forecast.
AVGO gets 25% of sales from smartphones and is trying to diversify into all the best growth opportunities in tech.
- infrastructure software
- cloud computing
- AI
- 5G
- automation
Valuation: A Wonderful Company At A Fair Price
- quality: 83% medium risk 12/13 Super SWAN (sleep well at night) chip maker
- fair value: $604.59
- current price: $522.31
- discount to fair value: 14%
- DK rating: potential good buy
Broadcom 2024 Consensus Total Return Potential
(Source: FAST Graphs, FactSet)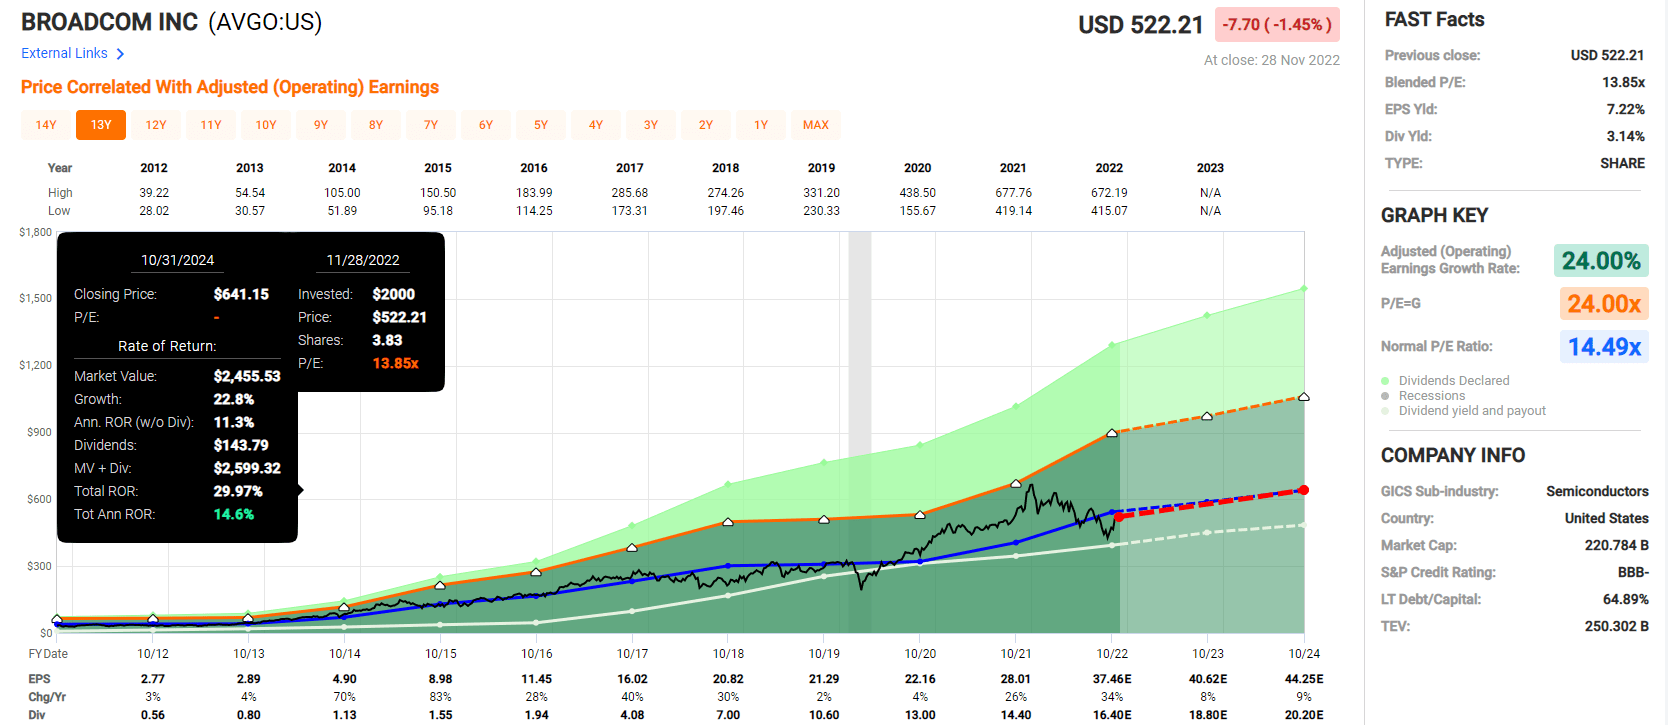
AVGO offers a solid 15% annual return potential through the end of 2024.
Broadcom 2028 Consensus Total Return Potential
(Source: FAST Graphs, FactSet)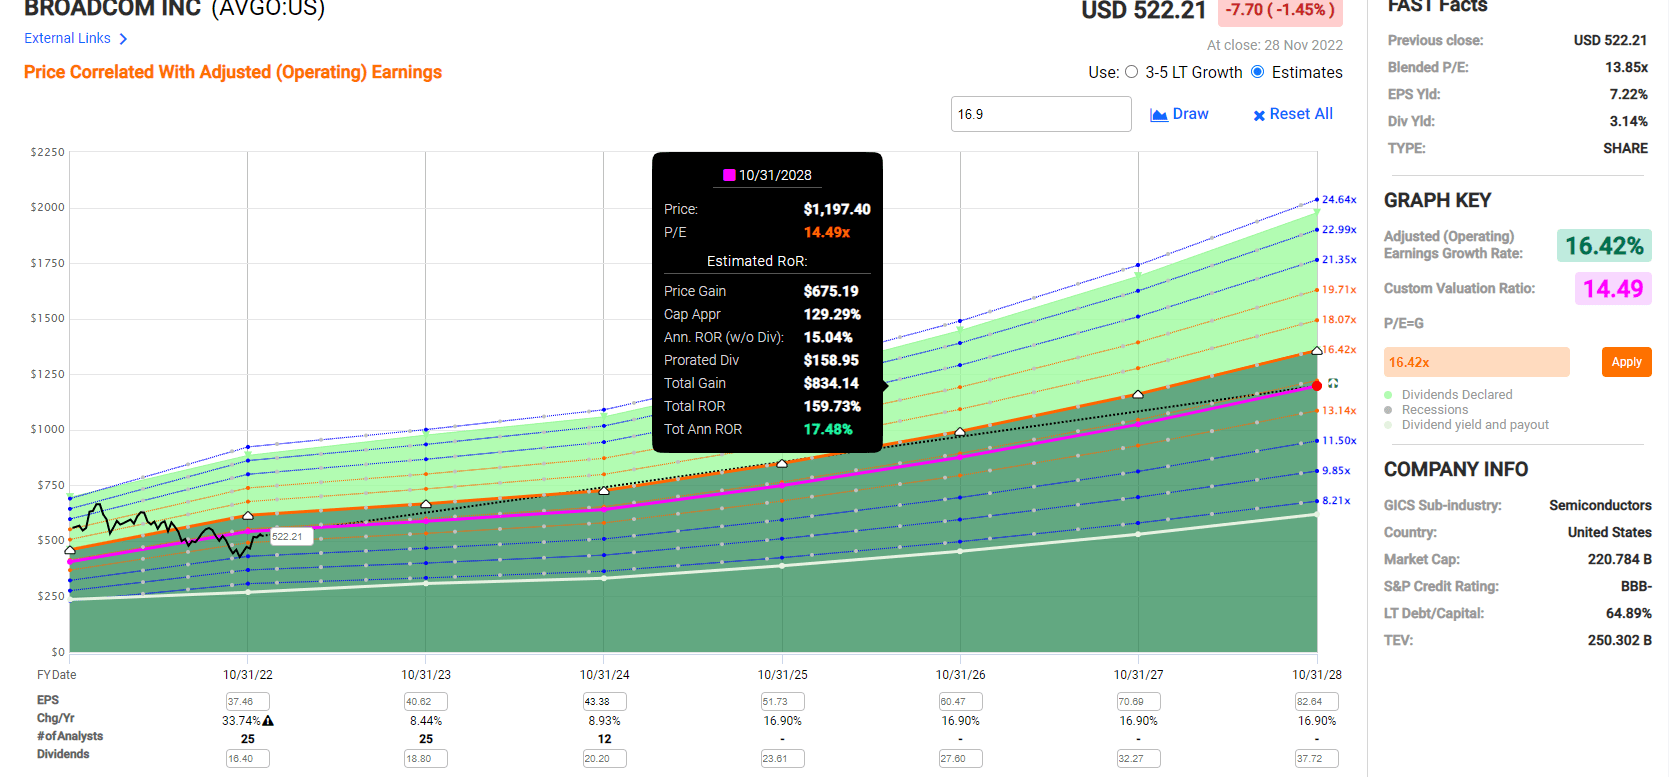
AVGO offers 160% total return potential through 2028, a solid 18% annual returns that’s approximately 3X better than the S&P 500.
AVGO Investment Decision Tool
DK Automated Investment Decision Tool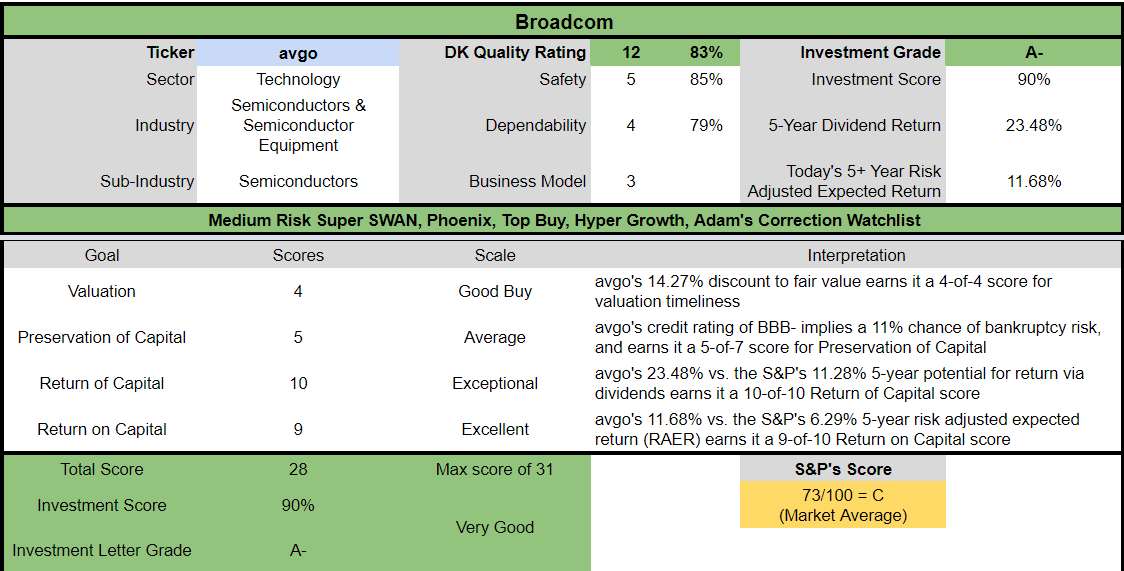
AVGO is a very good fast-growing high-yield blue-chip opportunity for anyone comfortable with its risk profile. Look at how it compares to the S&P 500.
- 14% discount to fair value vs. 2% premium S&P = 16% better valuation
- 3.1% very safe yield vs. 1.7% (2X the yield, faster-growing and much safer)
- approximately 20% long-term annual return potential vs. 10.2% CAGR S&P
- 2.5X higher income potential over five years
| Rating | Margin Of Safety For Medium Risk 12/13 Super SWAN Quality Companies | 2022 Fair Value Price | 2023 Fair Value Price |
12-Month Forward Fair Value |
| Potentially Reasonable Buy | 0% | $562.53 | $607.16 | $604.59 |
| Potentially Good Buy | 10% | $506.27 | $546.45 | $544.13 |
| Potentially Strong Buy | 20% | $450.02 | $485.73 | $483.67 |
| Potentially Very Strong Buy | 30% | $354.39 | $425.01 | $423.21 |
| Potentially Ultra-Value Buy | 40% | $337.52 | $364.30 | $362.75 |
| Currently | $522.31 | 7.15% | 13.98% | 13.61% |
| Upside To Fair Value (Including Dividends) | 10.84% | 19.39% | 18.89% |
For anyone comfortable with its risk profile, AVGO is a potentially good buy. If the market sells off as analysts expect in 2023 it could become a potentially strong buy or very strong buy.
Bottom Line: Be Ready To Buy Broadcom And Texas Instruments With Both Hands In The Next Few Months
I can’t tell you exactly when or where the market will bottom, but the economic fundamentals, blue-chip consensus, and market history all point to a likely bear market bottom in the first half of 2023.
- 17% to 28% lower than we are now
Individual blue-chips will bottom at different times and prices, and that’s why it’s a good idea to have a watchlist of world-beater dividend blue-chips ready.
By knowing any blue-chips historical market-determined fair value, and applying a reasonable margin of safety based on a company’s quality and risk profile, we can make reasonable and prudent decisions.
That’s how we beat the recession, bear market, and come out the other side richer, happier, and on track to achieve our retirement dreams.
When it comes to world-beater dividend blue-chips, it’s tough to beat TXN and AVGO, two of the greatest chip makers.
Both are free cash flow minting machines, and both are growing at double-digits.
Both are led by brilliant management teams, with capital allocation skills that put their rivals to shame.
TXN is the 2nd highest quality chip maker on earth, with ideal capital allocation, super efficient R&D and a wide moat niche that is expected to drive 13% long-term returns.
AVGO offers superior yield, growth, and a utility like business model that will soon be getting 50% of sales from recurring software revenue.
With a slightly better valuation and much better medium-term return potential, AVGO is the better buy today. But come the new year, and a likely nasty Q1 earnings season, be ready to buy both TXN and AVGO with both hands.
- Q1 will bring 2023 guidance and every company is likely to offer very conservative guidance
While I can’t pinpoint the exact day the market bottoms, what I can tell you is that if you buy these blue-chips during this recession, you’re very likely to be happy with the result in 5+ years.
And in 10+ years, you’ll likely feel like a stock market genius, who stayed calm, sane, and safe during the 2022 bear market.
That’s my goal, my passion, and mission in life – to help regular people, like you, find the best blue-chip bargains in the most terrifying market times.
That way, you can put the world’s best management teams to work for you, so one day you won’t have to.
Be the first to comment