

Bitcoin (BTC/USD) Outlook:
US Politics Fuel Bitcoin Rally
Bitcoin has continued on its upward protectory as political factors have continued to fuel the recent breakout. Although a number of fundamental factors have weighed on the greenback, the major event that overshadowed the US senate vote was the protests that took place in Washington DC, where rioters forced their way into the Capitol building where the electoral votes were being held, resulting in four fatalities. This helped to push that bullish breakout in Bitcoin to even higher-highs, and the door may remain open for more.

Recommended by Tammy Da Costa
Can you trade the news?
As reports of the event filtered through the market, BTC/USDprice action gained momentum, fueling the bullish breakout that has seen Bitcoin prices soaring over 30% (MTD). As a result, Bitcoin was once again able to reach a new record high, breaking above previous resistance.
Bitcoin (BTC/USD) Technical Analysis
The Bitcoin ‘bubble’ that burst in 2018 appears to be a distant memory as the demand for major cryptocurrencies continues to increase, almost presenting a safe-haven type of appeal. While the majority of 2020 was relatively flat for cryptocurrencies, the adoption of Bitcoin by PayPal as a valid payment method in late October, resulted in renewed hope for the virtual currency. Now, after breaking above the 2017 high, bulls have managed to set a continued series of new highs, bringing the key psychological level of $40,000 into view.
Although the Relative Strength Index (RSI) indicates that BTC/USD is well above 70 and is currently considered to be overbought, the break above the Bollinger Band indicates that further advances cannot be ruled out. In addition, price action remains well above the 20 and 50 Day Moving Average (MA) which has previously helped to form an additional layer of support.

Recommended by Tammy Da Costa
Download Your free Bitcoin Trading Guide
If bulls are able to break above $40,000, the upward momentum may prevail, with $41,000 a next area of potential resistance.
For now, the 20-period Moving Average (the central line used in Bollinger Bands) continues to provide support potential at $27,727. If bears are able to drive prices back within the range of the Bollinger Band, price action may turn in favor of the bears.
Bitcoin (BTC/USD) Daily Chart

Chart prepared by Tammy Da Costa, IG
While fundamentals may play a role in determining the next big move, the release of Non-Farm Payrolls (NFP) tomorrow may pose as an additional driver of price action should unemployment data exceed expectations.
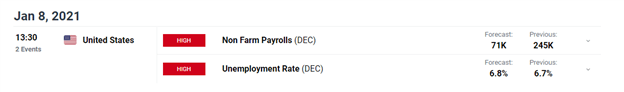
DailyFX, Economic Calendar
Bitcoin (BTC/USD) Sentiment

Recommended by Tammy Da Costa
How to read client sentiment
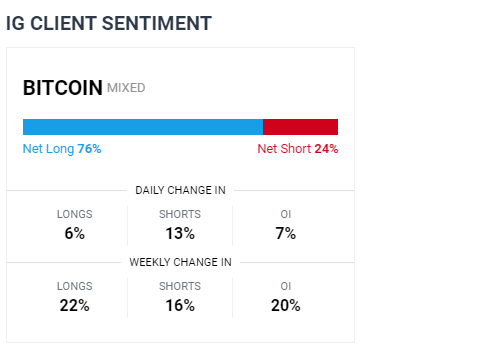
At the time of writing, Retail trader data shows 76.24% of traders are net-long with the ratio of traders long to short at 3.21 to 1. The number of traders net-long is 4.75% higher than yesterday and 20.73% higher from last week, while the number of traders net-short is 6.99% higher than yesterday and 13.59% higher from last week.
We typically take a contrarian view to crowd sentiment, and the fact traders are net-long suggests Bitcoin prices may continue to fall.However, positioning is less net-long than yesterday but more net-long from last week. The combination of current sentiment and recent changes gives us a further mixed Bitcoin trading bias.
— Written by Tammy Da Costa, Market Writer for DailyFX.com
Contact and follow Tammy on Twitter: @Tams707
Be the first to comment