


Grafissimo/E+ via Getty Images
Investment Thesis
The Boeing Company’s (NYSE:BA) growth has been decimated in the past three years, with little hope for recovery. As a result, its stock had plunged by -67.7%, from the all-time highs of $439.30 in February 2019 to the January 2014 level of $141.53 on 24 June 2022. Though recovery may be possible by FY2023 once BA reports net income and/ or FCF profitability, we are not so sure, given its massive debts and the macro issues delaying its future deliveries.
As a result, though current near-bottom prices may seem attractive, we prefer to wait it out a little, since a further retracement is possible, given the potential underperformance in the FQ2’22 earnings call at the end of July 2022.
BA Has Been In A Slump Since FY2019
BA Revenue, Net Income, Net Income Margin, and Gross Income
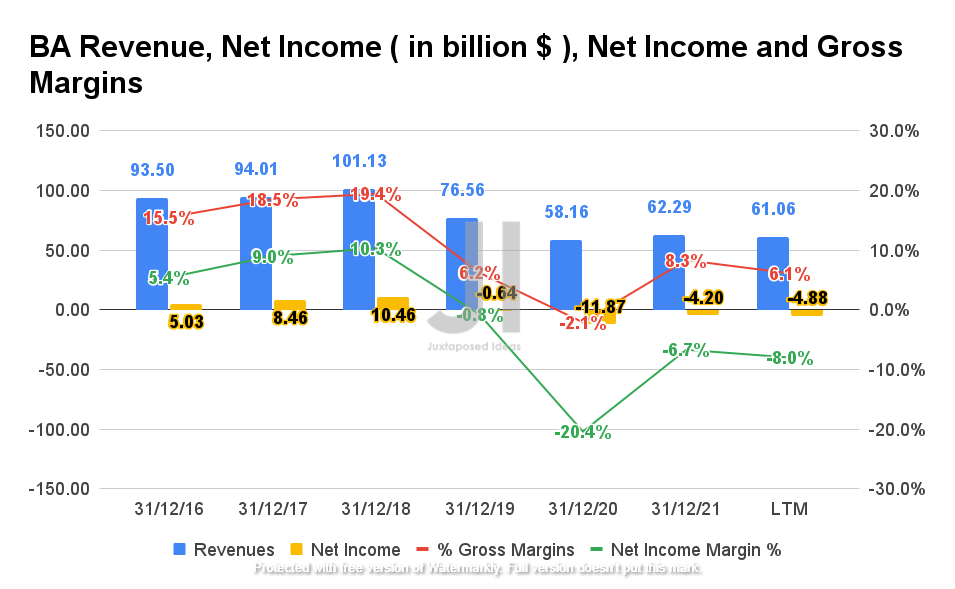
S&P Capital IQ
BA reported revenue of $61.06B and a gross margin of 6.1% in the LTM, representing a massive decline of -39.6% and -13.3 percentage points from FY2018, respectively. In addition, the company reported continuous net losses of -$4.88B and a net income margin of -8% in the LTM, representing a decline of -68.1% and 18.3 percentage points from FY2018, respectively. Given the slower reopening cadence and thus the unimpressive order book from the industry, we may expect FY2022 to be another under-performing year indeed.
BA Cash/ Equivalents, FCF, and FCF Margins
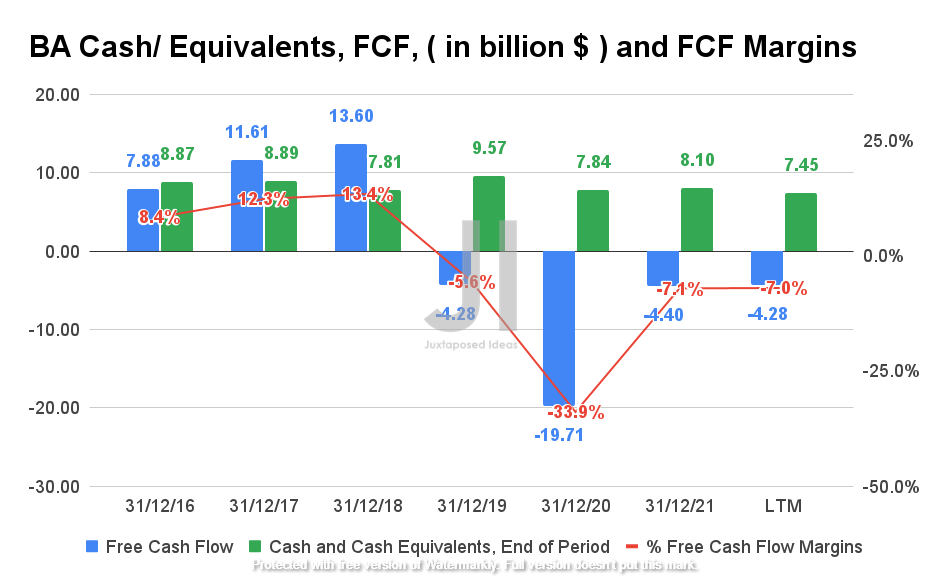
S&P Capital IQ
Therefore, given its impacted revenue growth and lack of net income profitability, it is no wonder that BA has been reporting negative Free Cash Flows (FCF) since FY2019. The company reported FCF of -$4.28B with FCF margins of -7%, representing a massive decline of -76% and -20.4 percentage points from FY2018, respectively. Though BA had beefed up its capital with the aid of growing debt leveraging, it is evident the temporary measure is unsustainable, given its declining cash and equivalents of $7.45 in the LTM.
BA Operating Expense
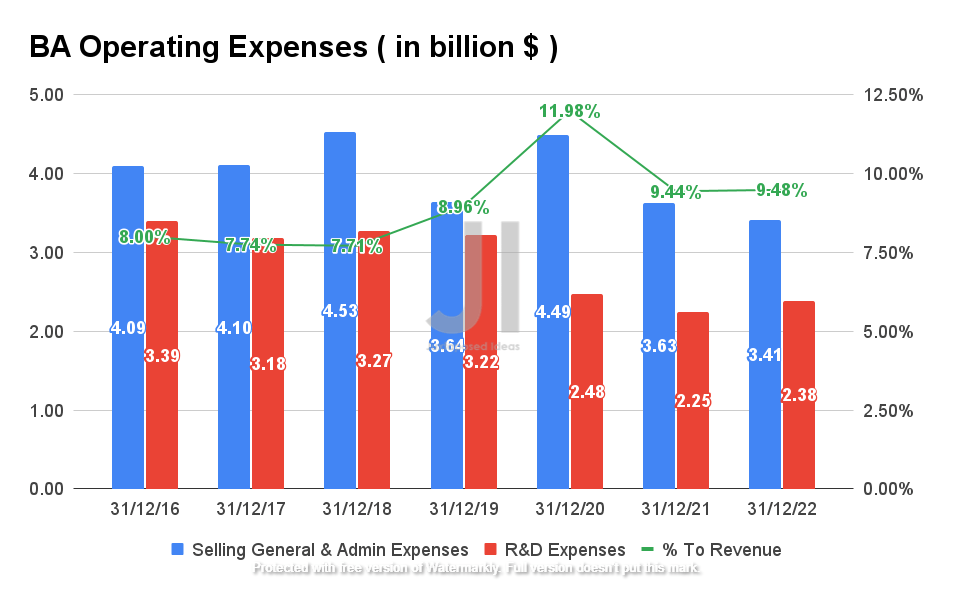
S&P Capital IQ
Despite the apparent moderation in BA’s R&D and SG&A expenses since FY2019, we have also observed an increasing impact on its operating expenses with regards to its falling revenue growth, at an elevated 9.48% in the LTM. The company reported $5.79B of operating expenses in the LTM, representing a decent -26.7% decline from FY2018 and -16.9% from its FY2020 levels.
BA Net PPE and Capex
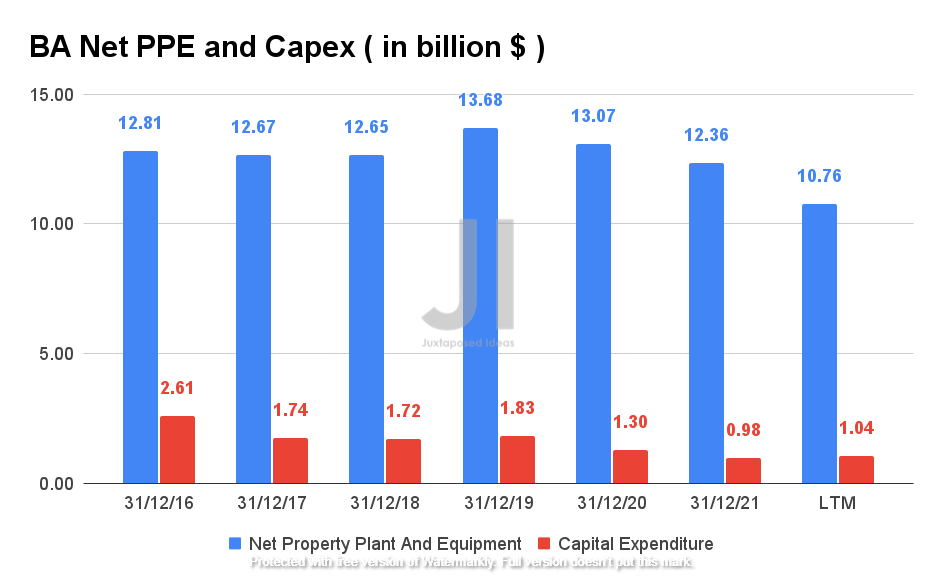
S&P Capital IQ
BA has also been divesting some of its assets, as observed from the declining Net Property, Plant, and Equipment, while reducing its Capex over time. By the LTM, the company reported $10.76B of net PPE and $1.04B of Capex, representing a -17.8% decline from both FY2018 and FY2020 levels. Therefore, it is clear that the BA management made commendable efforts to improve its operational efficiencies during the past three years. However, given its heavy Capex business, it is apparent that the company has also been struggling financially since FY2019.
BA Long-Term Debt and Share Dilution
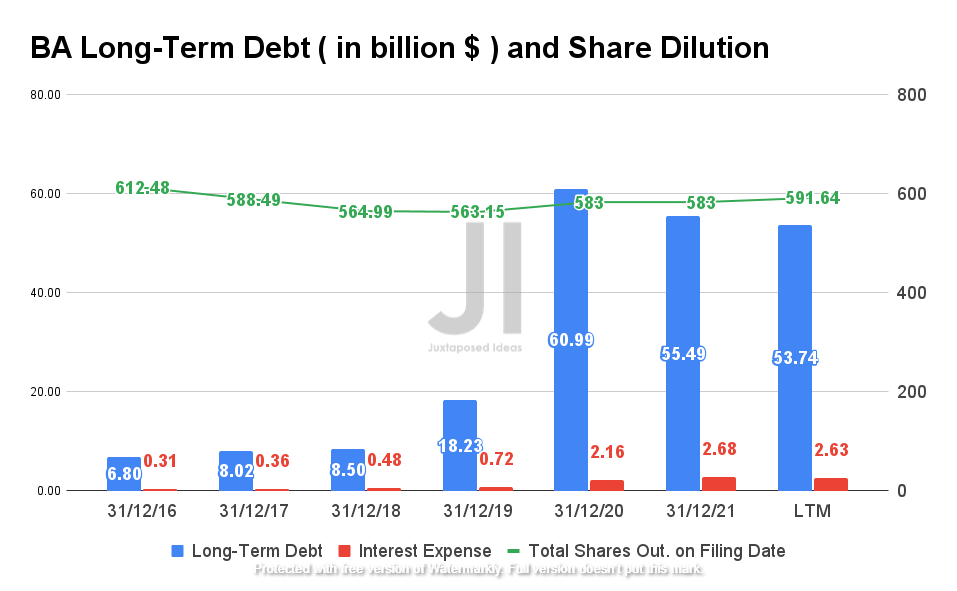
S&P Capital IQ
As a result, BA had been incurring massive debts in the past three years, at a sum of $53.74B in the LTM, representing a gargantuan increase of 632.2% from FY2018 and 294.7% from FY2019 levels. It is no surprise then that the company has a tremendous interest servicing expense of $2.63B in the LTM, representing 53.8% of its net losses and 61.4% of its negative FCF. Combined with its high operating costs and Capex at a total of $9.46B in the LTM, it is evident that BA would continue to rely on debt leveraging moving forward, given its diminishing cash and equivalents of $7.45B at the same time.
BA Projected Revenue and Net Income
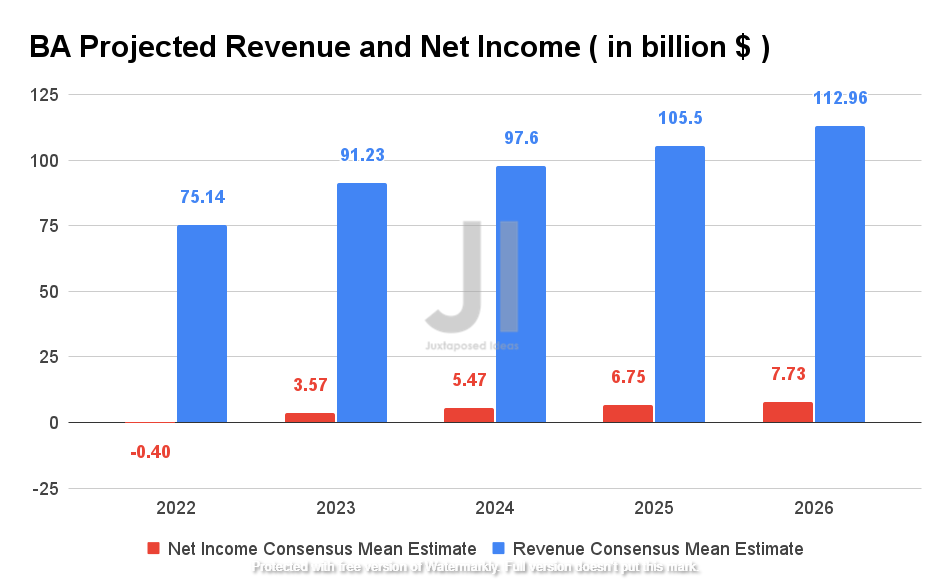
S&P Capital IQ
Over the next five years, BA is expected to report revenue growth at a CAGR of 12.65%, while also recovering to pre-pandemic revenue levels by FY2023. The company is also expected to report net income profitability by then, after four years of continuous losses. Nonetheless, consensus estimates that BA will report revenues of $75.14B and net income of -$0.4B, representing YoY growth of 20.64% and 90.47%, though still a massive decline of -25.69% and -2615% from FY2018 levels, respectively. Therefore, given its potentially growing debt, high operating expenses/ Capex, and lack of net income/ FCF profitability, it is unlikely that the BA stock will recover in the next few quarters.
So, Is BA Stock A Buy, Sell, or Hold?
BA 5Y EV/Revenue and P/E Valuations
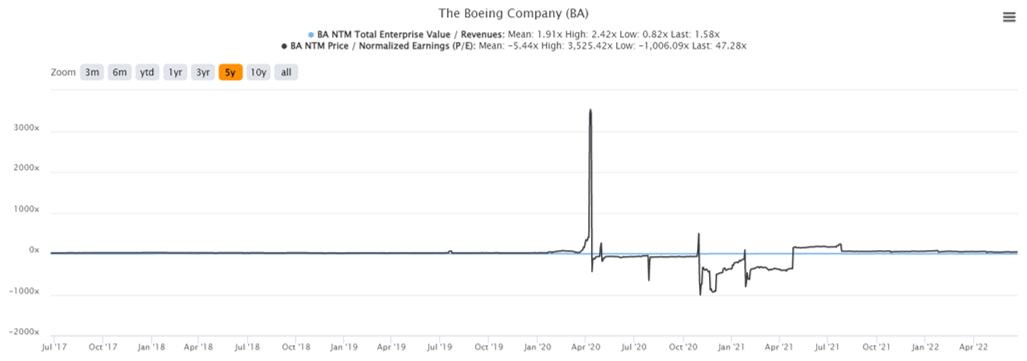
S&P Capital IQ
BA is currently trading at an EV/NTM Revenue of 1.58x and NTM P/E of 47.28x, lower than its 5Y EV/Revenue mean of 1.91x though massively elevated from its 5Y P/E mean of -5.44x. It is apparent that the stock had generally not recovered from the massive plunge during the first two weeks of March 2020, from $275.11 on 28 February 2020 to $95.01 on 20 March 2020, since BA is currently trading at $141.53, at a 48.5% distance to prior highs.
BA 5Y Stock Price

S&P Capital IQ
Though current stock prices are at a 25.2% premium from its 52 weeks low of $113.02, BA was also down 43.9% from its 52 weeks high of $252.30. Since the stock is also trading at the equivalent of January 2014 levels, it is apparent that it has been severely punished in the past two years. Therefore, investors looking for a quick recovery would be sorely tested, especially given the current bear market.
Therefore, despite a consensus estimates strong buy rating for the BA stock with an eventual price target of $225.88 with a 59.6% upside, we are more conservative about the timeline. We are of the opinion that the BA stock would only recover to the price target, once the company reports net income or FCF profitability again. Then, the stock may potentially sustain its gains to beyond $300, if the company could moderate its exposure to the massive debts incurred during the COVID-19 pandemic.
Nonetheless, we must also admit that BA is trading relatively attractive at these near bottom levels, given its historical duopoly in the large passenger aircraft manufacturing market. Therefore, speculative investors looking for value entry points may consider adding some exposure here, since recovery is possible by FY2023 or FY2024.
In contrast, conservative investors with lower risk tolerance should definitely wait it out a little, since it is entirely possible that BA may retrace further nearer to its 52 weeks low, upon an underperforming FQ2’22 earnings call, as it did for the past three quarters. Moreover, given the delayed deliveries and supply chain problems as guided by BA’s CEO, we may also see short- and intermediate-term volatility ahead.
Therefore, we rate BA stock as a Hold for now.
Be the first to comment