

Scott Olson/Getty Images News
Price Action Thesis
We present our detailed price action analysis on The Boeing Company (NYSE:BA) stock. A series of headwinds have beset BA stock after reaching its previous 2021 highs in March. Notably, a significant bull trap in March 2021 rejected further buying momentum that sent its stock on a downward spiral, returning its flow to a bearish bias.
However, we noted that BA stock seems to be finding strong support at its current levels, even though there’s no bear trap (significant rejection of selling momentum).
Our reverse cash flow model indicates that BA stock has been priced for massive headwinds even as its free cash flow (FCF) profitability is set to recover. Our analysis also suggests that BA stock seems undervalued and could outperform its 10Y CAGR and “market-perform” with the SPDR Dow Jones Industrial ETF’s (DIA) 10Y CAGR. As a result, we think significant headwinds have been priced in, giving investors another opportunity to bottom-fish at levels last seen in May 2020.
Accordingly, we rate BA stock as a Buy.
BA – March 2021’s Bull Trap Forms Its Critical Resistance
BA price chart (monthly) (TradingView)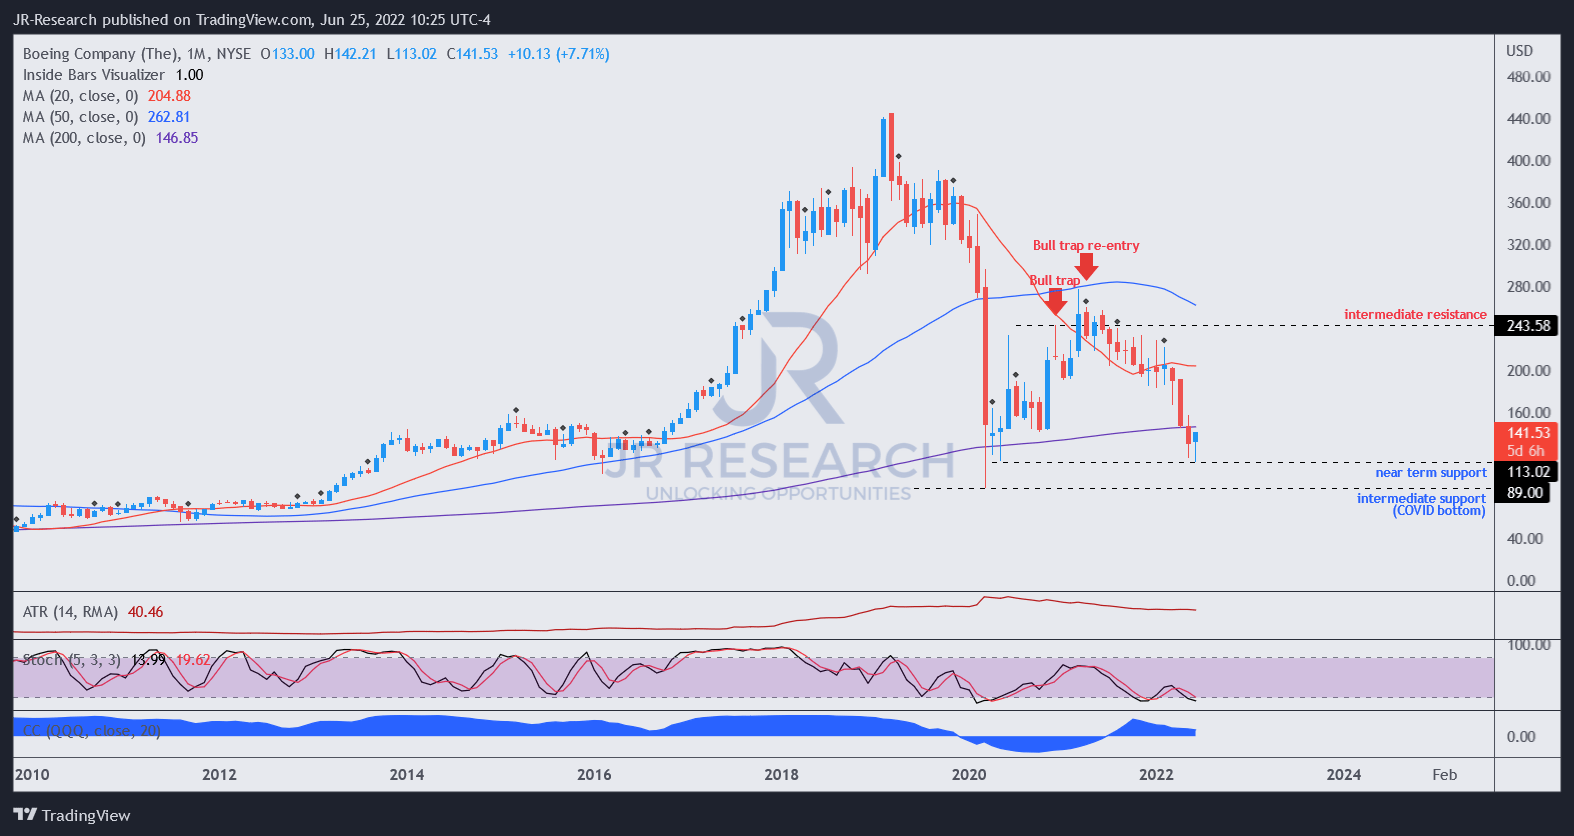
We can glean BA’s twin bull traps in December 2020 and March 2021. Notably, March’s bull trap was a re-entry signal after its December bull trap was invalidated. Therefore, the market drew in a final round of buyers over three months before setting up March’s trap. As a result, it also gave us confidence that BA could face stiff selling pressure at the $240 level, setting up its intermediate resistance.
BA price chart (weekly) (TradingView)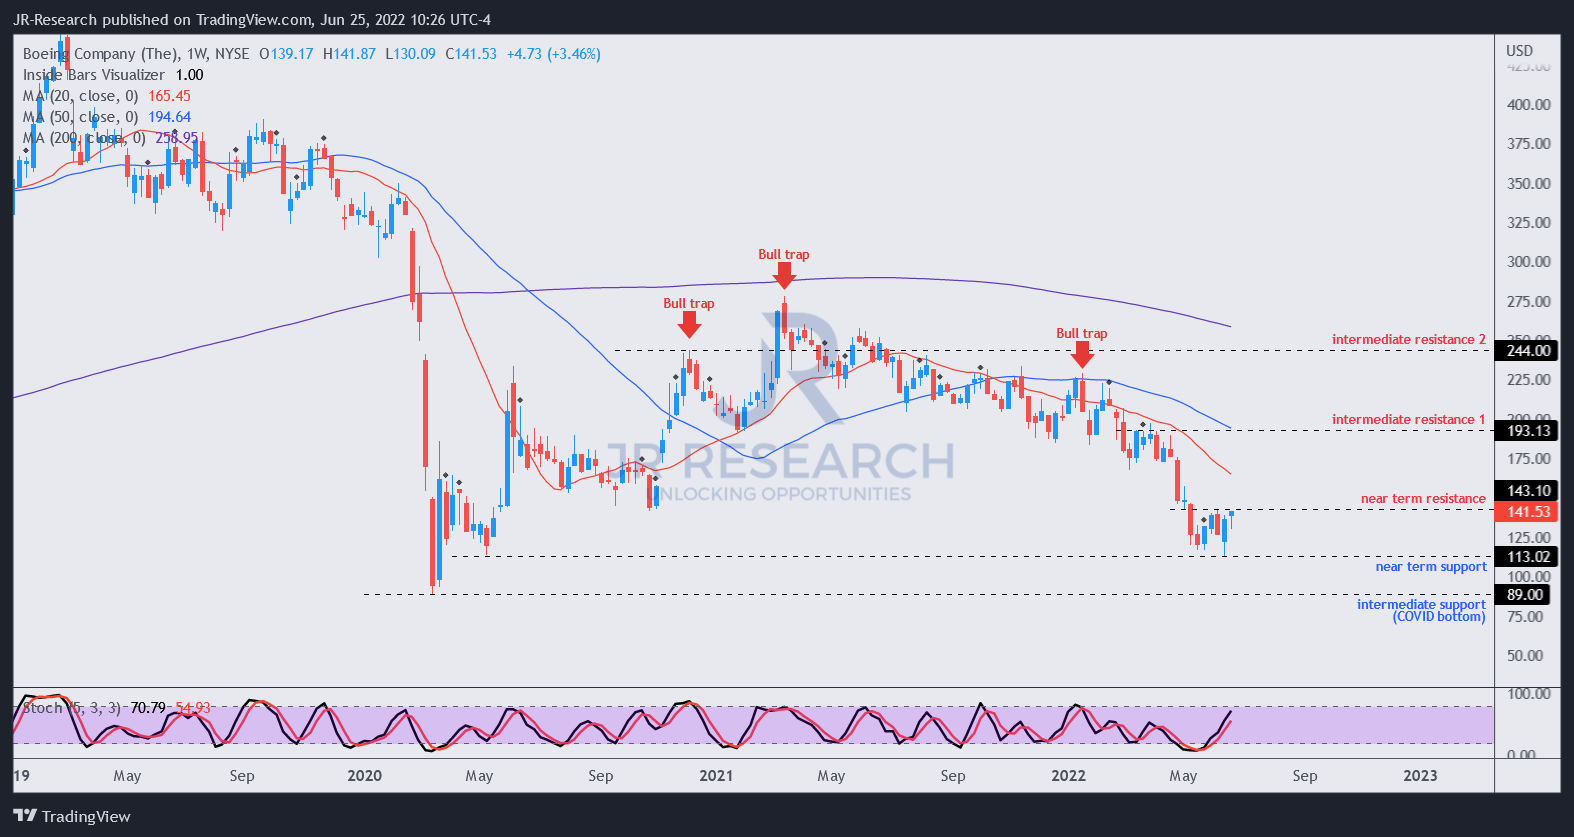
Moving into BA’s weekly chart, we can corral its critical March 2021 bull trap. Notably, BA had recovered its bullish bias by March but was undone by the bull trap. Subsequently, the market continued to distribute (deliberate selling process to tire investors and also to prevent steep sell-offs) its gains until another bull trap in January 2022.
January’s bull trap was highly significant, as it confirmed another lower high bull trap and one that hampered its recovery to retake its bullish bias. Therefore, it was an early warning sign that the market could force a rapid liquidation of BA stock.
We noted that the rapid liquidation had occurred over three weeks from April-May 2022 before forming its near-term support ($113). Consequently, BA has consolidated at the current levels for close to two months, which is constructive for basing.
However, we did not observe a bear trap price action that could help stanch its bearish bias and turn the tide. Therefore, we think a steeper sell-off to force capitulation cannot be ruled out, given the lack of a bear trap.
BA – Valuation Seems Attractive: Market-Perform
BA delivered a 10Y CAGR of 7%, below the DIA’s 10Y CAGR of 9.57%. Therefore, we believe it’s apt for us to model whether BA can at least achieve market-perform at the current levels.
Boeing revenue change % and FCF margins % consensus estimates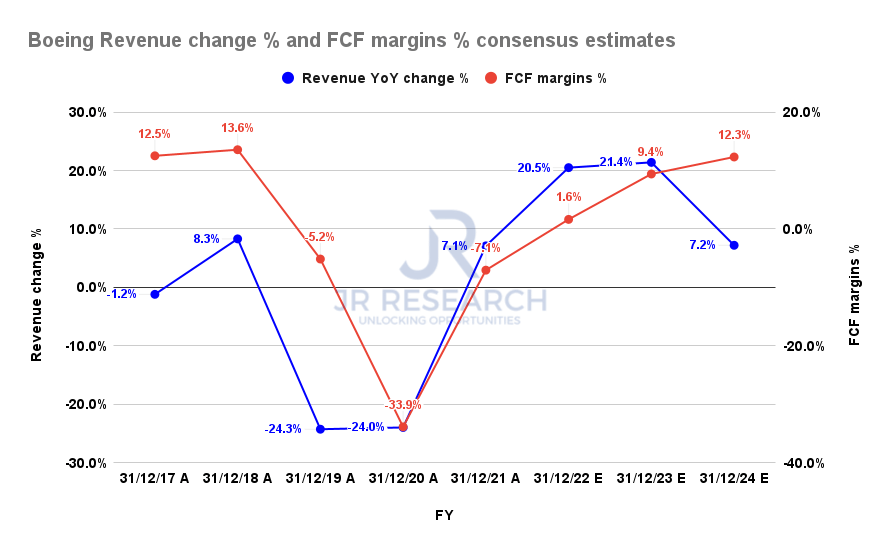
| Stock | BA |
| Current market cap | $83.73B |
| Hurdle rate (CAGR) | 9.5% |
| Projection through | CQ4’24 |
| Required FCF yield in CQ4’24 | 6.5% |
| Assumed TTM FCF margin in CQ4’24 | 7.8% |
| Implied TTM revenue by CQ4’24 | $104.97B |
BA reverse cash flow valuation model. Data source: S&P Cap IQ, author
BA last traded at an NTM FCF yield of 7.78%, well above its 10Y mean of 4.83%. As seen above, we believe the market is justified in asking for higher yields, given its anemic free cash flow (FCF) profitability currently.
Boeing is projected to report an FCF margin of 1.6% in FY22, still well below its pre-COVID levels. Therefore, we believe the market is still finding its bearing on how to model BA’s valuation. Notwithstanding, the consensus estimates indicate that Boeing could recover its pre-COVID FCF margins by FY24.
Boeing also suggested the worst headwinds that have buffeted the company “is coming to an end.” We believe BA’s price action also seems constructive, lending credence to management’s optimism.
Also, we used reasonable parameters in our reverse cash flow model, applying a market-perform hurdle rate of 9.5%. We also used a markedly higher FCF yield of 6.5% (Vs. 10Y mean of 4.83%) given its current FCF volatility. In addition, we used a blended TTM FCF margin of 7.8%, markedly below the Street’s consensus, to factor in a reasonable margin of safety.
Accordingly, our TTM revenue target of $104.97B by CQ4’26 seems achievable, based on the current consensus estimates of $97.68B in FY24.
Is BA Stock A Buy, Sell, Or Hold?
We rate BA stock a Buy, with a medium-term price target (PT) of $180, implying a potential upside of 27.2%. Our price action analysis indicates that BA stock is at a likely bottom, consolidating close to its near-term support of $113 for almost two months. However, a lack of bear trap price action remains the most critical risk to our thesis.
Our valuation analysis suggests that its valuation is undemanding. Therefore, investors can consider adding exposure at the current levels. We believe a significant level of headwinds has been priced into its stock. Notwithstanding, the market remains tentative over its FCF profitability. Therefore, solid execution by management moving forward could help re-rate BA.
Be the first to comment