

jetcityimage
Block (NYSE:SQ) offers an array of financial services to individuals and businesses. For individuals, the company’s Cash App provides peer-to-peer payments and a number of banking services, as well as brokerage through subsidiary Cash App Investing, LLC, a FINRA and SIPC member. Cash app also supports bitcoin trading, but not through Cash App Investing, LLC. Cash App has an average rating of 4.7 (out of 5) stars, with 1.47 million reviews on Google Play. For businesses, while the best-known offering is the company’s digital point-of-sale service, the company also offers a broad set of vendor tools, including inventory management and payroll services. SQ moved into the ‘buy now, pay later’ space (aka BNPL) with the acquisition of Afterpay. The potential synergies from adding BNPL to the company’s vendor- and individual-focused financial tools are compelling.
SQ shares have fallen 71% over the past 12 months, as the market has soured on growth stocks in response to rapidly rising interest rates, along with the decline in revenues from Bitcoin.
Seeking Alpha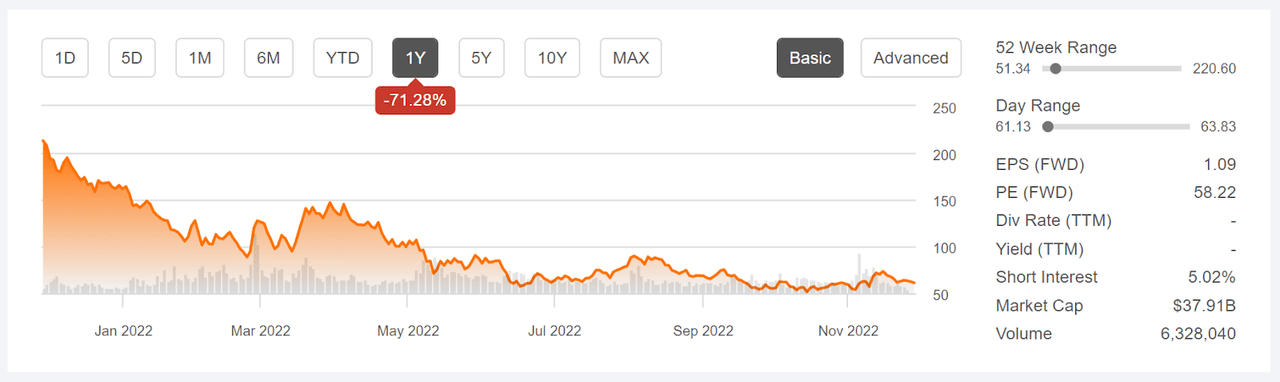
12-Month price history and basic statistics for SQ (Source: Seeking Alpha)
Revenue from bitcoin trading has been the majority of total revenue for Cash App since the end of 2019. This source of revenue has fallen dramatically this year (also see Segment Information tab here for details). SQ’s quarterly earnings have fallen dramatically since reaching an all-time high in Q2 of 2021, although the Q3 2022 results (reported on November 3rd) were well above expectations. The consensus outlook for SQ EPS indicates a steady recovery in earnings, with an average EPS growth rate of 13.7% per year over the next 3 to 5 years.
ETrade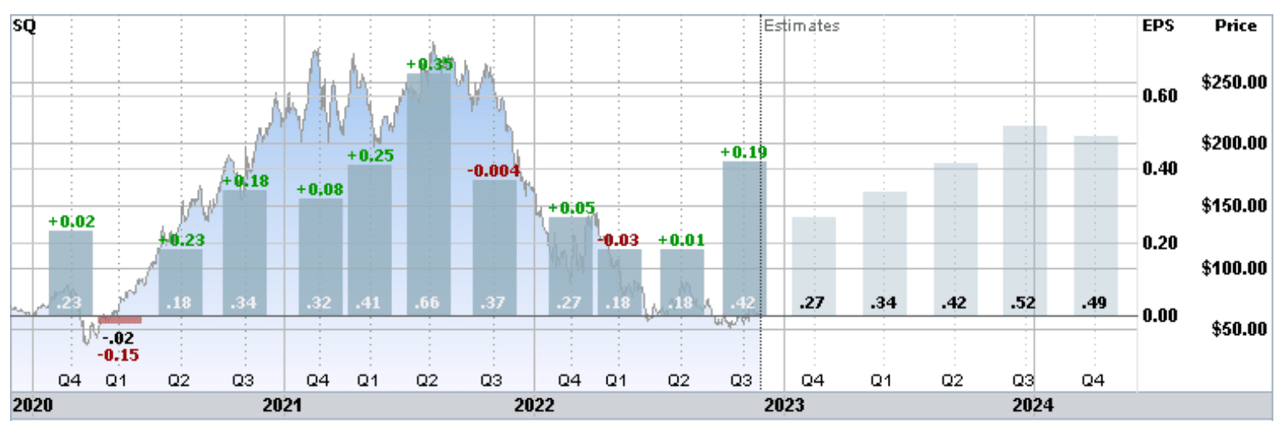
Trailing and estimated future quarterly EPS for SQ. Green (red) values are amounts by which EPS beat (missed) the consensus expected value (Source: ETrade)
As the company matures, building out a diverse suite of financial services, the expected growth is relatively low. This is the huge challenge that the company faces. The forward P/E of 58 is justifiable only for a company with very rapid expected growth. Even if the Fed slows down the rate of interest rate increases, the net present value (NPV) of future earnings for growth companies have fallen dramatically in 2022. SQ must be valued in light of the higher rates / lower NPV, as well as the loss of bitcoin-related revenue.
I last wrote about SQ on January 28, 2022, at which time I maintained a neutral / hold rating. In writing that analysis, the continued enthusiasm among Wall Street analysts struck me as overdone. This was consistent with the article that I wrote in late March of 2021. The Wall Street consensus outlook for SQ was based on very optimistic assumptions about earnings growth. The market-implied outlook for SQ, which reflects the consensus view reflected in the prices of call and put options, was bearish as of late January of 2022, as it was in March of 2021.
Seeking Alpha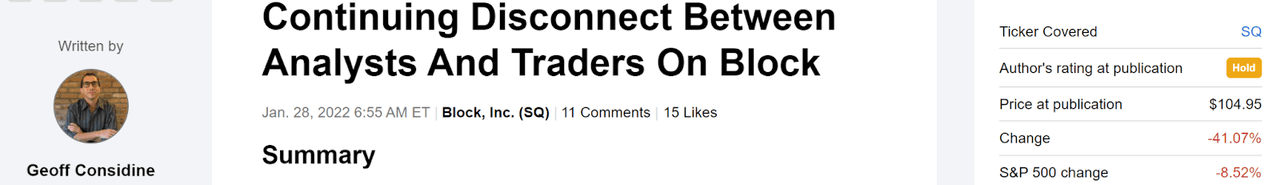
Previous post on SQ and subsequent performance vs. the S&P 500 (Source: Seeking Alpha)
While the Wall Street analyst consensus 12-month price target in January implied a gain of more than 100% over the next year, the spread among the individual analyst price targets was very high. Research has found that a high dispersion in the price targets reduces the predictive value of the consensus. As a rule of thumb, I strongly discount the consensus price target when the ratio of the largest and smallest analyst price targets exceeds a value of 2. This was the case for my January analysis.
I compromised between the bullish Wall Street rating and the bearish market-implied outlook in maintaining a neutral / hold rating for SQ in late January. In retrospect, I should have given much more weight to the market-implied outlook because of the lack of agreement among the Wall Street analysts.
For readers who are unfamiliar with the market-implied outlook, a brief explanation is needed. The price of an option on a stock is largely determined by the market’s consensus estimate of the probability that the stock price will rise above (call option) or fall below (put option) a specific level (the option strike price) between now and when the option expires. By analyzing the prices of call and put options at a range of strike prices, all with the same expiration date, it is possible to calculate a probabilistic price forecast that reconciles the options prices. This is the market-implied outlook. For a deeper explanation and background, I recommend this monograph published by the CFA Institute.
With 10 months since my last analysis, I have calculated updated market-implied outlooks for SQ and compared these with the current Wall Street consensus outlook in revisiting my rating.
Wall Street Consensus Outlook for Block Stock
ETrade calculates the Wall Street consensus outlook by combining the views of 27 ranked analysts who have published ratings and price targets for SQ over the past 3 months. The consensus rating is a buy, as it has been for all of the past year, and the consensus 12-month price target is 41% above the current share price. The spread in the individual price targets continues to be very high, with the highest price target ($120) 2.4 times the lowest price target ($49). This is sufficiently high that I largely discount the consensus. Seeing the consensus rating maintained at a buy over the entirety of the last year also supports my belief that the prevailing view among the analysts is too optimistic.
ETrade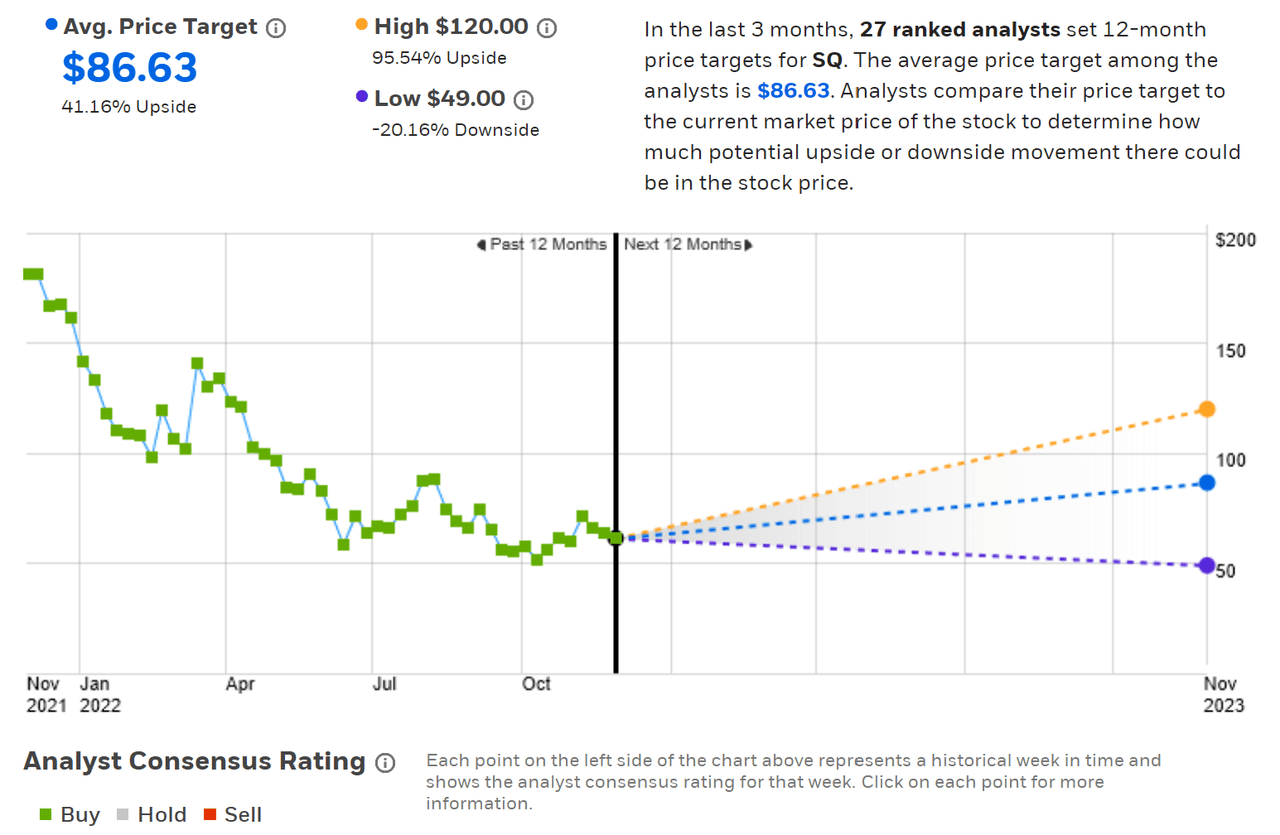
Wall Street analyst consensus rating and 12-month price target for SQ (Source: ETrade)
Seeking Alpha’s version of the Wall Street consensus outlook is calculated using price targets and ratings from 45 analysts who have published their views over the past 90 days. The consensus rating is a buy and the consensus 12-month price target is 52% above the current share price. The dispersion among the individual analyst price targets is very high, with the highest ($210) coming in at more than 4 times the lowest ($51). The consensus rating has been a buy since late September of 2020.
Seeking Alpha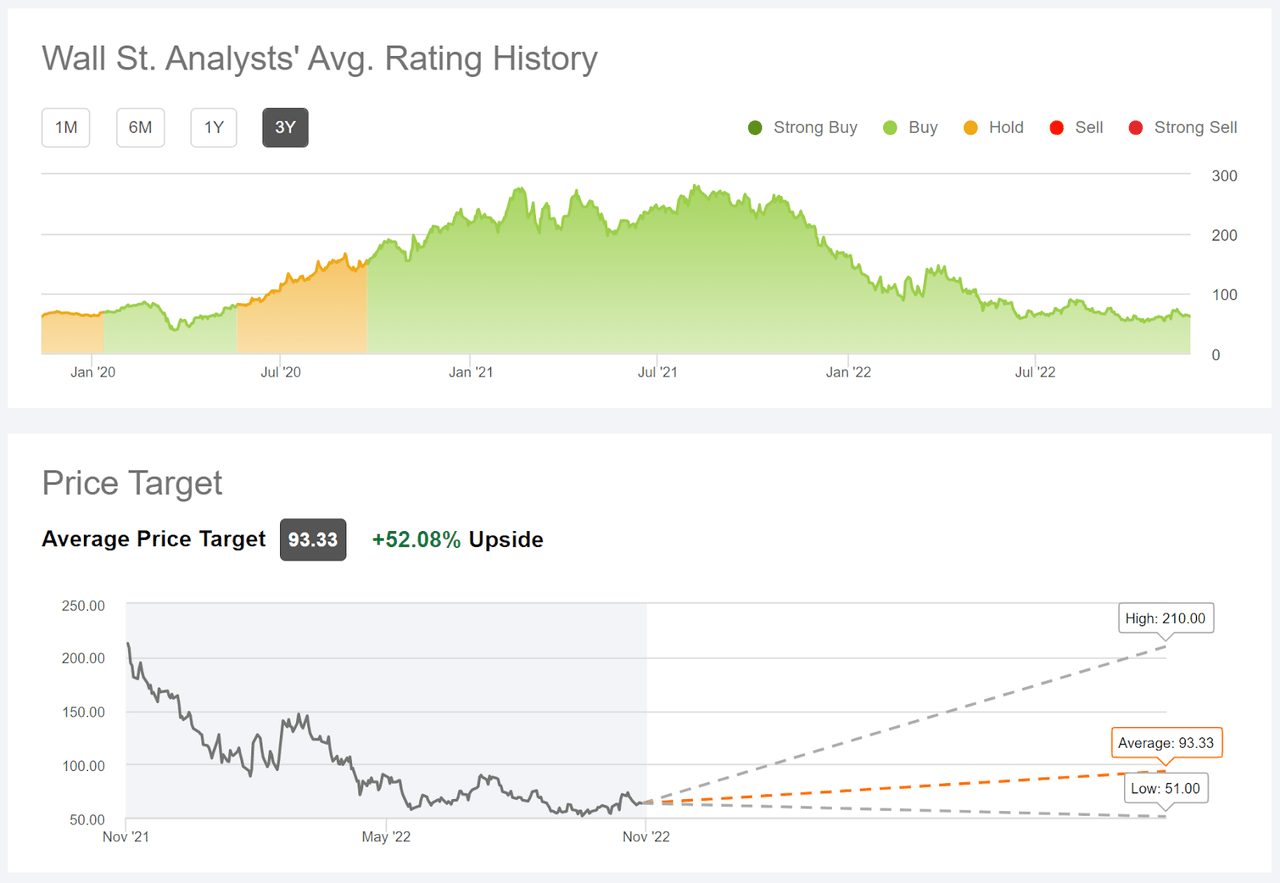
Wall Street analyst consensus rating and 12-month price target for SQ (Source: Seeking Alpha)
The Wall Street consensus outlook for SQ continues to be bullish, but the large dispersion among the individual analyst price targets and the unwavering consensus buy rating over the past 2+ years lead me to discount the predictive value of the consensus.
Market-Implied Outlook for SQ
I have calculated the market-implied outlook for SQ for the 1.7-month period from now until January 20, 2023, for the 6.5-month period from now until June 16, 2023, and for the 13.6-month period from now until January 19, 2024, using the prices of call and put options that expire on each of these dates. I selected these specific dates to provide a view through the end of 2022, to mid-2023, and all the way through 2023. In addition, options that expire in January and June tend to be particularly liquid, adding confidence in the representativeness of the market-implied outlook.
The standard presentation of the market-implied outlook is a probability distribution of price return, with probability on the vertical axis and return on the horizontal.
Geoff Considine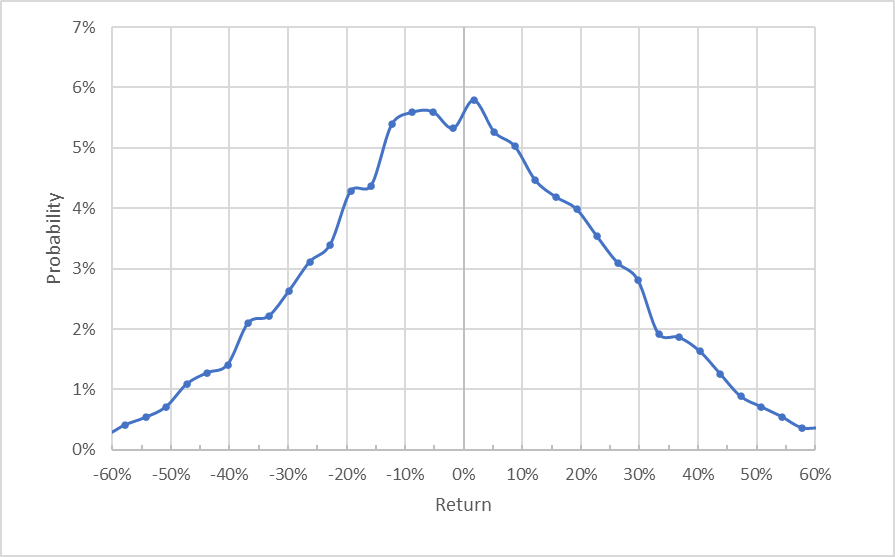
Market-implied price return probabilities for SQ for the 1.7-month period from now until January 20, 2023 (Source: Author’s calculations using options quotes from ETrade)
The distribution of returns for the 1.7-month outlook is generally symmetric, with the maximum probability corresponding to a price return of +1.75%, although there is a secondary peak that spans a range of negative returns. The expected volatility calculated from this distribution is 71% (annualized), which is high for a large cap stock. For comparison, ETrade calculates a 69% implied volatility for the option expiring on January 20, 2023.
To make it easier to compare the relative probabilities of positive and negative returns, I rotate the negative return side of the distribution about the vertical axis (see chart below).
Geoff Considine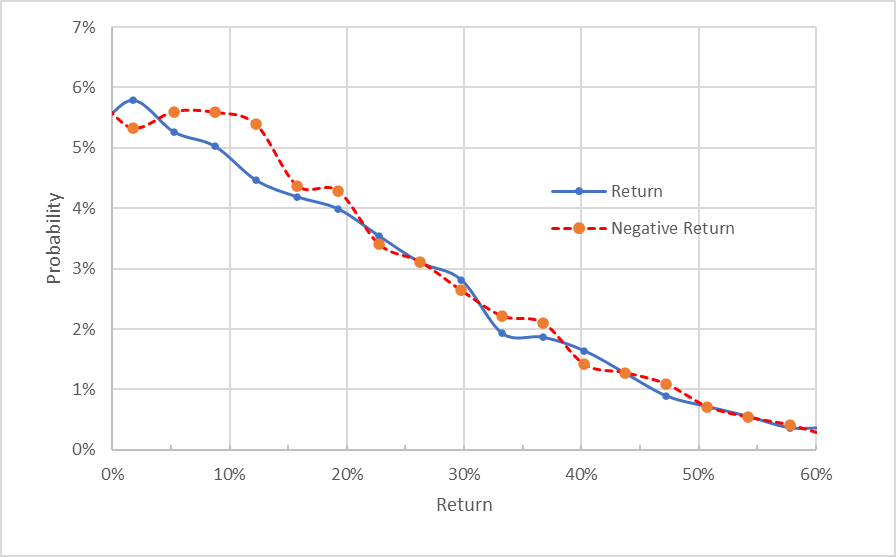
Market-implied price return probabilities for SQ for the 1.7-month period from now until January 20, 2023. The negative return side of the distribution has been rotated about the vertical axis (Source: Author’s calculations using options quotes from ETrade)
This view shows the broad secondary peak in probabilities of negative returns (the dashed red line is above the solid blue line over almost all of the left third of the chart above), although the probabilities match very closely for larger-magnitude returns.
Theory indicates that the market-implied outlook is expected to have a negative bias because investors, in aggregate, are risk averse and thus tend to pay more than fair value for downside protection. There is no way to measure the magnitude of this bias, or whether it is even present, however. Considering this potential bias, based on the array of results that I have generated for different stocks, I interpret this market-implied outlook as neutral with perhaps a bullish tilt.
The market-implied outlook for the 6.5-month period to June 16, 2023 is decidedly bearish, with the maximum probability corresponding to a price return of -29%. The probabilities of negative returns are markedly higher than the probabilities for positive returns of the same magnitude, across a wide range of the most-probable outcomes (the dashed red line is well above the solid blue line over the left 6/10 of the chart below). The expected volatility calculated from this distribution is 74%. Even considering the potential negative bias, I interpret this market-implied outlook as robustly bearish.
Geoff Considine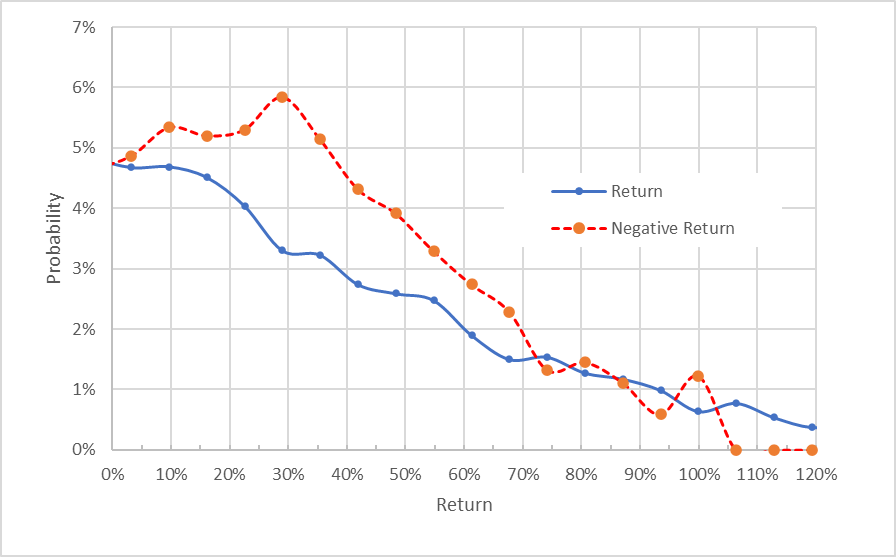
Market-implied price return probabilities for SQ for the 6.5-month period from now until June 16, 2023. The negative return side of the distribution has been rotated about the vertical axis (Source: Author’s calculations using options quotes from ETrade)
The market-implied outlook for the 13.6-month period to January 19, 2024 is also strongly bearish. The maximum probability corresponds to a price return of -41% and the probabilities of negative returns are above those for positive returns over an even larger range of the potential outcomes. The secondary peak in probability at a return of -100% represents the estimated probability of a total loss, as implied by the options prices. The market-implied outlook is not a reliable way to estimate the potential for this level of extreme outcomes, however. The expected volatility calculated from this distribution is 74% (annualized). To put this in context, there is an estimated 20% probability that SQ will fall by 55% or more over this 13.6-month period (the 20th percentile corresponds to a return of -55%).
Geoff Considine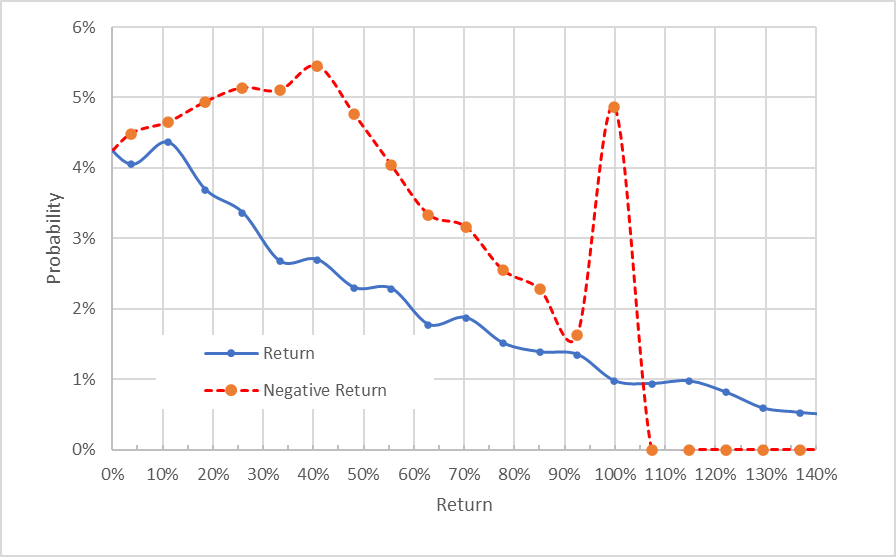
Market-implied price return probabilities for SQ for the 13.6-month period from now until January 19, 2024. The negative return side of the distribution has been rotated about the vertical axis (Source: Author’s calculations using options quotes from ETrade)
The market-implied outlooks indicate a predominantly neutral view through the end of 2022, shifting to a bearish view to the middle of 2023 and into the start of 2024. The expected volatility is quite stable over this period, in the range of 71% to 74%.
Summary
Block is doing many things well and has created an impressive ecosystem of payment and banking services. Considering the company’s likely growth trajectory with reduced Bitcoin revenue, along with the reduction in the NPV of future earnings due to higher interest rates, it is clear that the fair value of the stock is much lower than previously thought. The Wall Street analysts have been too optimistic about SQ’s growth potential for the past 2+ years. The Wall Street consensus rating continues to be a buy, with expected return of 40% to 50% over the next year. Given the unwavering bullishness from the consensus rating, even as the market conditions have deteriorated, along with the large dispersion in the individual analyst price targets, I don’t give the Wall Street consensus much credence. The market-implied outlook continues to be bearish with high volatility to the middle of 2023 and for the full year. That said, the outlook to the start of 2023 is generally benign. I am changing my rating on SQ from a hold to sell.
Be the first to comment