

ozgurdonmaz
Bitcoin (BTC-USD) is currently sitting in the $21k range at the time of writing, representing around a 70% draw down, from the all-time high of $68,978, for this volatile commodity. Based on my valuation model, it is also sitting about 54% below its fair value.
For long HODLers with multi-decade investment horizons, this is an attractive time to invest or add to your positions. But for those with shorter horizons, or those wanting to allocate capital in a strategic DCA fashion, based on what may lie ahead in the next few quarters, it might be prudent to come up with a game plan based on probabilistic outcomes.
Buying Strategy Inventory
My forward buying strategy for the next few quarters is based on valuation, probabilistic downside in the current macro environment, and BTC’s typical price action as a function of equity market movement, and central bank maneuvers.
Valuation
I valuate BTC with my proprietary Price to Network model, that you can read the details about in my February 2022 article, Bitcoin Near Fair Value – Time to Buy. Basically, BTC’s value is based on its network size, similar to how an equity’s value is based on its sales, earnings, and cash flow. So instead of comparing forward P/Es against historical averages to gauge an equity’s valuation, I’m looking at PN’s. Adding in the latest few month’s data from Glassnode Studio, quantized at the monthly level, here’s where we’re currently sitting:
| FV based on LT History (Average PN) | 16.40 x 1015.15 = $16,648 |
| FV based on ST History (Average PN) | 29.96 x 1015.15 = $30,413 |
| FV based on PN Monthly Series Trend | 49.02 x 1015.15 = $49,762 |
| FV based on Price Appreciation Trend | $68,547 |
| FV based on Price vs. Network Trend | $67,482 |
| Average FV for all methods for Aug 2022 |
$46,570 |
Source: Proprietary Bitcoin Valuation Model – Data Captured 8/20/2022
The fair value as of August 2022 is $46,570 according to the model. But before we back up the truck lets look backward and forward, with respect to the macro environment:
Evidence That a Recession is on the Horizon
Here’s my recession forecast inventory:
-
Both the 1-10 and 2-10 Treasury yield spreads are negative as of June or July of 2022; these inversions have correctly predicted the last 7 US recessions. Yes you could say technically we’ve had a couple negative quarters, so good job yield curve, but generally the recession doesn’t show up for a significant amount of months after the inversion.
-
Oil price shocks tend to increase the probability of a recession, especially if the Fed reacts to them by raising rates. Oil prices are currently moderately below what they fundamentally should be, secondary to traders’ recession related fears, and SPR releases and those of the US allies. Considering how significantly oil drove inflation over the last 12 months, with the bond market hugging it tightly, and that its price could remain elevated, even inside a recession, this lends evidence that the Fed will act in a hawkish manner, past what needs to be.
-
The Fed raising rates too aggressively is a classical recession trigger. The Fed’s credibility is on the line currently, and they know once things get sticky, inflation is a lot harder to stamp out, so likely they will be too aggressive this time around as well. Fed officials are signaling higher unemployment may be necessary to quell inflation; and unfortunately, unemployment is a severely lagging economic indicator regarding the health of the economy. By the time the Fed starts seeing unemployment tick up, and can call victory, they’ve already long broken something, and likely the market will have reacted to it. Further, behind the scenes, they’re likely feeling unofficial political pressure to take down inflation as well.
-
The Fed doesn’t have a good track record for soft landings. Out of the 13 modern inflation scares, the Fed has only pulled off a soft landing 3 times in 1965, 1984, and 1994. So empirically there’s like a 75% chance of a hard landing after a rate hike campaign.
-
The NY Fed’s model currently has the US (hard landing) recession odds at 80% with the chance of a soft landing at 10%. This is basically in consensus with the historical data. Incidentally, the soft landing (4 out of 10 quarters are positive growth) doesn’t sound that great. Hard landings are when at least 1 quarter of the next ten shows a -1% annualized GDP print.
-
We’re already seeing forward indicators like housing and ISM Regional New Orders going down. (To be fair, the Aug 18th numbers do show a potential recovery starting in new orders; something to keep an eye on.)
- Econ PI Mean of Coordinates continues to deteriorate, and is currently sitting at 11.9%, which is where it usually sits 3-6 months before a recession.
How Do Bear Markets Act Concomitantly With Recessions?
As more and more institutional buyers have ventured into the BTC space, post 2017, we’re seeing the commodity more frequently react to equities market action, and thus, we’re obligated to forecast equity price action to get an idea of where BTC might go in the near term. BTC also reacts to the Fed balance sheet and is highly correlated with global money supply but we’ll look at that later.
It is common for recession related bear markets to host a series of relief rallies. Examining these relief rallies, on the S&P 500, for the recessionary bear markets from 1969 to 2008, we see that for rallies that are 7% or greater in gains, the average rally owned a 11.1% gain, was 53 days long, and the average number of these per recession was 2.5. If you go back in history further to 1929, then, on average, recessionary bears would host 4 rallies before the final plunge (see Dividend Sensei’s quick market history lesson, at the top of his article My, Oh My, 7 High-Yield Dividend Aristocrat Strong Buys).
Are we currently in a relief rally, or have we started a new bull run? Using an 8 point system, based on the criteria I’ve populated in the tables below, and further adding the average number of rallies per recessionary bear as a threshold, our current situation scores a 1 out of 8, signaling that it is still more likely that a new bull market has not yet started.
Rally based signals:
| Recessionary Bear Market Rallies on S&P | Gain | Days | Points |
| Average Since Late 1960’s (7% or more threshold) | 11.1% | 53 | 1 |
|
Longest Since Late 1960’s (7% or more threshold) |
21% | 105 | 0 |
| Ned Davis New Bull Signal for Dow (Shorter) | 30% or more | More than 50 days | 0 |
| Ned Davis New Bull Signal for Dow (Longer) | 13% or more | More than 155 days | 0 |
| Current Rally (as of Aug 18) | 17.5% | 60 days |
Source: Personal Data, Ned Davis Research: Data Captured 8/18/2022
Market breadth based signals:
| Market Breadth Thrust Signals Pointing to New Bull Market | Does the Current Rally Meet the Signal Threshold? | Points |
| 90% of common stocks above their 20 day moving average on NYSE | No, currently 59.56%; local top was 86.58% | 0 |
| 90% of common stocks above their 20 day moving average on NASDAQ | No, currently 53.99%; local top was 79.04% | 0 |
| NYSE stocks advancing outnumber those declining at a 2:1 ratio for 10 days or more | No, the 10 day moving average is 1.7838 to 1 as of August 18th, 2022 | 0 |
Source: Stockcharts.com, Tradingview.com: Data Captured 8/18/22
Considering a hard landing recession is still the most likely outcome, and that we’re likely not in a bull market currently, and have yet to achieve the average number of relief rallies per recessionary bear, there lies a significant chance we’re going to go one leg lower in the equities markets. So how far down should we expect to go?
From Morningstar, quoting Ned Davis Research:
“If a recession occurs sometime in the second half of 2022, the stock market could drop another 10% or more. Bear markets that coincide with recessions tend to decline nearly 35% on average and last for 15.3 months. If this were to be the case, the sooner it would start, the sooner it would be over given that a bear market bottoms four months before a recession, setting the stage for a “shorter than average” recessionary bear market.
If a recession occurs in 2023 that would make the current bear market twice as long as average, and likely lead to numerous bear-market rallies that eventually fail as they have in past instances. Clissold cites 1973, 1978, and 2000 as past bear markets that saw numerous rallies between their start and finish with a maximum gain of 15.9%, 14.3%, and 15.5%, respectively.”
Okay, so there’s a significant probability of us making new lows, perhaps as far down as a 35% draw down in equities. But how will that affect BTC?
How Does BTC Respond to Equities Draw Downs?
Let’s examine how BTC responds to post 2017, significant equities draw downs to see if we might be able to forecast where it might be at, or around, during an upcoming equities nadir. I’ve examined 3 coincidental draw downs in the S&P and BTC, and constructed an average beta, or volatility ratio, for those.
For every percentage point the S&P loses in price, BTC loses 2.38 on average. Note these are coincidental drawdowns: I didn’t rigidly capture price prints for BTC on the same exact days as the S&P’s ATH’s or nadirs; I picked the closest ATH and closest nadir to those. Otherwise, the calculation would be skewed towards a significantly lower beta for BTC, which doesn’t exist in the real world.
| Time Period | S&P Draw Down | BTC Draw Down |
| 9-21 to 12-24, 2018 Taper Tantrum | 20% | 61% |
| 2-19 to 3-23, 2020 Pandemic Panic | 34% | 52% |
| 1-3 to 6-16, 2022 Inflation, War and Recession Fears | 24% | 71% |
| Average Draw Down | 26% | 62% |
Source: St. Louis Fed: Data Captured 8/18/2022
If the S&P ends up falling to the average recessionary bear draw down of 35%, then based on BTC’s 2.38 downside beta, it could bottom at 83.3% off its ATH. That’s not inconsistent with a typical crypto winter, where bottoms are usually in the 80-90% range. Basically, we’re talking about the S&P hitting the 3,100’s, and BTC getting pulled down into the $11,000 to $12,000 range. So that’s our local downside target, which will help in planning our forward DCA investment strategy. But BTC doesn’t just react to (or act in tandem with) market action. It’s got its eye on the Fed and other central banks.
How Does BTC Respond to Central Bank Maneuvers?
BTC likes Fed balance sheet expansion, dislikes tightening, and it really likes when the global money supply expands, and really doesn’t like when it contracts (on a cyclically adjusted basis, as shown later on down the page, at Exhibit B – the infamous Global Macro Investor chart).
Exhibit A: Fed Total Assets and BTC Price Action
BTC Price Action Vs. Fed Assets Growth YoY (St. Louis Fed)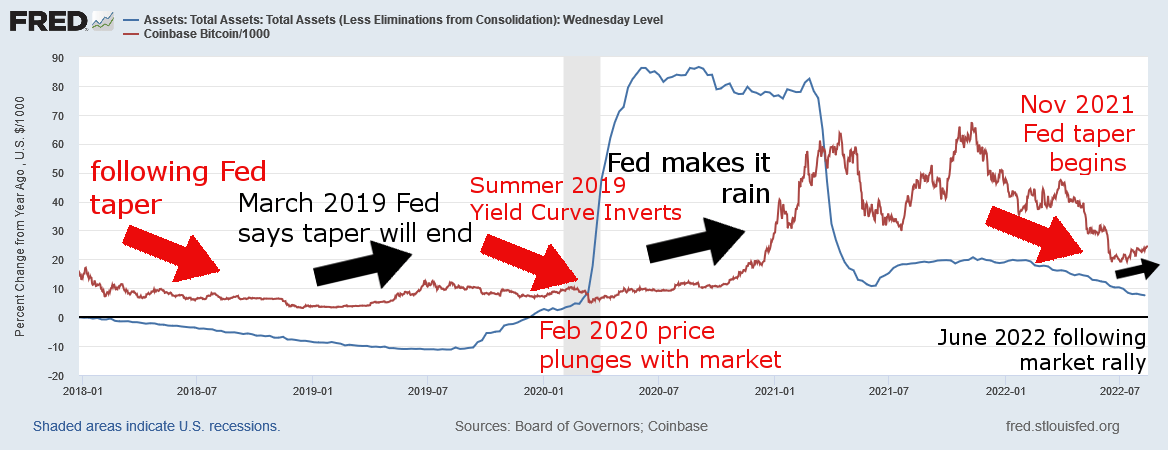
Exhibit A shows BTC will both anticipate Fed maneuvers, and react to them (or news that it will make a new maneuver). For example, the bleeding did stop in December of 2018, four months before the Fed announced that tapering would end, but once that announcement happened, BTC accelerated higher, long before the balance sheet expansion actually started.
BTC then plunged with the market during the pandemic panic, even though the Fed was ramping up expansion and dropping rates, and then, after the fact, did the crypto respond to that massive expansion with its massive uptick.
Same deal in November of 2021. At that point it was clear the Fed needed to do something, with housing having priced in a decade of appreciation in 2 years, but BTC waited until the Fed announced tapering before it headed for the hills. It slid down into the $18k range, at a time when the S&P got into fair value territory, and proceeded to rally with the market thereafter.
And it looks to me that it’s been rallying with the market on local, peak inflation sentiment, because why would it rally into a $47.5B/month and subsequent September, $95B Fed balance sheet reduction? I suppose it could be said that just like this year’s draw down in equities and crypto, which was a little too quick on the draw with respect to the initiation of the brewing recession, equities and crypto may be currently too soon in rallying with respect to a Fed pivot that may be quite some time away (June 2022 Fed dot plot, page 4).
Exhibit B: Crypto Capitalization’s Correlation with Global Money Supply
Crypto Capitalization Growth YoY Vs. Global Money Supply Cycle (Global Macro Investor)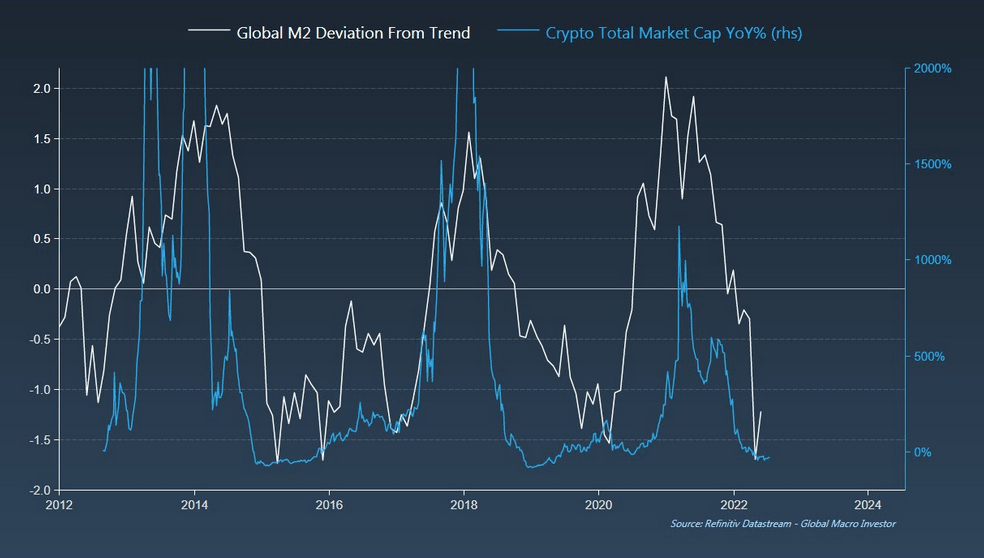
Even on GMI’s chart, we see a matured, institutionalized crypto following the money for the most part during its third cycle. Another takeaway is don’t be too caught up in the halving events, or merges, purges, surges, verges, etc.
Putting it All Together for a Game Plan
-
BTC is 54% under its fair value; it’s okay to be investing on a regular frequency right now.
-
The recessionary bear will likely drag risk assets lower.
-
BTC could drop to $11-12k during the nadir before the bull rally starts. That means BTC has around 50% downside risk right now, but based on recent history, we know it can go at least as high as $68k, so there is also a 3x upside reward possible, when stocks and crypto come out the other end of the bear. Further there is a 2x reward if BTC were merely to revert back to its fair value.
-
Recessionary bears tend to last 15 months and bottom 4 months before the economy does. We’re currently at month 8. Thus, we’ll plan to have our full position by March of 2023.
-
Yale says 2-6% of your portfolio should be BTC, so figure out your total cash bucket that should be in BTC by the end of the 2023 1st quarter. Divide your bucket evenly for the next 7 months to do weekly or daily purchases.
-
If BTC starts to significantly fall, become more aggressive with your regular purchases. Design a tier system that works for you (see below). If you’re able to spend your entire cash bucket before 7 months, then you’ve won, even if you run out of money before the bottom. Heck at sub $10k I’d probably just throw my entire cash bucket in and be done looking at BTC for a while.
| $21k or above | Regularly scheduled purchase |
| $18 – 21k (40 to 48% downside risk) | 1.5x regular purchase |
| $16 – 18k (31 to 40% downside risk) | 2x regular purchase |
| $14 – 16k (21 to 31% downside risk ) | 2.5x regular purchase |
| $12 – 14k (8 to 21% downside risk) | 3x regular purchase |
| $10 – 12k (zero to 8% downside risk) | 4x regular purchase |
Source: My tentative BTC purchase schedule to ensure I buy at the bottom; 8/18/2022
-
If my thesis breaks (rally surpasses my 8 criteria signaling we’re in a new bull market, Fed announces pivot, global quantitative easing campaigns accelerate, etc.) then just follow your regularly scheduled purchases and be glad you were buying significantly under fair value anyway. Let’s just keep in the back of our mind, that BTC is likely itching to rally if it sniffs out any type of QE on the table, or possibly even a significant drop in bond market yields.
-
If the price goes past my fair value, find something else undervalued to buy.
Conclusion
Though Bitcoin is significantly undervalued right now, we must be cognizant of the macro picture at the present when planning our next few quarter’s investing. Though it’s a fool’s errand to try to time the market, we can at least be prepared for probable outcomes with a game plan, understand what BTC price action is a function of, and be flexible to new information as it arises.
Be the first to comment