

Bitcoin Price Forecast:
- USD strength holds – strong employment data places US inflation in the spotlight, EM Currencies and equities fall
- Bitcoin fails to hold above $20,000, gloomy outlook reduces the appeal of cryptocurrency
- Price action remains within a well-defined range with Doji candles highlighting indecision.
US CPI, Bitcoin and Interest Rates
The same fundamental risks that have drastically changed the inflation narrative have been driving the downward trajectory for Bitcoin, pushing prices below $20,000. While price pressures have been mounting since late last year, the four-month war and an intensifying energy crisis has provided a gloomy outlook for global economic growth, with higher interest rates increasing the probability of a recession.
Central Banks and Monetary Policy: How Central Bankers Set Policy
A topic that was discussed in great detail in Q2 was the relationship between interest rates and stocks as well as the positive correlation (the relationship) between equities and cryptocurrency. Generally, neither asset class reacts positively to contractionary monetary policy which aims to reduce the money supply in order to tame inflation.
After another positive NFP (non-farm payroll) report on Friday, a robust labor environment has allowed the US Dollar to strengthen further with focus shifting to the economic calendar. With US CPI, PPI and Consumer Sentiment on this week’s agenda, investors are monitoring the inflation data closely, in an effort to anticipate the Fed’s (Federal Reserve) next move.
Discover The Psychology of Speculation in the Forex Market
DailyFX Economic Calendar
Bitcoin (BTC/USD) Technical Analysis
As highlighted on the weekly chart below, BT/USD has remained supported by the 23.6% Fibonacci level of the 2020 – 2021 move at $19.225 with the next level of support holding firm around the key psychological level of $18,000. Over the past four weeks, muted price action has been represented by low-bodied candles, forming a well-defined range between the above-mentioned support and $21,000.
Bitcoin (BTC/USD) Weekly Chart
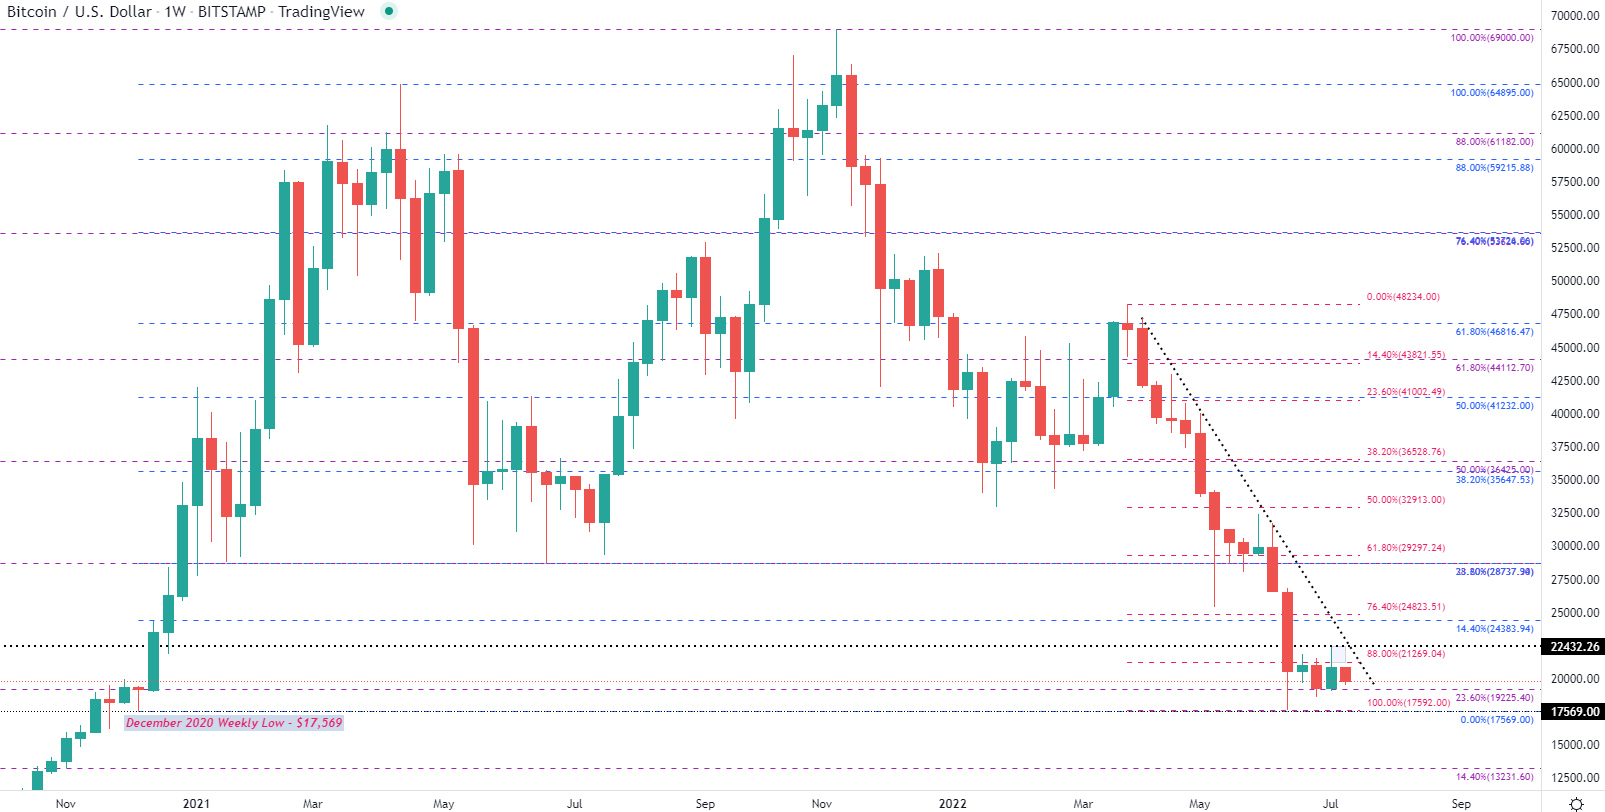
Chart prepared by Tammy Da Costa using TradingView
While the downtrend has rapidly gained traction since April, the daily chart further illustrates the manner in which prices have continued to consolidate with a series of doji candles suggestive of indecision.
Discover The Basics of Technical Analysis
After rebounding off of the June low at $17,592, Bitcoin bulls were able to drive prices higher in an effort to retest $22,000. However, after temporarily rising above this level on Friday, a positive NFP report placed further pressure on digital assets, limiting the upward move.
Bitcoin (BTC/USD) Daily Chart
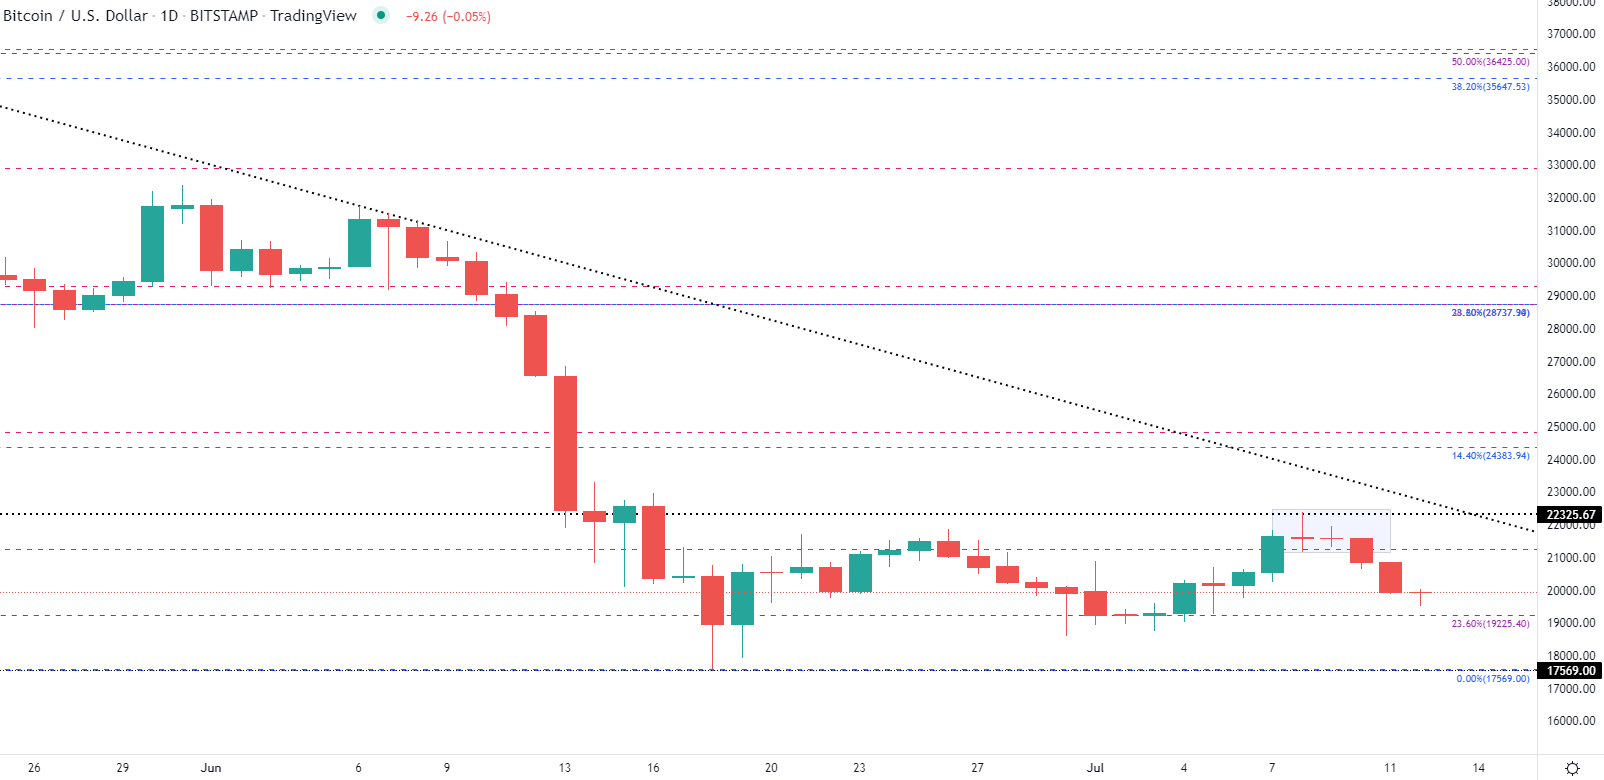
Chart prepared by Tammy Da Costa using TradingView
For the remainder of the week, a higher than expected US CPI or PPI print could further pressurize Bitcoin prices if markets expect an even more hawkish Fed rate decision later this month.
On the contrary, a softer print and easing recession fears may provide Bitcoin the opportunity to rise back above $21,000.
— Written by Tammy Da Costa, Analyst for DailyFX.com
Contact and follow Tammy on Twitter: @Tams707
Be the first to comment