

pictafolio/iStock via Getty Images
The rally that took place last week was epic. Equity markets around the world breathed a collective sigh of relief and the reaction from investors was to buy everything. This was particularly true in beaten-down groups such as small cap growth, consumer discretionary, and to a lesser extent, large cap growth. These are the areas of the market I watch very closely because they signal whether Wall Street is in a bullish mood. After all, if the big money thinks we’re going higher, they’re going to allocate to growth areas to take advantage of outsized up moves. It’s the same reason utilities and other defensive names outperform in times of duress.
The big question, however, is whether or not this move was the start of a new bullish phase, or if this was simply the unwinding of massive fear during options expiration week. The week of options expiration is generally a pretty volatile one, and you’ll recall the during rip-roaring bullish periods, options expiration tends to see a downward bias. However, this time around, since we’ve been in an extended bearish phase, the bias was very clearly higher. In other words, if there’s a predominant trend heading into options expiration, it’s a fairly safe bet we’ll see a move the week of options expiration in the opposite direction. That’s exactly what last week was. Whether it has staying power or not is the big question, and right now, I’m not so sure.
Part of the reason I’m not so sure is something we’ll discuss in a bit, but permit me to elaborate on options expiration, and the role market makers play in this. When an index or an individual stock has made a big move to one side or the other – in this case, we had just about everything move lower into opex week – in-the-money options are heavily skewed to one side.
In this case, we had literally billions of dollars of in-the-money put premium that was set to expire on Friday. That gives market makers a huge incentive to bid up prices of various securities to “balance the scales” between call and put premiums that are in-the money. This is not a new phenomenon by any means, and it is well known. But I think it’s worth keeping in mind in the context of the massive rally we saw last week, because I’m not overly convinced the situation is as bullish as it would seem right now.
Let’s get to the chart.
StockCharts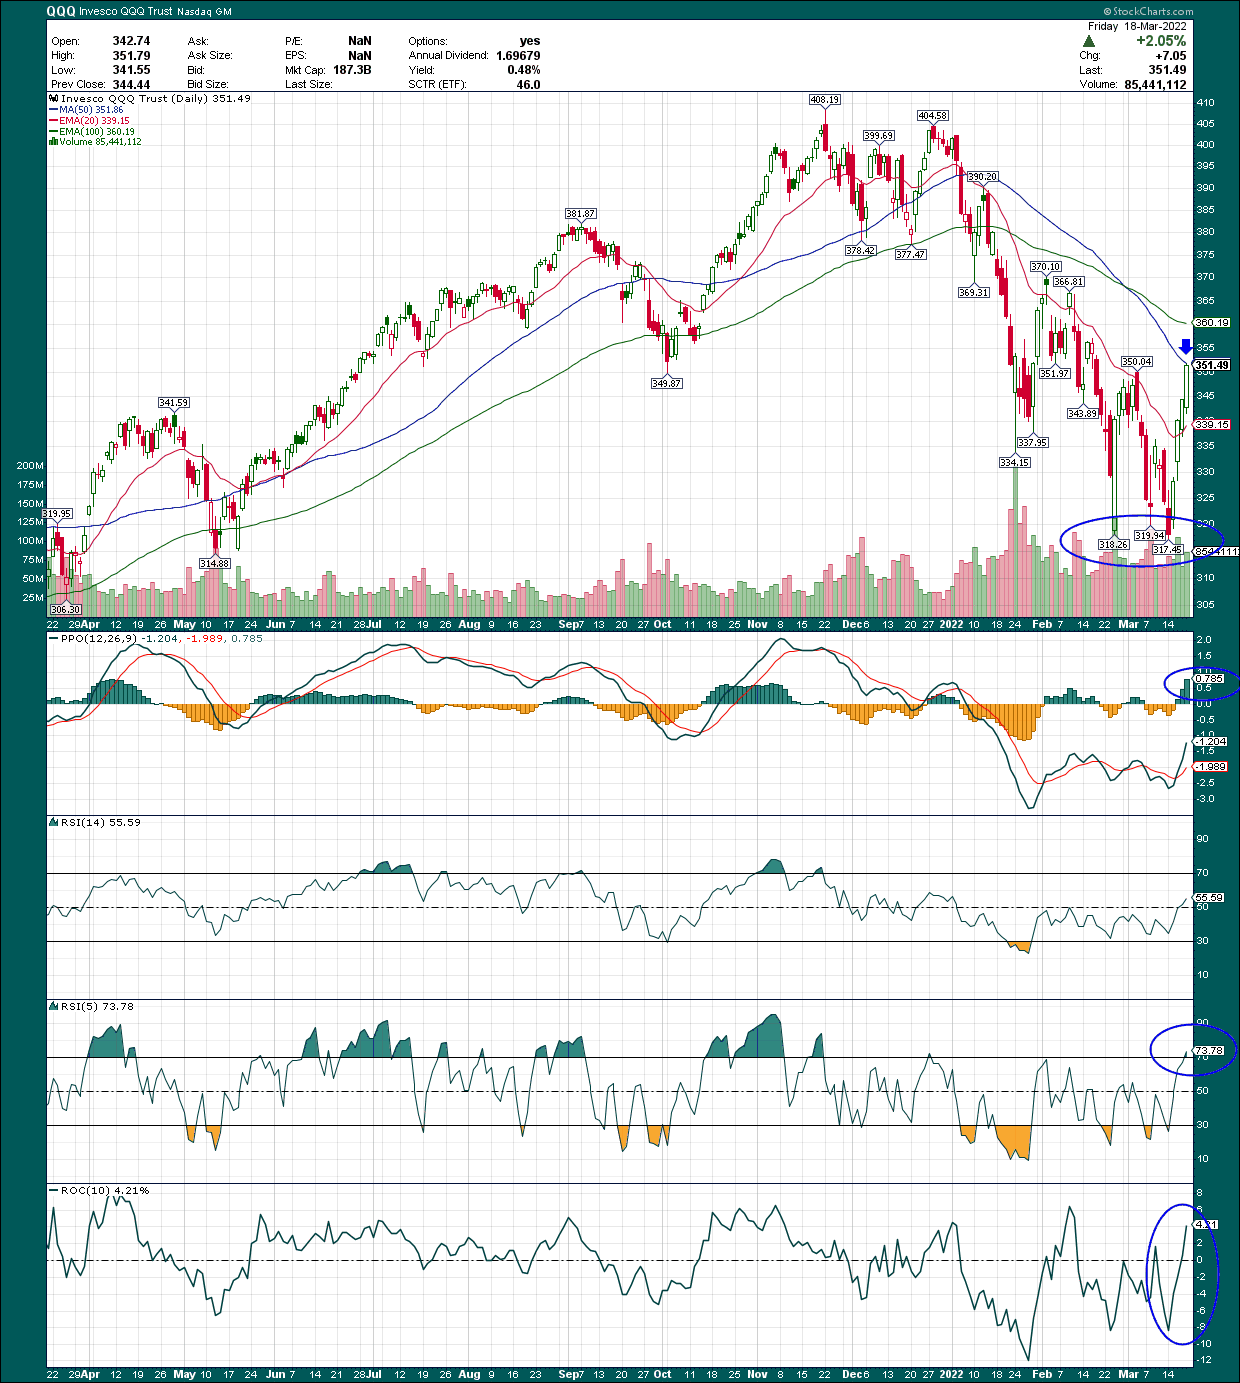
The key points of this chart begin with the triple bottom the Nasdaq (NASDAQ:QQQ) made in the past few weeks at the $317 level. Having a triple bottom in place provides an outstanding launch pad for any kind of bullish move, and what a launchpad it was; we saw a 10% move in the QQQ just last week. That’s an incredible up move in such a short period of time, and I’ll admit it has somewhat damaged my bearish case.
The reason is because the QQQ vaulted and sustained a move over the 20-day exponential moving average, or EMA, which is one of the first signs I look for to determine if a stock/index has bottomed. The second sign is a successful retest of that EMA, which of course, hasn’t occurred yet. When it does, what the QQQ does will be very instructive for the next phase of this move. Does it bounce off the 20-day EMA in a bullish manner and go higher, or do we see a further breakdown. We may get that answer in the coming days.
Now, the QQQ rallied exactly to its 50-day simple moving average in blue, and I’ve placed an arrow where resistance is. Monday will be very interesting because the QQQ has spent at total of one day in 2022 above the 50-day SMA, and that was the first trading day of the year. If this really is a new bullish phase, the 50-day SMA must be crested and sustained. While that’s certainly possible, if we look at the momentum indicators, I think it’s a tall order for the bulls.
The PPO is still very much in bearish territory, and in fact, isn’t even close to being bullish. The one bullish thing about the PPO is that the histogram is nearing +1, but that also means the ETF is overbought on that basis. We can see other examples of the histogram reaching +1 (or thereabouts) and it has signaled that the ETF needs at least a breather, or perhaps a pullback to work that off. It’s no surprise the QQQ is overbought after rising 10% in the space of a few days.
Second, the 5-day RSI is in overbought territory, and while it can become more overbought, it creates another headwind for bulls. The 14-day RSI looks more bullish now as well, having finally crested the centerline after weeks of failing to do so. This is why I said earlier that some damage had been done to the bearish case for this chart, because these are, in fact, bullish developments, and I’m not blind to them. I still think this was an opex-related oversold bounce, but we’re going to find out if I’m right or not very shortly.
Inflation and stock valuations
Let’s now turn our attention to another potential issue for the bulls, which is that of inflation and interest rates. We’re all fully aware of what’s going on with inflation, but let’s recap with a long-term chart. Below I have 20 years of CPI data charted on a monthly basis, along with the one-year rate of change in the bottom panel.
StockCharts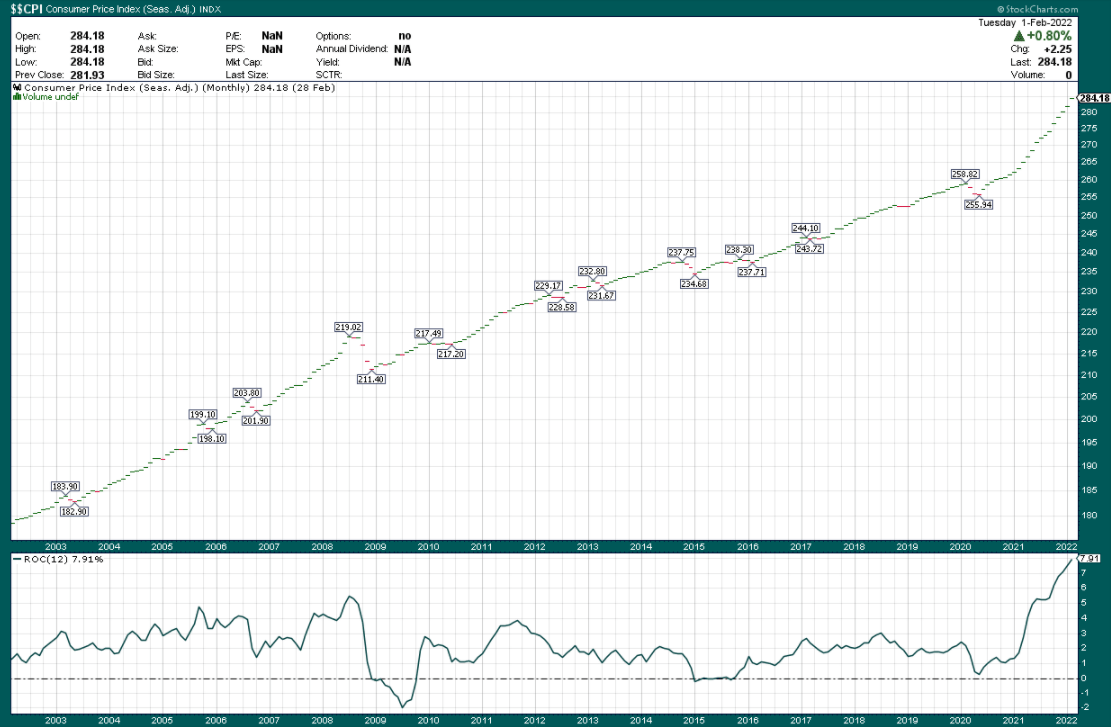
We can see that for the most part, inflation moves gradually higher over time. However, we do get deflationary periods, such as the beginning of the COVID crisis, and they’re generally resolved within a few months. That happened again this time, but instead of a gradual move higher, we’re racing higher. The one-year rate of change is now at 8%, and is likely to move higher for at least one more month given how early-2021 looked. Apart from all the impacts this has on consumers, it also has impacts on interest rates. Since interest rates impact stock valuations, inflation is key, and we’ll illustrate that point now.
Rates are a big potential headwind
Below we have the 10-year Treasury rate and the QQQ’s correlation to that rate below, on a 100-day basis, so it’s a medium-term indicator in this case.
StockCharts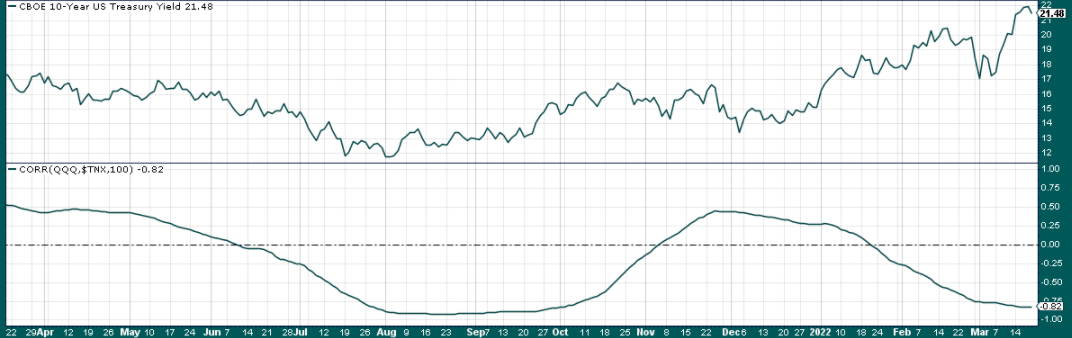
What’s clear is that in general, we’ve seen an inverse relationship between QQQ and TNX, and that makes sense given that if the risk-free rate is higher, the equity risk premium we’ll see in stock valuations must be lower. That drives P/E (or P/S or whatever else) lower because investors can theoretically achieve a higher risk-free return from Treasuries, all else equal.
Indeed, the 100-day correlation between QQQ and TNX is -0.82 right now, it’s a very strong inverse relationship. You might be saying now, so what, why do I care? Well, if inflation continues at a rate of 8% or more, interest rates will go higher. That’s a fact of life and you can look at any period of inflation in our past to see that. Indeed, the period following the Great Recession had extremely low inflation, and we had historic lows in various interest rates; the same thing happens in reverse, and it’s not a coincidence.
Thus, if that pattern follows and we see elevated inflation, we should elevate rates, and therefore, we should see a negative reaction in growth areas in particular, such as the QQQ. That’s something that plays out over weeks or months, not days, so periods of bullishness like last week are to be expected.
Volatility remains an issue
Finally, let’s take a look at the VXN, which is the volatility index for the Nasdaq. This is the same thing as the VIX for the S&P 500; it’s simply a measure of volatility.
StockCharts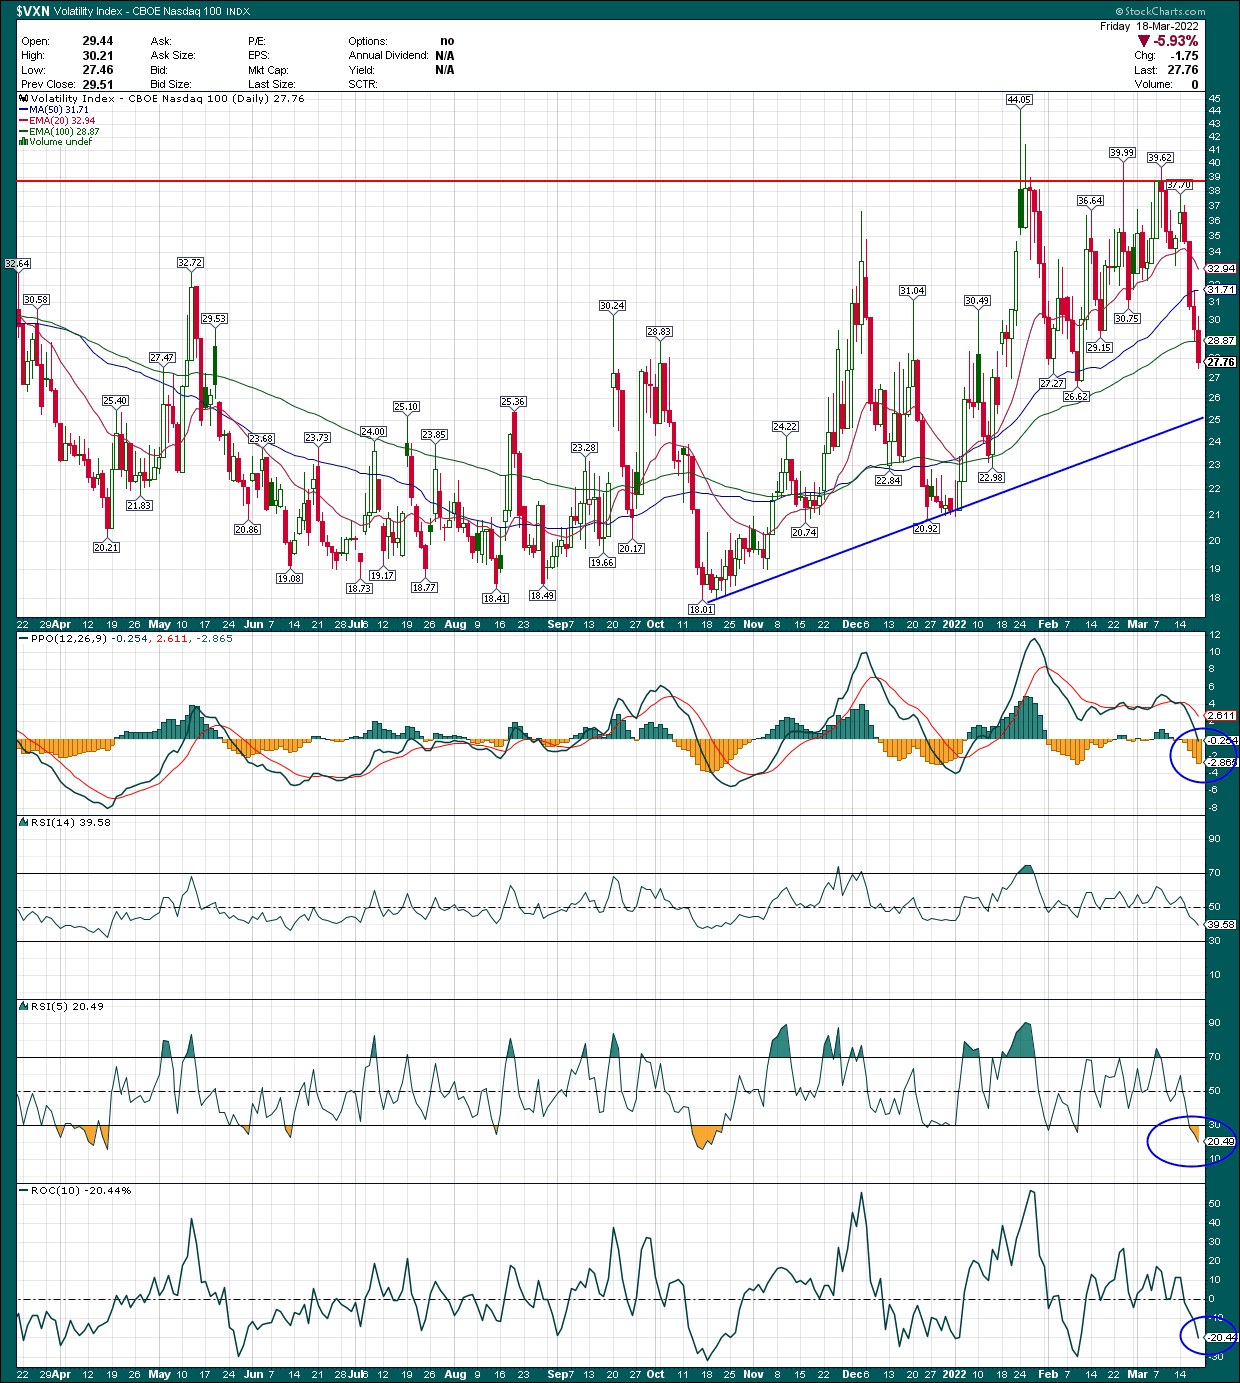
The VXN made a pretty clear top in the area of 39/40 in the past several weeks, which coincided with the near-term bottoms made in the QQQ. That’s normal behavior because volatility readings that high are extremely unusual, so seeing some relief rallies from those extremes isn’t unexpected. However, I think this chart is signaling that investors should remain cautious right now, and like the QQQ chart itself, we’ll get some sort of resolution pretty quickly on this one to determine if I’m right or not.
There’s a trendline that’s rapidly approaching the price of the VXN, which is something the bulls will need to negotiate. It’s about $2 below the current price, and in today’s market a $2 move in the VXN can happen in a few hours, so it’s close.
I also think the momentum indicators are showing the VXN has declined too rapidly, too quickly, and that a snapback is more likely. The PPO is showing a centerline test, coinciding with the histogram showing oversold levels at -3. While the VXN certainly can move lower, this indicates that volatility has likely moved down too quickly.
We see similar behavior in the RSIs, and the 5-day RSI is actually well into oversold territory. When you look at the 10-day rate of change at -20%, you can see why the 5-day RSI is in oversold territory.
Sum it up for me
What all of this means is that we had a market that was extremely bearish and oversold heading into an options expiration week last week. Market makers had literally billions of dollars of incentive to bid share prices up to work off the extreme in-the-money put premium that had accrued, and that’s exactly what happened.
My view is that I’m remaining cautious unless we get a follow through of bullish behavior in the coming week, because a snapback rally from oversold conditions into opex is not exactly a solid foundation for a new rally. Could it happen? Absolutely. Is it going to? I’m not convinced.
Given all of this, I think the bulls have a tough road ahead and I still think we have a pretty good chance of not only revisiting the lows, but breaking down below them in the coming weeks. That opinion is probably pretty unpopular at this stage and I may see some virtual tarring and feathering in the comments. But I think the macro headwinds are too great at the moment for this rally to stick, and I think there’s one more big down move to come before we actually bottom. We shall see.
Be the first to comment