


Dzmitry Dzemidovich
Thesis
Plenty of SA authors, including ourselves, have written bullish arguments about AT&T (NYSE:T). To summarize, the four most common themes are: the valuation is at a secular bottom, the debt has significantly reduced, the operation will be more focused and efficient after the spinoff of the WarnerMedia unit, and the dividends are mouthwatering.
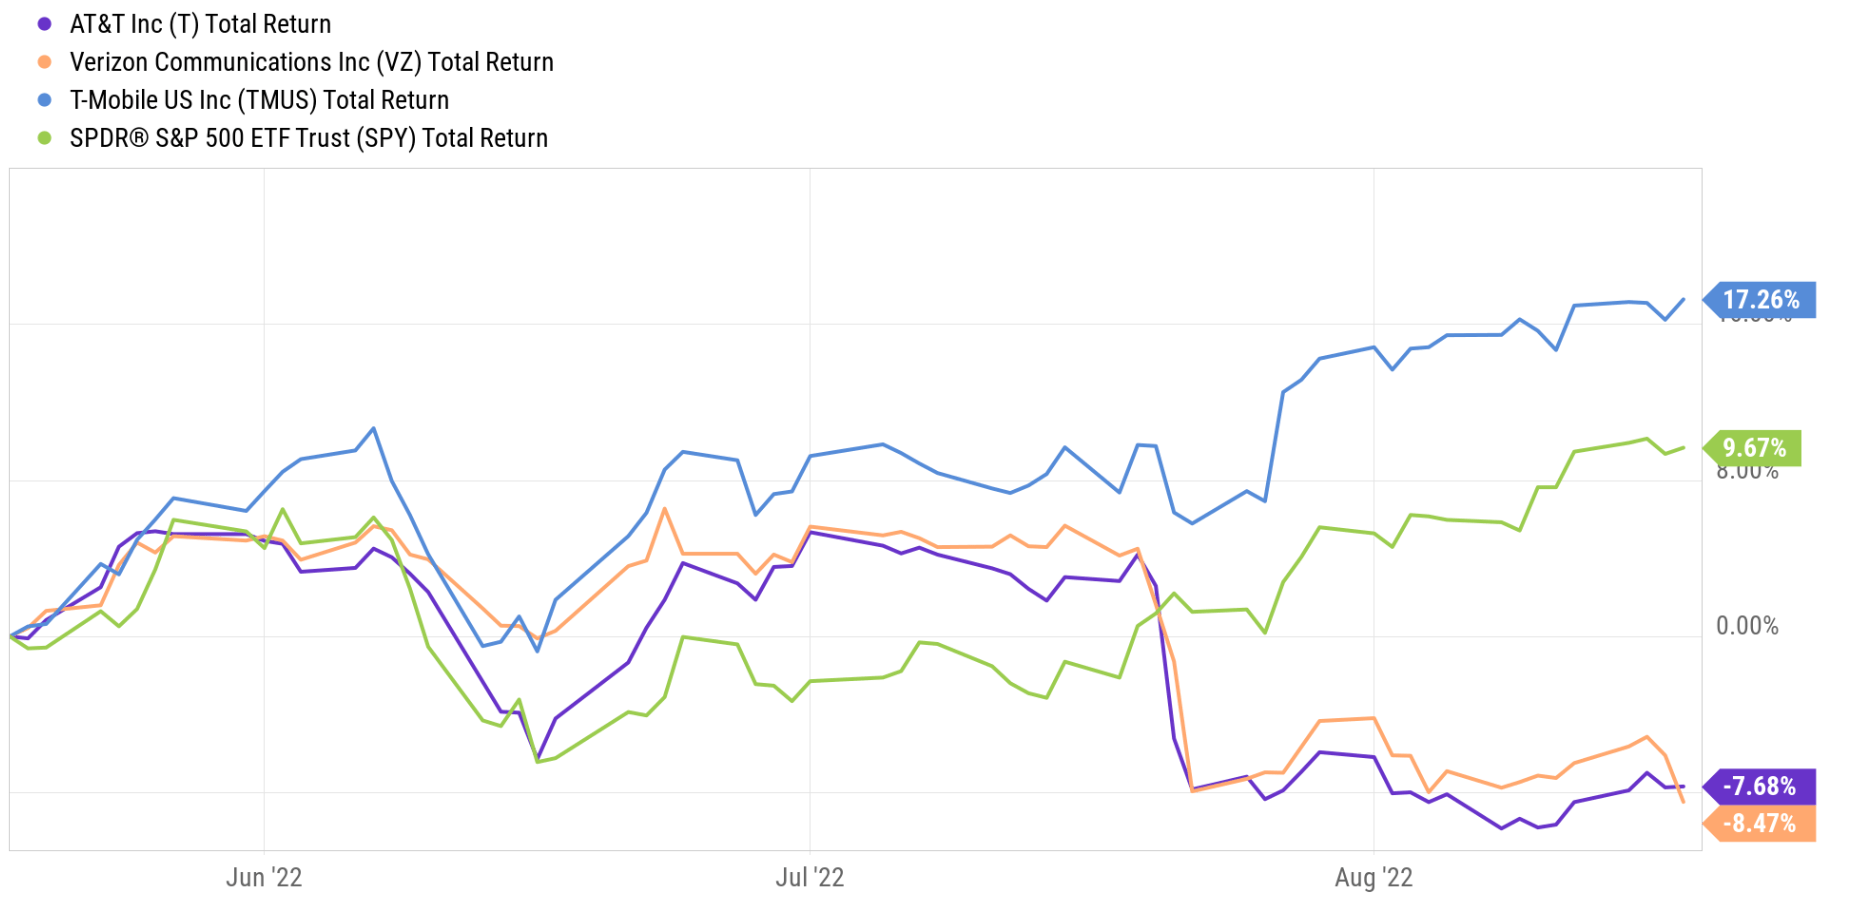
Indeed, there are merits to all these arguments. And there are certainly signs that the large price corrections after its Q2 earnings report have created opportunities for bottom fishing. As you can see from the following chart below, its stock prices have been leading the overall market (represented by SPY) since its Q1 earnings report 3 months ago – until its Q2 ER. After that, its stock prices suffered a correction of more than 10%, turning the previous lead into a lag of more than 18% in the past 3 months.
In the rest of the article, I will examine each of the above arguments more closely. And the goal is to provide a full view to both bears and bulls, so we can all tailor our investment decisions to our risk profiles.
Seeking Alpha
Financial house not completely in order yet
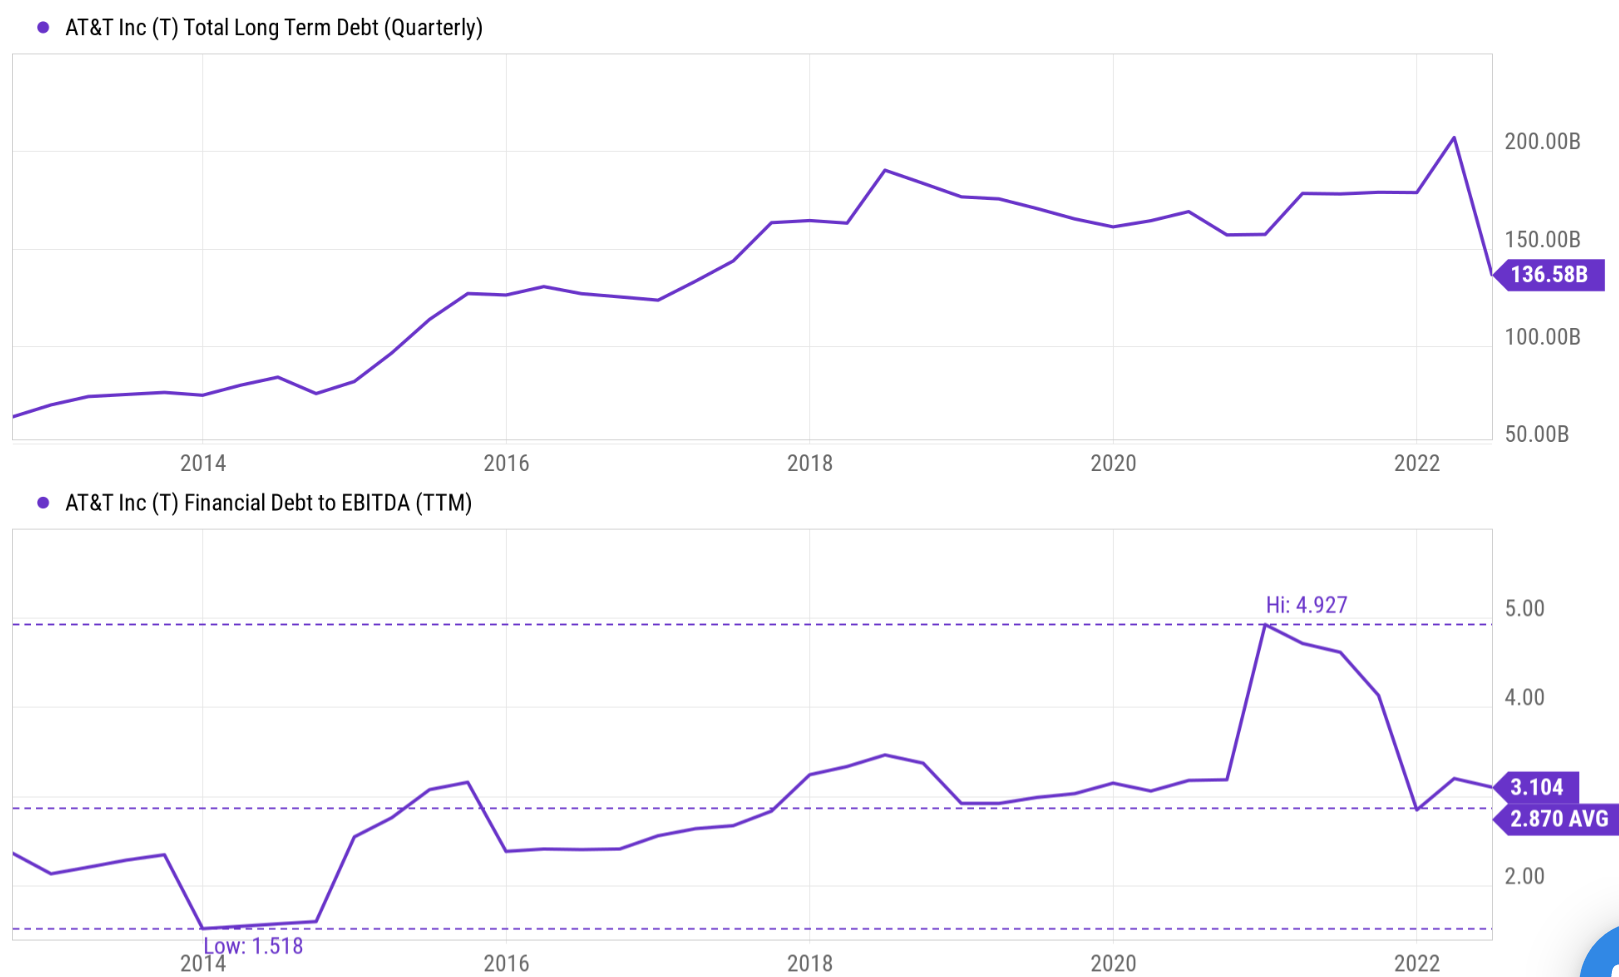
The most common bullish argument involves the substantially deleveraged balance sheet after the completion of the WarnerMedia spinoff. Indeed, T has been carrying a debt burden too heavy and for too long. Long-term debt was nearly $200B before the spinoff. And also indeed, the spinoff has reduced the debt burden to the current $136B, by a whopping $64B. It received roughly $43 billion (a mix of cash, debt securities, and WarnerMedia’s retention of debt) in the transaction and used most of it to pay down debt. The company also repaid $10 billion in short-term bank loans earlier this year.
And as argued in my earlier article, such deleveraging alone can cut enough interest expense and expand the margin by about 115 bps. At the same time, it will also allow T to better focus on its core areas such as 5G and fiber.
Seeking Alpha
However, its financial house is not completely in order yet, probably far from it. As you can see from the bottom panel of the above chart, its leverage ratio is still above its historical average. Its leverage ratio fluctuated between about 1. 5x and 4.9x with an average of 2.87x in the past 10 years. It is true that the debt level has gone down after the spinoff, but its earnings have also gone down too. As a result, its current leverage ratio stands at 3.1x, still about 10% above its long-term average.
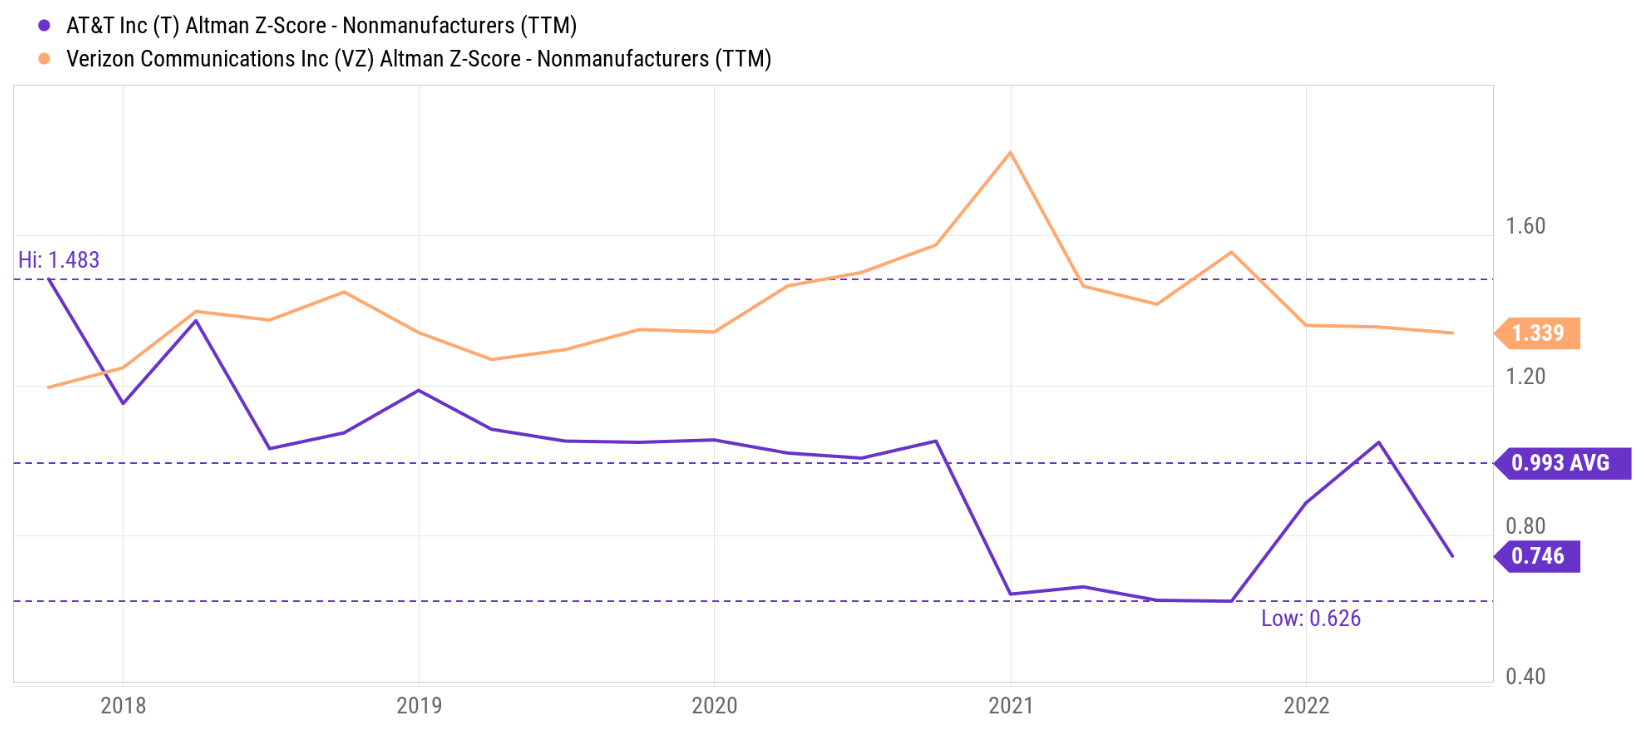
When compared to its close peer Verizon (VZ), its financial strength is even weaker as you can see from the following chart. The chart shows their historical Altman Z-score, a holistic measure of their financial strengths. Note that T’s score has been declining consistently since 2018 and bottomed near 0.6 just before the spinoff.
To put things under perspective, as a general rule of thumb, for manufacturing businesses, an Altman Z-score above 3 indicates solid financial positioning (and close to zero signals non-negligible bankruptcy risks). The spinoff greatly improved its score to be about 1x, close to its historical average. Then the score started deteriorating again due to the recent headwinds.
In contrast, note how much higher and more stable the score for VZ has been. VZ’s score has been consistent around a mean of about 1.4 over the years. Currently, T’s score is 0.74x, far below VZ’s 1.34.
Seeking Alpha
Operation will need time to ramp up
The second most common bullish thesis argues that the spinoff will also allow T to better focus on its core operations, and hence operate with higher efficiency. It is a sound argument that really makes intuitive sense of course. But the results are not going in that direction yet as you can see from the following chart.
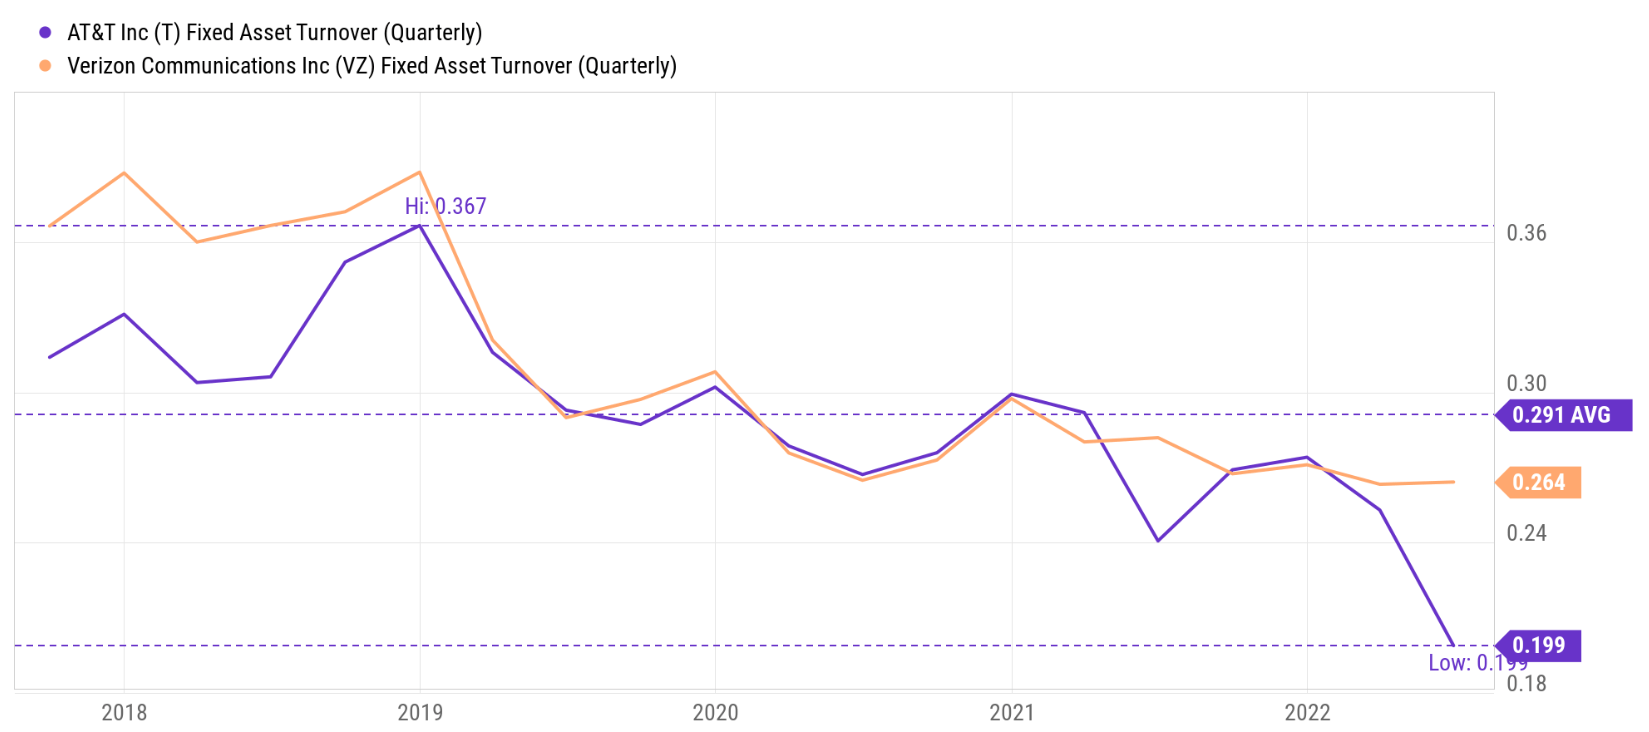
T’s fixed asset turnover has been at a peak level of around 0.33 during 2018. Then it started a gradual decay but has been hovering around 0.30x more or less in the next a few years. After the spinoff, as you can see, its turnover rates plunged to the current level of 0.19x only. I am not saying that the spinoff CAUSED the plunged. Very likely, many other factors such as the ramp-up of its 5G and fiber services, the timing of customer collections during the past quarter, and the chronic decline of its wireline operation.
However, I think the picture is very clear here. Whatever the operational benefits expected from the spinoff have not materialized yet, and it will take time to materialize. The picture is even clearer when we compare its operation again VZ as shown. VZ’s operation efficiency has also seen a gradual decline in the past few years since 2018, almost in tandem with T. However, VZ’s operation has demonstrated far superior resilience, even during the pandemic. And now VZ’s asset turnover rate is at 0.26x, substantially higher than T (by almost 1/3).
Seeking Alpha
Dividends not as attractive as on the surface
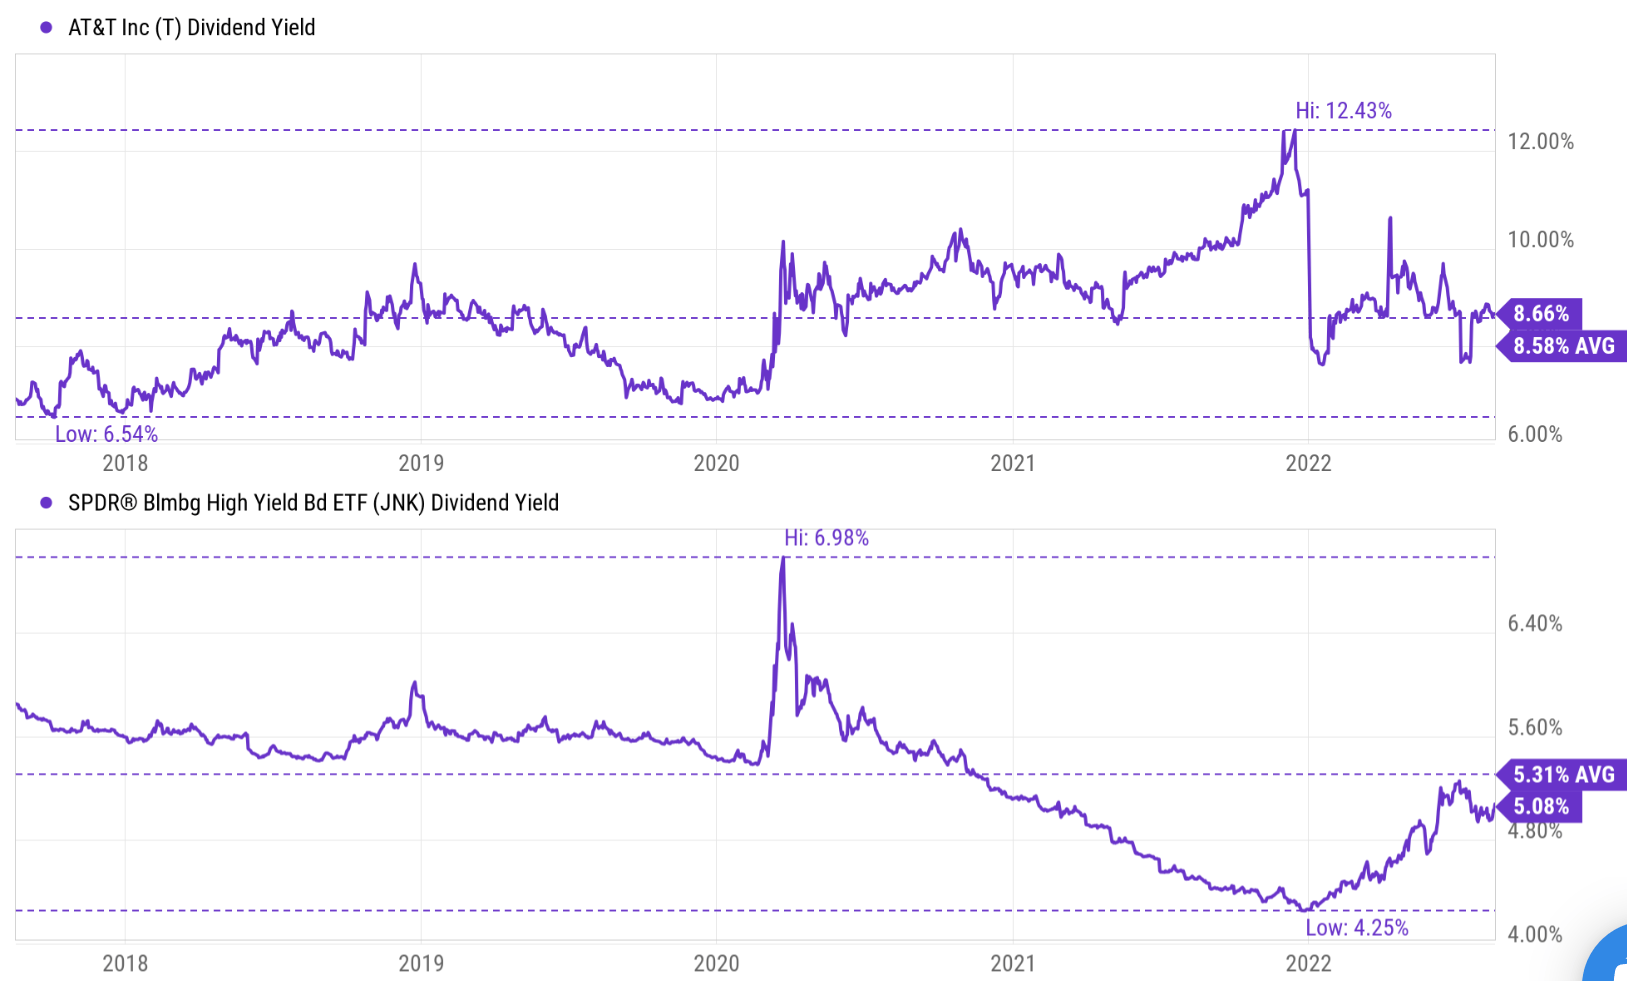
The dividend yield is the next most common bullish argument. Indeed, T’s current yield of 8.66% is nothing to be sneered at in absolute terms.
However, the picture is not as attractive in relative terms. First, let’s compare it against its own historical record. Its dividend yield has fluctuated in a range between about 6.5% to about 12.4% with an average of 8.58%. As a result, its current yield of 8.66% is really only on par with its historical average.
Next, let’s compare its dividend to a high yield index: Moody’s Seasoned BAA Corporate Bond Yield (referred to as the BAA bond yield hereafter). Given T’s financial strengths argued above, I feel it is fitting to compare it against BAA bonds. And the bottom panel of the chart shows the yield of T relative to the BAA Yield approximated by the yield from SPDR Bloomberg Barclays High Yield Bond ETF (JNK).
As seen, the JNK yield reached a bottom in later 2022 after Fed’s epic QE was near only 4.25%. At that time, T’s yield of 12.4% is more than 8% above the JNK yield – a perfect time to buy T. But of course, we cannot rely on perfect timing (and we do not need to) for investment returns. Since then, the JNK yield has risen sharply to the current level of 5.1% as Fed reverses the QE to a monetary tightening. And the yield spread between T and JNK has narrowed to about 3.5% currently (8.66% – 5.1%). And here again, the yield spread is on par with historical averaging, showing no clear sign of discount compared to JNK bond yields.
Seeking Alpha
Valuation not that cheap
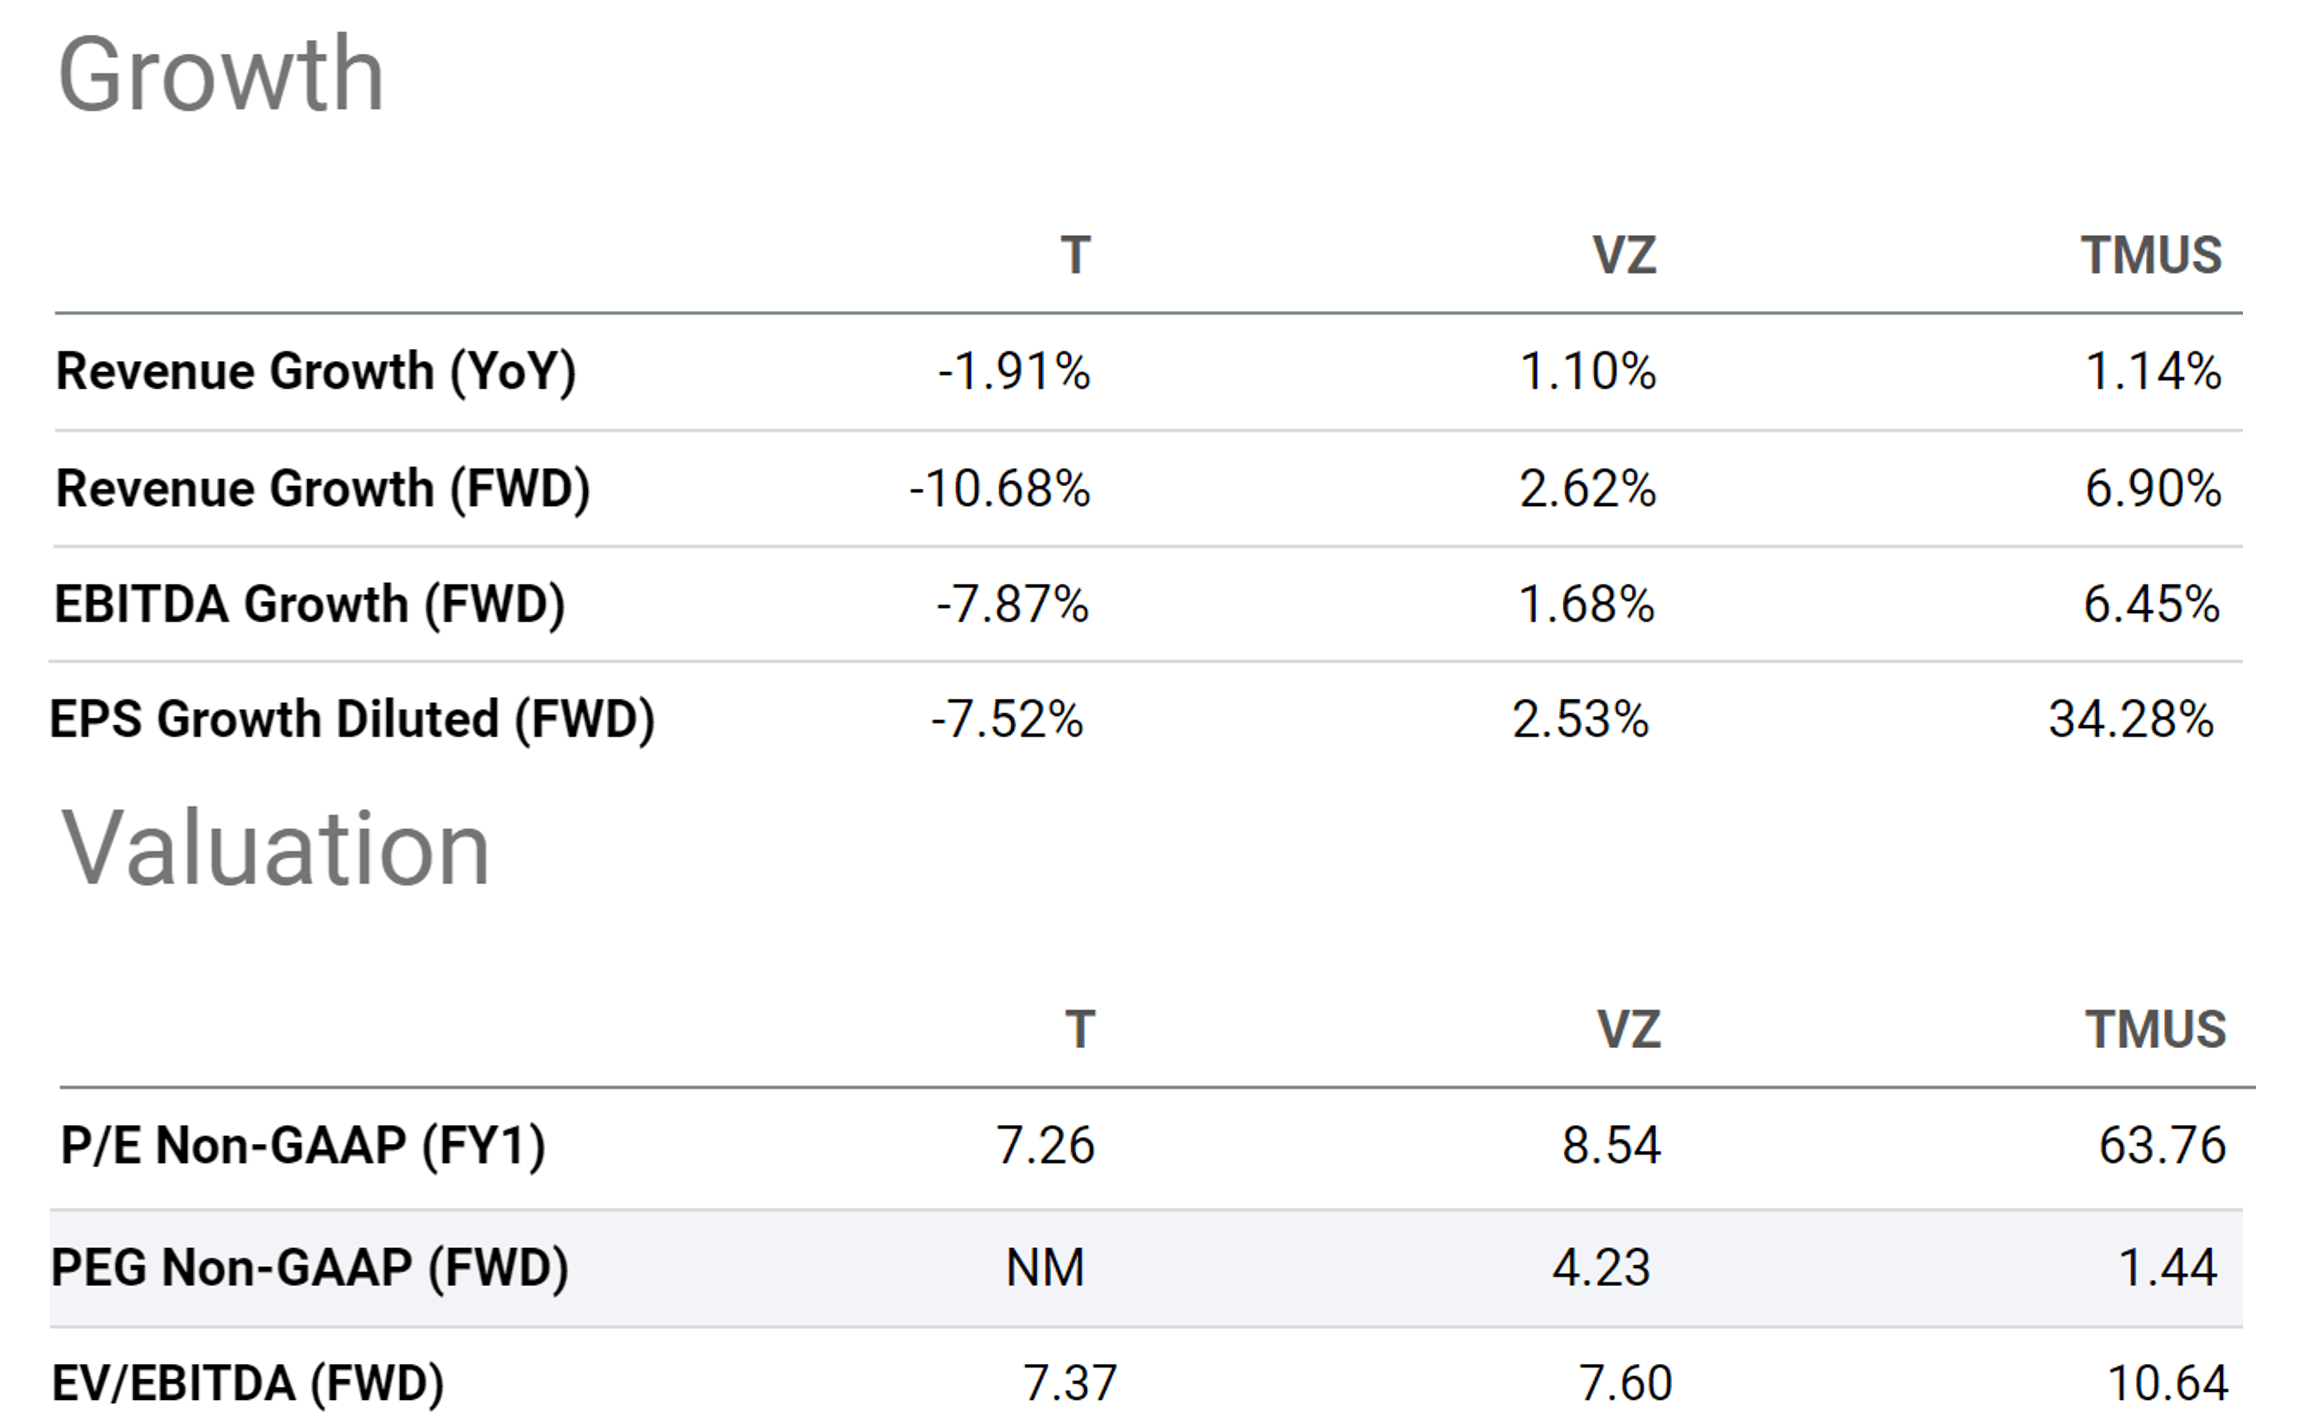
Finally, the valuation may be cheap in absolute terms but certainly not that cheap when put in perspective. As you can see, its forward PE is 7.26x only, indeed attractive. However, when compared with its peers, especially when adjusted for growth, its valuation is not that cheap at all, or probably even more expensive.
You can see VZ is trading at 8.54x FW PE, which is indeed about 17% above T. But remember that T has a higher leverage and worse financial strength than VZ as mentioned above. Therefore, leverage-adjusted valuation metrics are more appropriate here. And when the leverage is adjusted, the valuation gap is narrower. For example, in terms of EV/EBITDA ratio, T is currently priced at 7.37x and VZ at 7.6x. The difference is only 3% here.
When you adjust the valuation by growth rates, T becomes not only cheaper but actually more expensive than its other peers. Its revenue growth year-over-year has been a – 1.9%, while both VZ and T-Mobile (TMUS) have posted positive growth. Looking forward, the projected growth for T is negative on both lines. Its revenues are expected to contract by 10% next year. In terms of bottom lines, its EBITDA growth is projected to be – 7.8% and EPS growth rate to be – 7.5%. So in terms of FW PEG ratios, T Is actually the most expensively valued one here.
Seeking Alpha
Final thoughts and other risks
I am a long-term bull on T as mentioned upfront. Hence, I am very familiar with the bull’s arguments. The most common bullish thesis surrounding T includes lower debt, more focused operation, attractive dividend yield, and attractive valuation. However, I think it is equally important for me to be familiar with the bears’ arguments too. I am bullish because the risk/reward profile fits my tolerance, and I view the risks properly compensated by the return potentials in the long-term. And potential investors should consider their risk tolerance and timeframe before engaging. For example, less risk-prone investors could consider VZ, a more conservative option with strong financials.
Indeed, upon close examination, each of these arguments has its caveats. The debt is lower in absolute terms by $64B. But leverage is still higher than average and financial strength is significantly weaker than VZ. Operation is at a bottom level since 2018 in terms of fixed asset utilization and is yet to ramp up. The dividend yield of 8.6% is on par with historical too, and so is the yield spread against BAA bonds. Finally, valuation is not cheaper after leverage is adjusted for, and is even more expensive than VZ when growth is adjusted for.
Besides the above issues, there is a risk that their ongoing CAPEX projects can run overbudget too. Their CAPEX projects typically have extended lifecycles. And such overbudget risks are further compounded by the ongoing inflation hikes and labor shortages.
Be the first to comment