

Yuuji/iStock via Getty Images
Investment Summary
Defensive healthcare looks well positioned to catch a bid in the current investment landscape as investors turn to factors of quality and resiliency. Earnings quality and fundamental momentum are paramount to overcome the deep drawdowns experienced across equity markets in FY22.
With that, we look to Atrion Corporation (NASDAQ:ATRI), a low volatility offering with extensive business history and deep customer networks. ATRI is ideal for investors seeking to add a defensive overlay to equity portfolios, and shares look attractively priced by our estimation. There’s also the $2.15 recently declared dividend [+10.3% YoY] that is not discussed here. We rate ATRI a buy $632 price target.
Atrion Q2 earnings: in-line with mature growth cycle
ATRI came in with a strong set of numbers once again, with top-line growth of 14% printing quarterly revenue of $48.9 million (“mm”). The bolus of upside was driven by a 37% YoY gain in cardiovascular revenues, and ‘other’ revenues of 14%, offset by weakness in fluid delivery and ophthalmology, as seen in Exhibit 1.
Meanwhile, COGS saw a 13% YoY gain due to the higher revenue volumes, whereas inventories lifted by ~690bps YoY. The spike in inventory value was driven by a 13% increase in raw material value, in-line with market trends and the commodity bull run of the past 12 months. This resulted in a gross profit of $20.8mm, up 16.6% YoY on a gross margin of 42.6%.
Exhibit 1. The cardiovascular business continues to be the major performer on a sequential basis.
- Revenue split continues to shift toward a more even distribution towards cardiovascular.
- Cardiovascular margin is now ~37% of turnover in Q2 FY22.
Note: Adapted from ATRI Q2 FY22 10-Q (Image: HB Insights. Data: ATRI)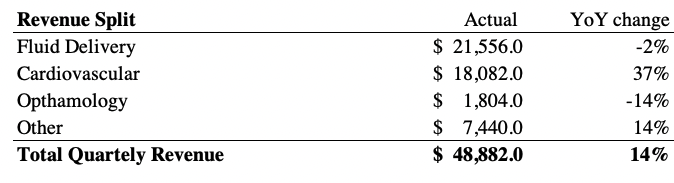
As seen in Exhibit 2, quarterly operating trends have been consistently buoyant for ATRI from FY15-date. Both turnover and operating profit have ticked up from low-points during the pandemic, whereas FCF [net of dividends] has been narrowing from FY20-date. We note the QoQ decline in FCF yield that investors have realized over this time, which, at face value looks to be quite alarming.
Exhibit 2. Quarterly operating metrics demonstrate the resiliency on offer, with sales and pre-tax earnings both lifting back above pre-pandemic levels.
Noted is the declining FCF yield on tighter FCF conversion, however, as we discuss below, this is coupled with favorable return on investment to justify the case.
Note: [All earnings figures in $mm or %]. Quarterly operating measures are plotted against TTM FCF yield to observe effect of invested capital and return on invested capital. Calculations are made from GAAP earnings with no reconciliations. (Image: HB Insights; Data: ATRI SEC Filings)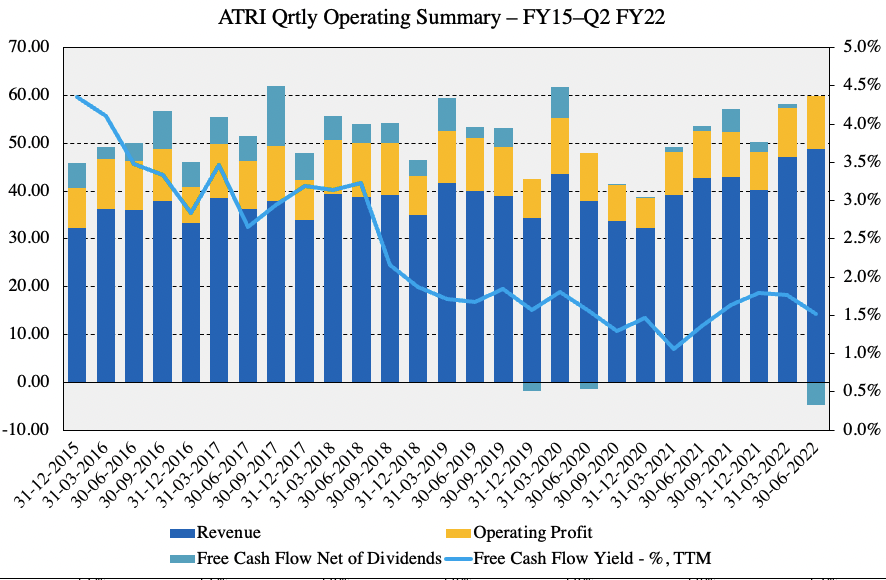
In light of the tightening FCF and FCF yields our findings illustrate that ATRI’s return on investment has remained in the double digits across the examination period. Whilst FCF [net of dividends] has narrowed sequentially, ROIC has remained high and curled up since late FY21 on a TTM basis, as seen in Exhibit 3. This tells us the company is amid a strong capital budgeting cycle that has seen it invest more than it made during the period [in Q2 FY22 in particular]. The combination of negative FCF and rising return on investment is a favorable combination that is incredibly attractive in the current climate.
Exhibit 3. Despite tightening FCF and realized FCF yields since FY15, ATRI continuously delivers double-digit return on investment that comfortably outpaces the WACC hurdle of 5% by ~2.8 turns.
Note: All figures are in $mm or %. Invested capital is calculated with capitalized R&D investment from the income statement. (Image: HB Insights. Data: ATRI SEC filings)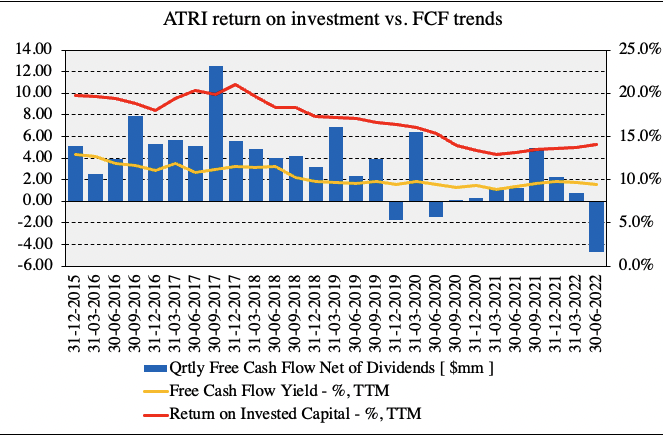
Valuation
Shares are trading at 32x trailing earnings, ahead of the sector median’s 26.6x. The stock is also priced at 4.5x book value, again a step above the sector’s 2.2x. We need to understand what we’re buying in ATRI. Valuation is a combination of investment, return on investment and earnings by our estimate – what’s real, and what’s expected.
At the 4.5x multiple, we’d theoretically be paying $616 in book value per share based on ATRI’s current shares outstanding. Note, the $616 is an implied price, not the current share price. It is calculated by multiplying ATRI’s book value of equity by the 4.5x, and dividing this by shares outstanding. This suggests that shares are at least fair and reasonably priced at the current market cap.
However, it’s not unreasonable to believe we are getting shares cheap based on the company’s return on investment, shown in Exhibit 3. In terms of the earnings part of corporate value, we believe shares are worth $632 per share or a 33.29x forward P/E based on the calculations seen in Exhibit 4. This is based on a normalized EPS of $18.99 and fair cost of equity of ~300bps.
Exhibit 4. We prescribe a price target of $632 based on a forward P/E of 33.29x.
Note: Earnings yield based on TTM EPS. Normalized EPS calculated as TTM 3-year quarterly average. For more data on fair forward P/E see: Mauboussin & Callahan [2014] “What does a Price-Earnings Multiple Mean? An Analytical Bridge between P/Es and Solid Economics,” Credit Suisse Global Financial Strategies; January 2014. (Data: HB Insights Estimates)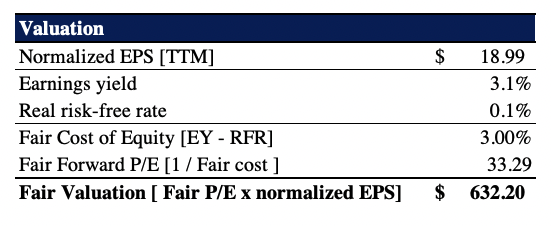
Conclusion
Based on the multivariate inputs discussed above we believe that ATRI offers attractive value. The defensive nature of its business model and share price returns are ideal for those investors seeking to add a defensive overlay to equity portfolios, albeit at a reasonable valuation. Whilst shares are priced high in absolute terms, this is more than justified by substantial business history and the company’s deep customer networks. We rate ATRI a buy on a $632 valuation.
Be the first to comment