

SAC/iStock via Getty Images
Earnings of Associated Banc-Corp (NYSE:ASB) will most probably continue to rise in 2023 on the back of continued margin expansion. Further, healthy pipelines and investments in technology will likely lift loan balances, which will in turn help earnings. Overall, I’m expecting Associated Banc-Corp to report earnings of $2.38 per share for 2022, up 9%, and $2.66 per share for 2023, up 12% year-over-year. Compared to my last report on the company, I’ve revised upwards my margin estimates for both years mostly because I’ve increased my margin and loan balance estimates. The December 2023 target price suggests a high upside from the current market price. Based on the total expected return, I’m maintaining a buy rating on Associated Banc-Corp.
Higher Deposit Beta to Slow the Margin Expansion
Associated Banc-Corp’s net interest margin surged by 42 basis points in the third quarter after growing by 29 basis points in the second quarter of 2022. The margin will continue to expand through at least the mid of 2023 because of the ongoing up-rate cycle. I’m expecting the fed funds rate to increase by a further 50 basis points in the first half of the year before stabilizing in the second half. The results of the management’s interest-rate sensitivity analysis given in the 10-Q filing show that a 200-basis points hike in interest rates could boost earnings by 6.8% over twelve months.
3Q 2022 10-Q Filing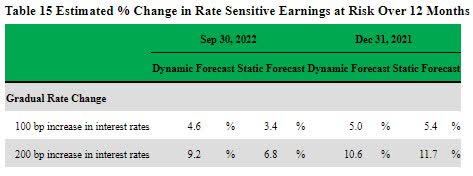
Part of this rate sensitivity is attributable to a favorable earning-asset mix. As mentioned in the November presentation, around 46% of the loan portfolio carries floating or adjustable rates; therefore, the average loan yield is quite rate-sensitive. Moreover, fixed-rate loans maturing within a year made up a sizable 28% of total loans.
Going forward, the pace of margin expansion will dip because the deposit beta (rate sensitivity) will rise due to the following reasons.
- Associated Banc-Corp’s deposit mix has worsened during the first nine months of 2022. Adjustable-rate deposits, including money market, savings, and interest-bearing demand accounts made up 67% of total deposits at the end of September 2022, up from 65% at the end of December 2021.
- Delay tactics can no longer benefit deposit costs. In previous quarters, Associated Banc-Corp could hold down deposit rates by delaying the impact of market interest rates on deposit rates. Any further delay can lead to Associated Banc-Corp losing its customers; therefore, it’s time the benefit of high-interest rates is passed on to the depositors.
- As interest rates are higher now compared to the mid of 2022, there is more incentive for depositors to do the necessary paperwork and move their funds from non-interest-bearing deposit accounts to higher-yielding accounts.
Considering these factors, I’m expecting the margin to have increased by ten basis points in the last quarter of 2022. Further, I’m expecting the margin to grow by eight basis points in 2023. Compared to my last report on Associated Banc-Corp which was issued in August 2022, I’ve revised upwards by margin estimate because the margin expansion during the third quarter exceeded my expectations. Moreover, the fed funds rate is now projected to rise to a higher level than my previous expectations.
Pipelines, Technological Investments to Sustain Loan Growth
Associated Banc-Corp’s loan growth continued to remain quite strong during the third quarter after a remarkable second quarter. The portfolio grew by 5% during the third quarter, or 20% annualized, which is quite high considering Associated Banc-Corp’s history. Going forward, loan growth will decline to a more normal level because of high-interest rates, which will discourage borrowing. The management also mentioned in the conference call that the pace of growth during the third quarter will not continue in the fourth quarter. However, the management mentioned that the pipelines were still quite healthy. The management was particularly positive about commercial loan pipelines.
Further, the upgradation of Associated Banc-Corp’s digital platform will expand capabilities. The resultant improvement in customer relationships will ensure that customers return to the bank for future credit requirements. The management mentioned in the conference call that during the third quarter, it launched the most significant digital upgrade in the company’s history and that it planned to make regular upgrades going forward.
Considering these factors, I’m expecting the loan portfolio to have grown by 1.5% in the last quarter of 2022, taking full-year loan growth to 16.7%. For 2023, I’m expecting the portfolio to grow by 6%. Compared to my last report on the company, I’ve raised my loan growth estimates for 2022 because the third quarter’s performance beat my previous expectations.
Meanwhile, I’m expecting other balance sheet items to grow mostly in line with loans. The following table shows my balance sheet estimates.
| Financial Position | FY18 | FY19 | FY20 | FY21 | FY22E | FY23E |
| Net Loans | 22,702 | 22,620 | 24,068 | 23,945 | 27,937 | 29,652 |
| Growth of Net Loans | 10.6% | (0.4)% | 6.4% | (0.5)% | 16.7% | 6.1% |
| Other Earning Assets | 7,638 | 6,077 | 5,577 | 7,576 | 6,979 | 7,263 |
| Deposits | 24,897 | 23,779 | 26,482 | 28,466 | 29,637 | 31,455 |
| Borrowings and Sub-Debt | 4,527 | 4,195 | 2,435 | 2,225 | 4,354 | 4,531 |
| Common equity | 3,524 | 3,665 | 3,737 | 3,832 | 3,767 | 4,000 |
| Book Value Per Share ($) | 20.8 | 22.5 | 24.3 | 25.5 | 25.1 | 26.6 |
| Tangible BVPS ($) | 13.4 | 14.7 | 16.7 | 17.8 | 17.4 | 18.9 |
| Source: SEC Filings, Author’s Estimates(In USD million unless otherwise specified) | ||||||
Expecting Earnings to Grow by 12%
The anticipated margin expansion and loan growth will drive earnings in 2023. On the other hand, inflation-driven growth of operating expenses will restrain earnings growth. I’m expecting the efficiency ratio (calculated as non-interest expenses divided by total revenues) to rise to 62% in 2023 from 58% in the third quarter of 2022. Meanwhile, I’m expecting provisioning to remain near a normal level. I’m expecting the net provision expense to make up 0.11% of total loans in 2023, which is the same as the average for the last five years.
Overall, I’m expecting Associated Banc-Corp to report earnings of $2.38 per share for 2022, up 9% year-over-year. For 2023, I’m expecting earnings to grow by 12% to $2.66 per share. The following table shows my income statement estimates.
| Income Statement | FY18 | FY19 | FY20 | FY21 | FY22E | FY23E |
| Net interest income | 880 | 836 | 763 | 726 | 946 | 1,170 |
| Provision for loan losses | – | 16 | 174 | (88) | 21 | 32 |
| Non-interest income | 356 | 381 | 514 | 332 | 292 | 272 |
| Non-interest expense | 822 | 794 | 776 | 710 | 750 | 889 |
| Net income – Common Sh. | 323 | 312 | 286 | 334 | 358 | 400 |
| EPS – Diluted ($) | 1.90 | 1.91 | 1.86 | 2.18 | 2.38 | 2.66 |
| Source: SEC Filings, Author’s Estimates(In USD million unless otherwise specified) | ||||||
In my last report on Associated Banc-Corp, I projected earnings of $2.25 per share for 2022 and $2.43 per share for 2023. I’ve raised my earnings estimates mostly because I’ve revised my margin and loan growth estimates.
My estimates are based on certain macroeconomic assumptions that may not come to fruition. Therefore, actual earnings can differ materially from my estimates.
High Total Expected Return Justifies a Buy Rating
Associated Banc-Corp usually increases its dividend in the last quarter of the year. Given the earnings outlook, I’m expecting the company to increase its dividend by $0.01 per share to $0.22 per share in the last quarter of 2023. The earnings and dividend estimates suggest a payout ratio of 32% for 2023, which is close to the five-year average of 35%. Based on my dividend estimate, Associated Banc-Corp is offering a forward dividend yield of 3.7%.
I’m using the historical price-to-tangible book (“P/TB”) and price-to-earnings (“P/E”) multiples to value Associated Banc-Corp. The stock has traded at an average P/TB ratio of 1.36 in the past, as shown below.
| FY18 | FY19 | FY20 | FY21 | Average | ||
| T. Book Value per Share ($) | 13.4 | 14.7 | 16.7 | 17.8 | ||
| Average Market Price ($) | 25.6 | 21.0 | 15.0 | 21.3 | ||
| Historical P/TB | 1.91x | 1.43x | 0.90x | 1.20x | 1.36x | |
| Source: Company Financials, Yahoo Finance, Author’s Estimates | ||||||
Multiplying the average P/TB multiple with the forecast tangible book value per share of $18.9 gives a target price of $25.7 for the end of 2023. This price target implies a 10.5% upside from the January 13 closing price. The following table shows the sensitivity of the target price to the P/TB ratio.
| P/TB Multiple | 1.16x | 1.26x | 1.36x | 1.46x | 1.56x |
| TBVPS – Dec 2023 ($) | 18.9 | 18.9 | 18.9 | 18.9 | 18.9 |
| Target Price ($) | 21.9 | 23.8 | 25.7 | 27.6 | 29.5 |
| Market Price ($) | 23.3 | 23.3 | 23.3 | 23.3 | 23.3 |
| Upside/(Downside) | (5.8)% | 2.3% | 10.5% | 18.6% | 26.7% |
| Source: Author’s Estimates |
The stock has traded at an average P/E ratio of around 10.6x in the past, as shown below.
| FY18 | FY19 | FY20 | FY21 | Average | ||
| Earnings per Share ($) | 1.9 | 1.9 | 1.9 | 2.2 | ||
| Average Market Price ($) | 25.6 | 21.0 | 15.0 | 21.3 | ||
| Historical P/E | 13.5x | 11.0x | 8.0x | 9.8x | 10.6x | |
| Source: Company Financials, Yahoo Finance, Author’s Estimates | ||||||
Multiplying the average P/E multiple with the forecast earnings per share of $2.66 gives a target price of $28.2 for the end of 2023. This price target implies a 21% upside from the January 13 closing price. The following table shows the sensitivity of the target price to the P/E ratio.
| P/E Multiple | 8.6x | 9.6x | 10.6x | 11.6x | 12.6x |
| EPS 2023 ($) | 2.66 | 2.66 | 2.66 | 2.66 | 2.66 |
| Target Price ($) | 22.8 | 25.5 | 28.2 | 30.8 | 33.5 |
| Market Price ($) | 23.3 | 23.3 | 23.3 | 23.3 | 23.3 |
| Upside/(Downside) | (1.9)% | 9.5% | 21.0% | 32.4% | 43.9% |
| Source: Author’s Estimates |
Equally weighting the target prices from the two valuation methods gives a combined target price of $26.9, which implies a 15.7% upside from the current market price. Adding the forward dividend yield gives a total expected return of 19.4%. Hence, I’m maintaining a buy rating on Associated Banc-Corp.
Be the first to comment