

Creativeye99/E+ via Getty Images
Introduction
Since its inception nearly eight years ago, the brainchild of Cathie Wood- ARK Investment Management, has upended the broad ETF ecosystem by crafting a bunch of actively-managed thematic growth portfolios that focus on disruptive companies. In this article, we will review the qualities, the performances, and the prospects of two of its most popular ETF products- a) The ARK Innovation ETF (NYSEARCA:ARKK), and b) The ARK Next Generation Internet ETF (NYSEARCA:ARKW).
Key Metrics, And The Differences Between ARKK And ARKW
ARKK is widely perceived to be ARK Investment Management’s flagship product, and that is mirrored in a significant AUM of over $7bn (which is more than 5x greater than ARKW’s corresponding figure of less than $1.5bn). This only reiterates ARKK’s innate popularity within the investment community, as it was ARKW that first came to the bourses in late Sep 2014 (ARKK came on board, exactly a month later).
ARKK’s popularity can also be validated by the daily level of shares that are exchanged on average; this typically works out to around 31.2m shares, which is around 20x the volume witnessed in the ARKW counter. Incidentally, this also translates into average daily spreads of just $0.01 (ARKW’s corresponding figure is $0.03) which makes it a very apt vehicle for short-term trading bets as well.
So what do these two portfolios focus on? Well, ARKW focuses on next-gen internet stocks (both domestic and foreign) that would benefit from the proliferation of cloud and mobile technologies, cyber security, new payment methods, blockchain, P2P, e-commerce, AI, Big data, and IoT.
ARKK on the other hand, is much broader in scope, covering not just some of the sectors that ARKW is exposed to, but also those involved in DNA Tech and genomic revolution, energy storage & energy transformation, fintech innovation, automation, and robotics. The goal here is to find disruptive innovators or those stocks that have introduced or are poised to introduce, tech-focused products or services that could change the way the world works. ARKW is also more dedicated to its focus theme of next-gen internet, as typically, at least 80% of its assets are oriented towards stocks that are linked to this theme; with ARKK, it appears that the standards are less rigid, as typically, the minimum expectation is only for 65% of its assets to be driven by the disruptive innovation theme.
Before I get to some of the other differences, I also want to state that there’s some heavy overlap between the two portfolios (ARKW has 37 stocks and ARKK has 36 stocks); just for some context, note that 19 out of the 37 stocks of ARKW (which incidentally have an aggregate weight of 73%) are repeated in the ARKK portfolio as well; however, the aggregate impact of those 19 stocks in ARKK is a lot lower, with a weight of only 65%.
When it comes to some of the major differences, it’s fair to say that ARKW is more oriented toward the large-cap stocks (mega-caps and large-caps account for 71% of ARKW’s portfolio vs 54% weight for ARKK) and this is also reflected in a much higher median market-cap of ~$20bn. On the other hand, ARKK’s median market cap of $5bn makes it more of a mid-cap-based product, whilst only 13% of ARKW’s holdings are mid-caps. Incidentally, both portfolios have roughly the same number of small-cap stocks.
ARKK and ARKW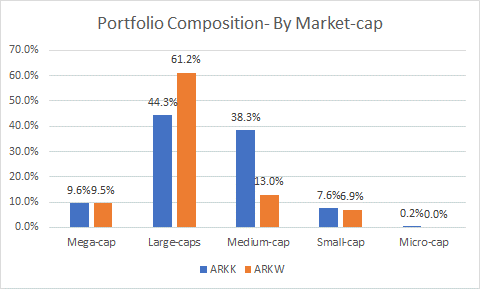
As far as cost-efficiency and stability go, ARKK appears to be the more favorable product for long-term investors. ARKK’s total expense ratio works out to 0.75% as opposed to ARKW’s figure of 0.83%; ARKW’s number is higher because, in addition to the standard 0.75% management fee that both ETFs incur, ARKW also faces additional expenses to the tune of 0.08% that arise due to its investment in other ETFs and money market funds.
Also note that ARKW’s portfolio tends to witness inordinate churn, as exemplified by an annual portfolio turnover rate of 120% (ARKW’s corresponding figure is 71%). This won’t have any impact on the annual expense ratio, but frequent buying and selling of shares will lead to considerable transaction costs and it could also lead to tax inefficiencies if the shares are held in a taxable account.
ETF Prospectuses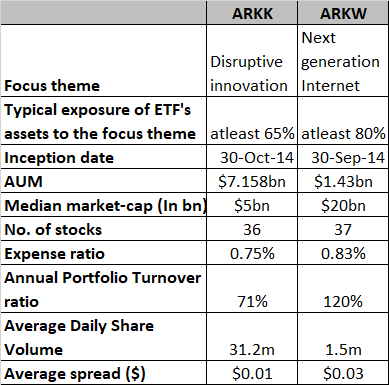
How Have ARKW And ARKK Performed?
Since the inception of these two ETFs in the fall of 2014, the portfolio focussing on next-generation internet has been the clear winner, delivering aggregate returns of 224%, and also outperforming both the Nasdaq-100 and the S&P500. ARKK, on the other hand, has underperformed all these three alternatives, delivering returns of only 117%.
YCharts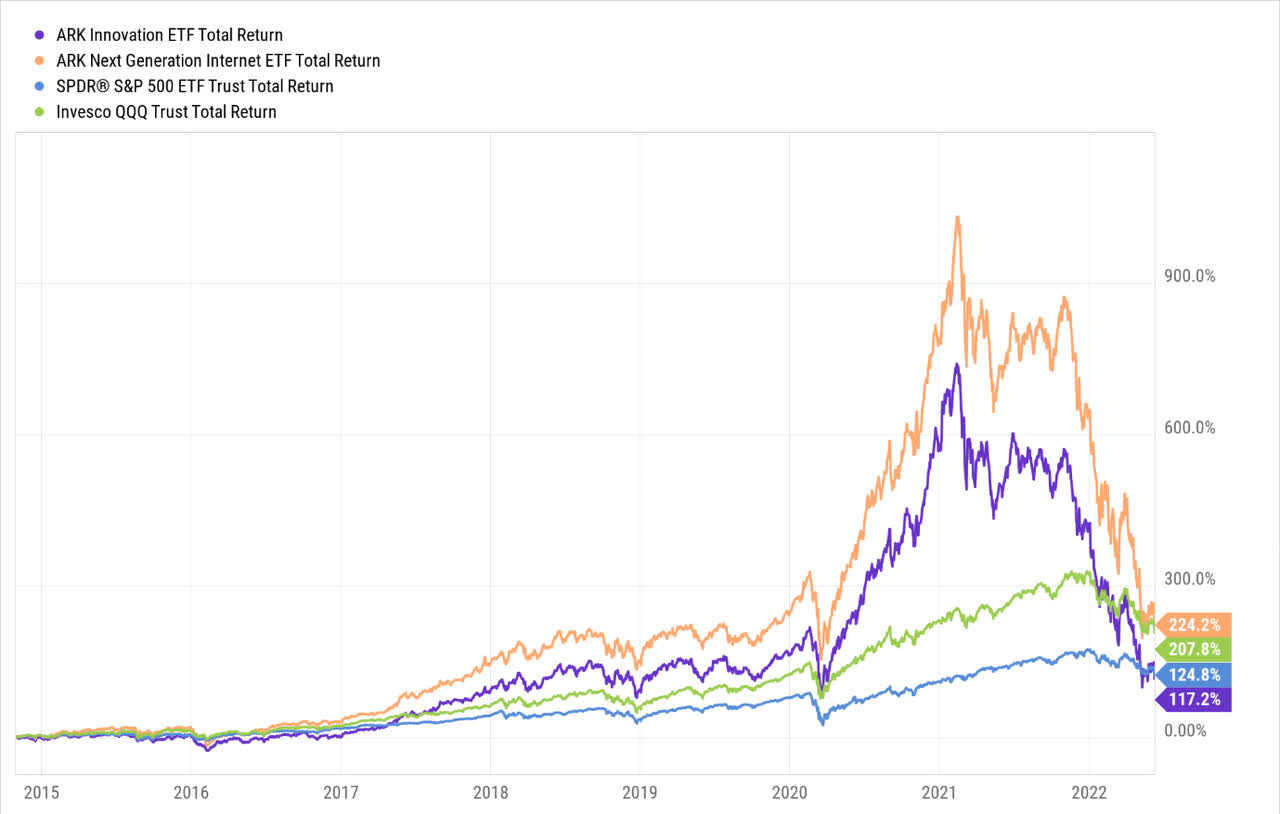
We can also see from the chart above that the outperformance of ARKW over ARKK has been very consistent from the beginning; in light of this track record, it is indeed a curious phenomenon as to why more funds have chased the less effective product – ARKK. Despite underperforming ARKW by nearly 2x, ARKK fuelled by ample hype has been able to witness an astronomical surge in its AUM, highlighting its credence as a superior fund sourcing magnet.
YCharts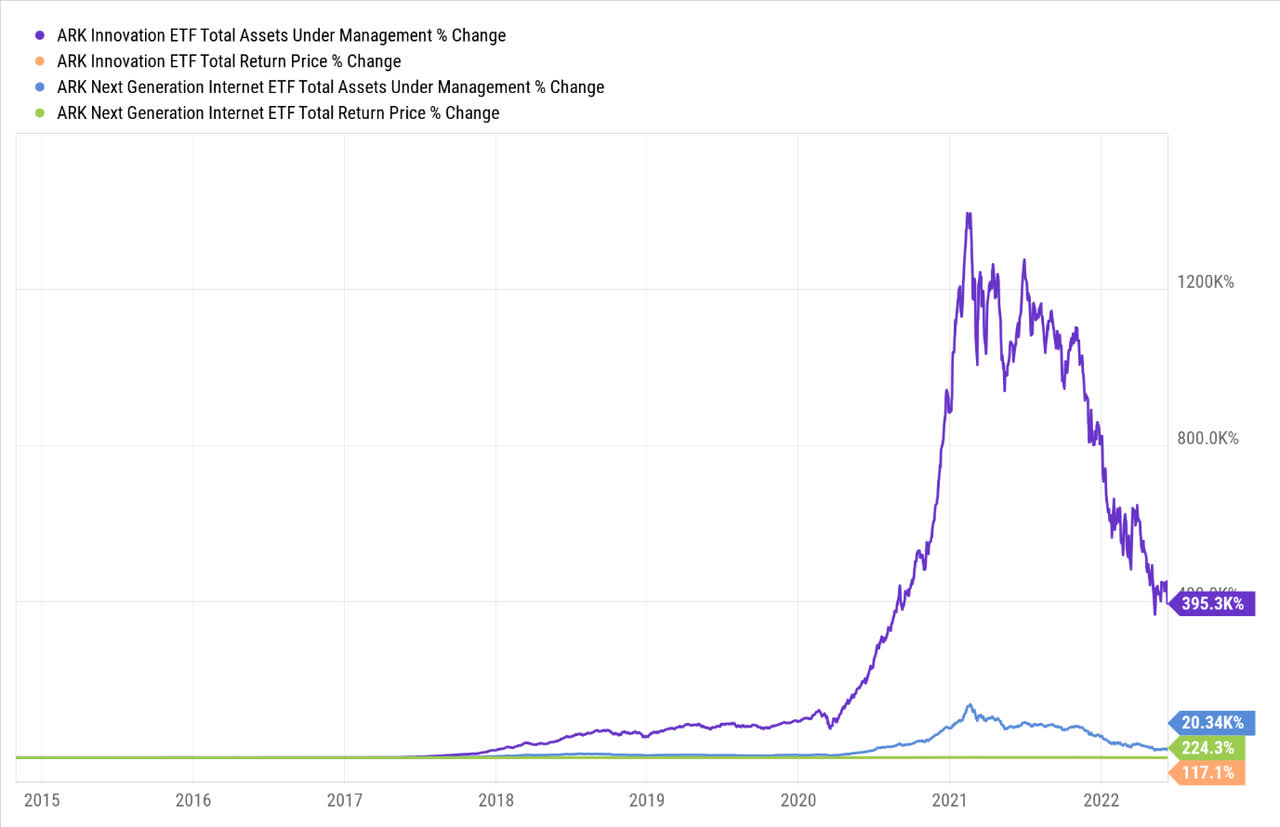
To reiterate ARKW’s superior return track record, let’s also look at some other additional metrics which give us a sense of how adroitly the ETF has juggled its risks whilst delivering its returns. We’ve looked at two separate periods here; the first is the risk-adjusted return profile since inception, and the second is the performance over the last three years which will give us an acute sense of how these products fared during and after the pandemic blitz.
Firstly, note that ARKK’s portfolio is the more volatile and riskier product of the two; we can see this reflected in the superior standard deviation figures (of around 220-240bps), both over the long-term as well as the short-term, and the more pronounced drawdown percentage. This could be attributed to the type of stocks ARKK follows; as mentioned in the previous section, ARKW is more of a large-cap-based play whilst ARKK is more tilted towards mid-caps which- prima facie- tend to be more volatile.
ARKK’s elevated standard deviation figures act as a hindrance in its ability to deliver excess returns over the risk-free rate (this is measured by the Sharpe ratio). Note that since inception, ARKW’s Sharpe ratio has been considerably higher than ARKK’s figure (the superior Sharpe ratio is also noted over a shorter time frame). Also consider the variance in the respective Sortino ratios (both over the long-term and the short-term) which provides some insight into how these products have negated harmful volatility (or downside deviation) in their attempt to engender excess returns. Once again, ARKW comes out on top.
YCharts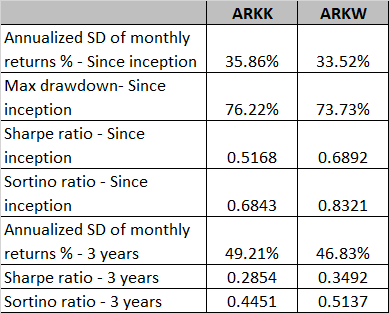
Closing thoughts- Is ARKK Or ARKW The Better Buy?
YCharts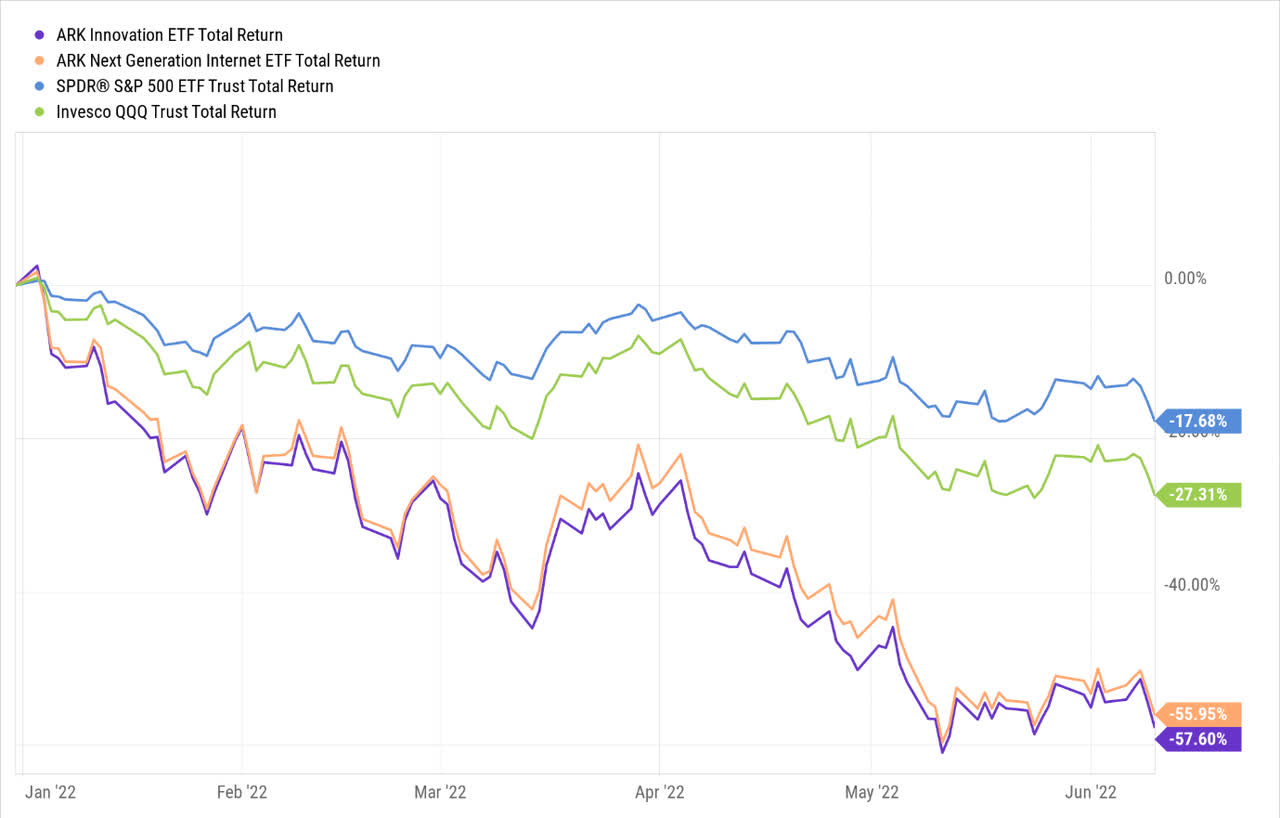
On a YTD basis, both ARKK and ARKW have been decimated by over 55%, significantly underperforming both the S&P500 and the Nasdaq-100 by around 2-3x; in that process, they’ve also given up all of their post-pandemic gains. To substantiate the bearish sentiment for both these products do also consider the elevated short interest figures for both ARKK (14.51%), and ARKW (6.7%); by ETF standards this is quite high, given that the median ETF short-interest figure is just 0.41%.
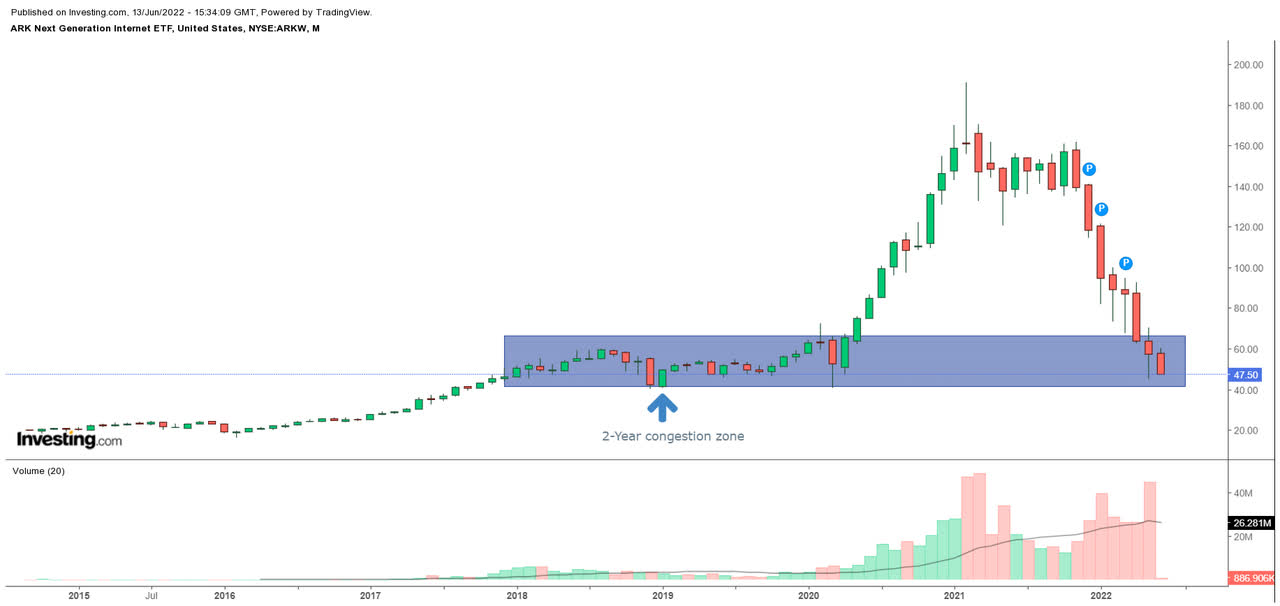
Having said that, do note that both ETFs have now dropped to levels that had previously served as a congestion area (see rectangles in the images below); bargain-hunters would hope that these ETFs could attempt to form a bottom at these levels, particularly as forward valuations too look dirt cheap (according to Morningstar, the constituents of ARKK can now be availed at a P/E of just 3.03x, whilst ARKW can be picked up at an even lower multiple of 2.29x).
Investing Investing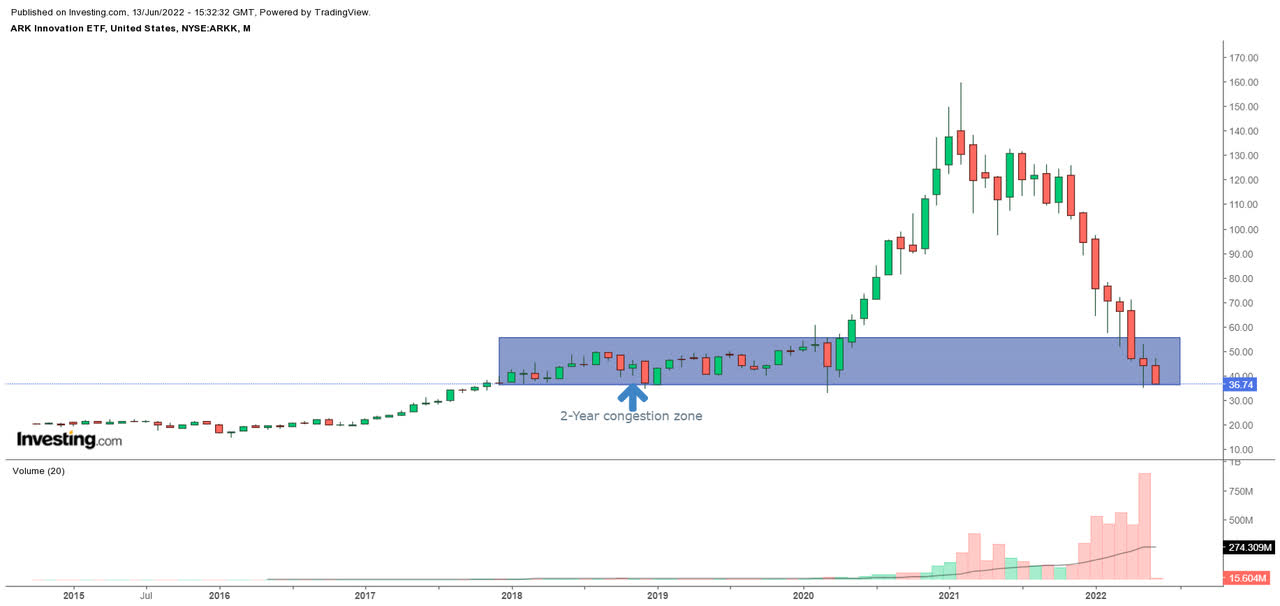
Given what’s on offer, I can see the temptation to get on board, but I would urge some caution as I feel that we’re in an environment where any short-term rallies (particularly of high-growth tech names) can be sold into quite quickly. The somber inflation report which came out last week shows that things are still far from topping out, and now there’s talk of even inculcating a 75bps hike following two separate 50bps hikes. I suspect things won’t end there as conditions in the energy market will likely continue to keep the inflation flag flying for the foreseeable future.
As long as rate expectations keep getting scaled up, the associated discount rate used to value the cash flows of these companies will only get pricier. What also doesn’t help is that forward earnings estimates for tech companies too are being scaled down. All in all, I just believe this is an environment that calls for some defensive positioning, and loading up on high-beta names such as ARKK (beta of 1.65) and ARKW (beta of 1.53) at this juncture feels rash.
Bloomberg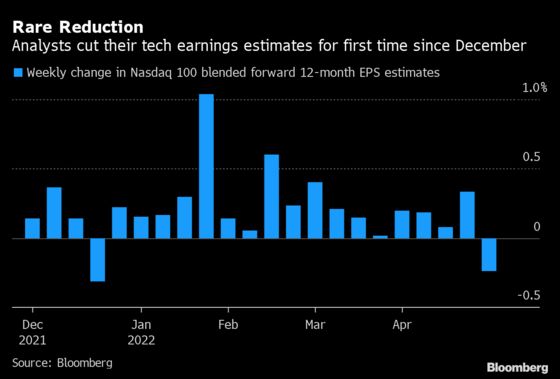
Nonetheless, if you’re high on bravado and are still adamant about picking one of either ARKK or ARKW, I’d point you to a chart showing the relative performance of these two ETFs over time.
Stockcharts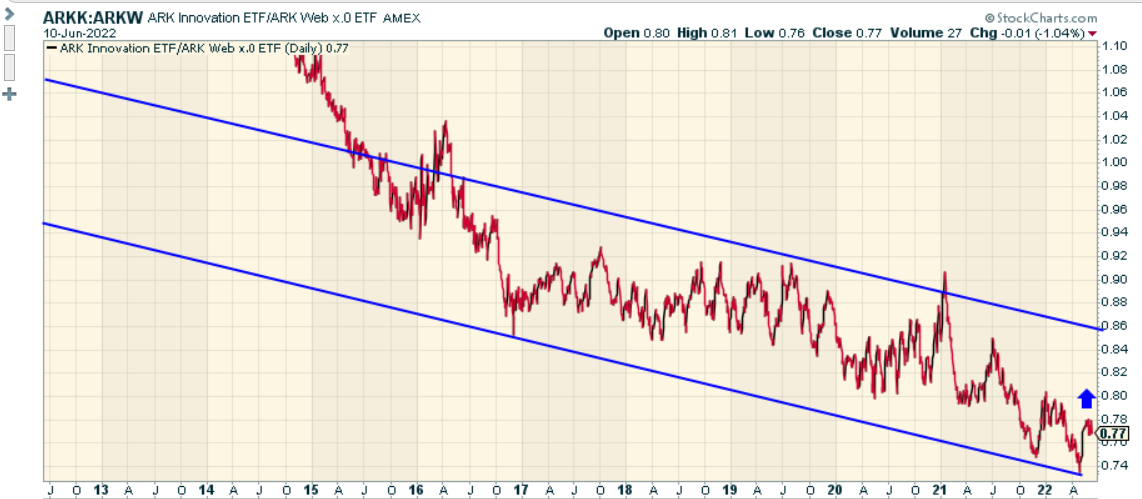
We can see that except for some occasional spikes, this ratio has broadly trended in a shape of a descending channel. Currently, it appears as though the ratio has ample runway to hit the upper boundary of this channel, implying favorable risk-reward for ARKK.
Be the first to comment