

Shahid Jamil
In this analysis of Apple Inc. (NASDAQ:AAPL), we covered the company following its strong iPhone revenue performance in FY2022 of 7% despite its flattish shipment growth of -8.12% and the wider smartphone market weakness, which is forecasted to decline by 9.1% for the full year by the IDC. As we mentioned before in our previous analyses, Apple’s revenue is highly dependent on its iPhone revenue which accounted for 52.1% of its total revenue in FY2022.
Firstly, we analyze the company’s market share of shipments in the smartphone market and its performance among the top 5 competitors. Furthermore, we analyzed the company’s iPhone hardware specs and compared it to competitors based on the average benchmark scores from AnTuTu and DXO Mark as well as in terms of branding by NPS, Google Trend scores and Interbrand rankings to determine whether it has a competitive advantage. Finally, we compared Apple’s sales breakdown with the smartphone market to analyze its growth outlook based on its position in its geographic regions.
Flattish Smartphone Growth but Still Outperforming the Market
IDC, Counterpoint Research, Khaveen Investments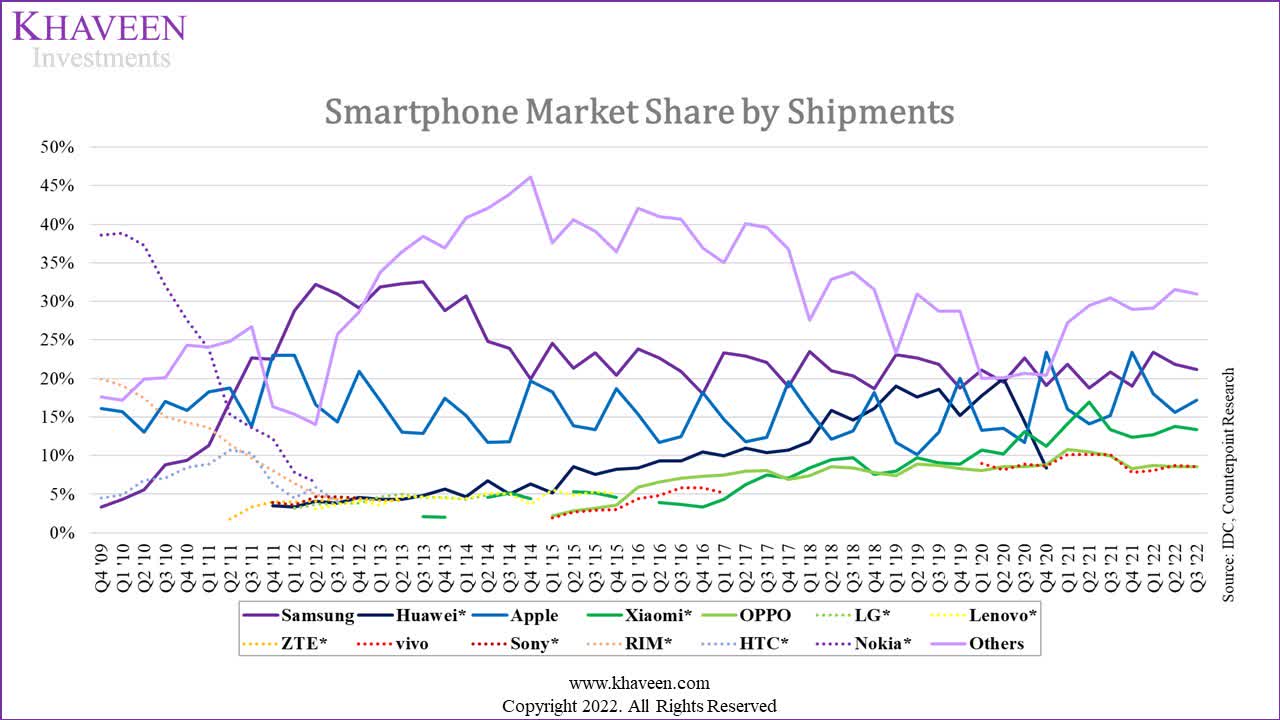
|
Company |
TTM Shipment Growth % |
Market Share |
|
Apple |
-0.93% |
17.2% |
|
Samsung (OTCPK:SSNLF) |
-2.91% |
21.2% |
|
Xiaomi (OTCPK:XIACF) |
-12.90% |
13.4% |
|
Oppo |
-21.32% |
8.6% |
|
Vivo |
-21.80% |
8.6% |
|
Others |
3.74% |
31.0% |
|
Total |
-8.12% |
100.0% |
Source: IDC, Counterpoint Research, Khaveen Investments.
According to data from the IDC, the smartphone market as a whole was sluggish in the TTM from Q4 2021 to Q3 2022 with a total market shipments growth rate of -8.12%. Based on the market share chart and table above:
- Apple’s smartphone shipments were flat in the TTM (Q4 2021 to Q3 2022) but still outperformed the total market shipments which declined by 8.12% in the period. In terms of market share, the company’s share had increased slightly from Q3 2020 but its share is more volatile compared to other competitors as it is highly seasonal with its peak share generally in Q4 of each year after the company releases its new iPhone models such as September 16 for the iPhone 14.
- Samsung continued to maintain its position as the market leader of the smartphone market with a market share of 21.2% as of Q3 2022. From the chart above, its market share had remained stable in the TTM despite a negative growth rate of -2.91% as it still outperformed the market decline. According to Strategy Analytics, Samsung’s sales were supported by its lower-end models as “demand tilted towards low-cost A and M series.” Based on Omdia, the Samsung A series was the top-selling smartphone model in 2021 at 51.8 mln units.
- The top Chinese smartphone makers’ shares including Xiaomi, Oppo and Vivo have been rather stagnant since Q2 2021. All 3 of the companies performed worse than the total market with their growth rates below the market decline of -8.12%. This is despite that the Chinese smartphone market declined by 11% in the period, which is better than the performance of the top Chinese smartphone makers. In China, Xiaomi, Oppo and Vivo had lost market share as Honor increased its share and its shipments grew strongly by 53.8% YTD 2022 following its spinoff from Huawei in 2020 while Apple also gained share.
- According to Strategy Analytics, Honor has a comprehensive product portfolio and had replaced Huawei in the Chinese market. For example, IDC stated that its sales were driven by the launch of its new models such as the Honor 70, Changwan 30 and Play 6 series for the entry-level range and Magic 4 for the high-end range.
- Xiaomi performed the best among the 3 big Chinese smartphone makers and declined by 12.9% TTM which is better than the performance of Oppo and Vivo of 21.32% and 21.8% respectively but still higher than the market decline. Xiaomi outperformed Chinese competitors with a “well-diversified regional footprint” according to Strategy Analytics. Based on data from IDC and Canalys, we calculated Xiaomi’s smartphone shipments contribution from China to be only 27%, lower than Vivo (53%) and Oppo (48%). Outside China, such as in Europe, Xiaomi had strengthened its market share and overtook Apple to become the second-largest smartphone maker in the region.
- The other smartphone makers outside the top 5 performed the best as they had a positive growth rate of 3.74% which is in contrast with the market decline and has been gaining market share since 2021. We believe this is due to increasing competition in the smartphone market, as other smartphone makers including Motorola (MSI), Google (GOOG), TCL and OnePlus have doubled their market shares in the U.S. according to Counterpoint Research. In other markets, smaller brands such as Tecno, Infinix and Itel had increased their market share in the Middle East and Africa. Whereas Honor had increased its market share from 5% in Q1 2021 to 17% in Q3 2022 and stated that it plans to expand overseas in 2023 in markets such as “Europe, the Middle East, Latin America and Southeast Asia.”
All in all, Apple was one of the top 5 smartphone makers which performed better than the total smartphone market which declined in the period. According to BOF…
luxury tends to fare better than other sectors during a downturn because of its exposure to high-income consumers.
Thus we believe this could be one of the factors for Apple’s better-than-market performance despite the market rout, and we expect it to continue to perform resiliently in future market downturns. Besides that, Samsung also performed slightly better than the market decline, as the company expanded its low-mid tier range, one of the best-selling models in 2022. However, the top Chinese smartphone makers performed poorly, worse than China’s smartphone market decline of 11% as competition from Honor increased and gain share following its comprehensive product launches. Though, Xiaomi performed the best among the 3 smartphone makers as it had a more diverse exposure to overseas markets such as Europe where it strengthened its share.
Notwithstanding, we believe competition from Honor could pose a threat to the Chinese smartphone makers and Samsung as its plans to expand into overseas markets in 2023 in addition to competition from other smartphone makers from smaller brands such as Motorola, Google, TCL, OnePlus, Tecno, Infinix and Itel which were gaining share in markets such as the US, Middle East and Africa. However, we expect the rise in competition to impact Apple to a lesser extent as the company’s performance and market share had been resilient as the top premium smartphone maker.
iPhone Feature Quality and Branding Competitive Advantage
In September 2022, Apple launched its next-gen iPhone 14 models. According to the company in its latest earnings briefing, the company explained its new features and innovations.
iPhone 14 and iPhone 14 Plus come with a new dual-camera system, industry-leading durability, incredible power and amazing battery life. And our iPhone 14 Pro models are packed with even more groundbreaking innovations, including a new camera system as well as always-on display and the Dynamic Island, which offers a whole new way to interact with iPhone. – Tim Cook, Chief Executive Officer
To determine whether Apple has a competitive advantage based on their iPhone innovation in terms of spec performance and features, we compiled the average benchmark scores from AnTuTu for the past 3 smartphone generations of the top smartphone makers.
We compared the smartphones with the top 25 smartphones with the highest total scores using the AnTuTu benchmark and grouped them according to their brands. From there, we averaged the scores of the smartphones of the respective companies and derived the following averages for the top 25 smartphones. We believe all the smartphones are considered high tiers, judging from the latest Snapdragon chips used at the time of release (A15, A14 bionic chips; Snapdragon 8 Gen 1, 888 5G AP).
|
Companies |
CPU |
GPU |
Memory |
UX |
Total Benchmark Score |
|
Apple |
214,063 |
345,205 |
143,717 |
134,451 |
837,437 |
|
Samsung |
220,377 |
385,224 |
150,838 |
160,404 |
916,841 |
|
Xiaomi |
226,382 |
429,460 |
167,423 |
169,698 |
992,963 |
|
Oppo |
195,790 |
380,885 |
139,655 |
155,738 |
872,068 |
|
Vivo |
230,804 |
353,510 |
158,691 |
176,887 |
919,891 |
Source: AnTuTu, Khaveen Investments.
Based on the table, Apple’s average score for CPU is the second worst only ahead of Oppo while its GPU score is the lowest. Also, its memory score is the second lowest ahead of Oppo. In terms of UX score, Apple is the lowest.
Overall, Apple’s benchmark score has the lowest average among smartphone makers, thus indicating its disadvantage over competitors in terms of hardware spec performance. One of the factors we believe could be the stronger performance of Qualcomm’s (QCOM) Snapdragon chipsets (used in Samsung, Xiaomi, Vivo and Oppo smartphones). For example, the Snapdragon Gen 1 has a much higher benchmark score (1,028,705) compared to Apple’s A15 chipset (795,947).
Furthermore, we compared the feature ratings by DxOMark based on the average rating for the past 3 generations of smartphones by the top smartphone makers. We calculated the weighted overall score of each company for the feature quality comparison by assigning a weight breakdown for each of the metrics with Camera and Selfie having the highest weight of 20% each, followed by Battery at a 30% weight and Audio and Display with a 15% weight each.
Zdnet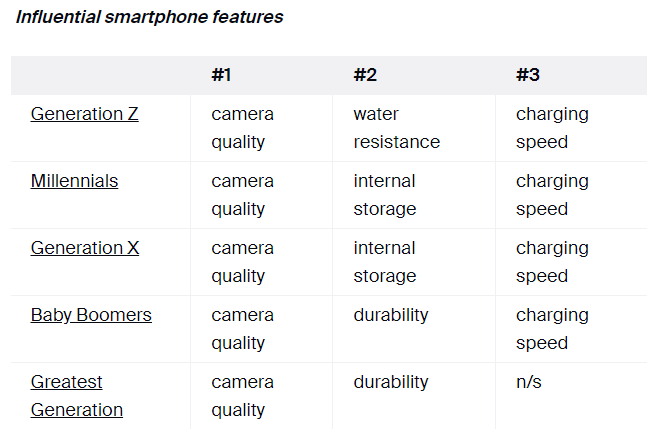
|
Companies |
Camera (20%) |
Selfie (20%) |
Audio (15%) |
Display (15%) |
Battery (30%) |
Overall |
|
Apple |
138 |
137 |
141 |
139 |
119 |
132.43 |
|
Samsung |
123 |
135 |
130 |
134 |
96 |
119.93 |
|
Xiaomi |
124 |
N/A |
133 |
119 |
101 |
92.76 |
|
Oppo |
126 |
116 |
117 |
128 |
114 |
119.38 |
|
Vivo |
N/A |
N/A |
121 |
130 |
N/A |
37.58 |
Source: DXO Mark, Khaveen Investments.
Based on the table, Apple has the highest average rating for camera (138) and selfie quality (137). Moreover, the company has the highest rating for audio quality (141) as well as display quality (139). Moreover, the company has the highest average for the battery criteria (119). Overall, we believe this highlights Apple’s smartphone feature quality advantage. According to ZDNet, camera quality is the top smartphone feature for consumers across all age groups which highlights Apple’s strength as it has the highest camera quality score among competitors’ products. In total, Apple had the highest weighted score of 132.43 and surpasses its competitors followed by Samsung in second place.
Furthermore, based on the company’s latest earnings briefing the company highlighted its strong brand loyalty among customers as well as high customer satisfaction.
Thanks to our strong iPhone lineup, we set a quarterly record for upgraders and grew switchers double digits. This level of sales performance, along with unmatched customer loyalty, drove the active installed base of iPhones to a new all-time high across all geographic segments. And the latest survey of US consumers from 451 Research indicates iPhone customer satisfaction of 98%.” – Luca Maestri, Chief Financial Officer
We examined the company’s NPS score from Comparably, the average Google Trends score for the mobile phone category and its ranking based on Interbrand and compared it with competitors to determine whether it has a branding advantage over competitors.
|
Company |
NPS Score |
Google Trends |
Interbrand Ranking |
|
Apple |
52 |
44 |
1 |
|
Samsung |
22 |
18 |
5 |
|
Xiaomi |
48 |
1 |
84 |
|
Oppo |
21 |
1 |
>100 |
|
Vivo |
37 |
1 |
>100 |
Source: Comparably, Google Trends, Interbrand, Khaveen Investments.
Based on the table above, Apple has the highest NPS score (52) followed by Xiaomi (48) and Samsung (22). Moreover, Apple has the highest average Google Trends score at 44 followed by Samsung while the top Chinese smartphone makers trail behind with a similar score respectively. Additionally, based on Interbrand, Apple is ranked as the number one brand followed by Samsung at number 5 and Xiaomi at the 84th position. Thus, we believe this highlights its strong branding among competitors in the smartphone market. Based on the smartphone market share for the premium segment in Q2 2022 by Counterpoint Research, Apple continued to maintain its dominance with over 57% share of the premium smartphone market. This is followed by Samsung at second place and the top Chinese smartphone makers tied with a 4% share each.
Counterpoint Research 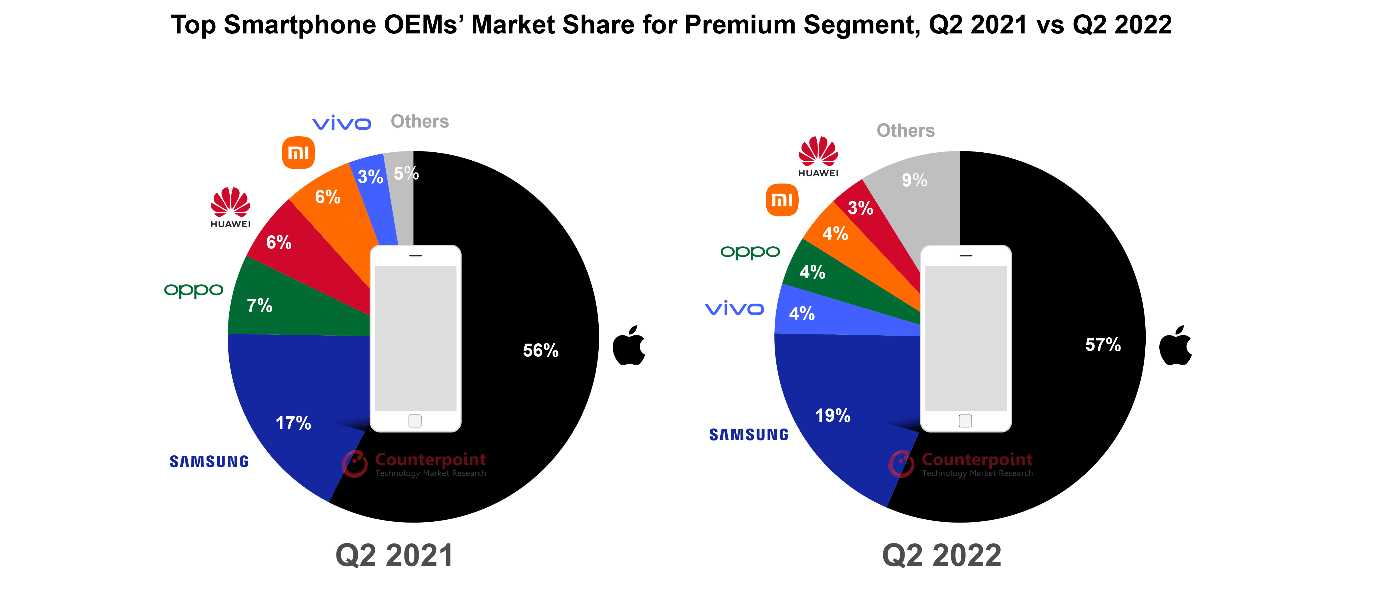
According to CIRP, Apple has high brand loyalty with 90% of iPhone users remaining with Apple. One of the factors could be the high customer loyalty to the smartphone operating system. Additionally, CIRP stated that…
switching brands within Android OS is easier compared to switching between Android and iOS.
Moreover, according to TechNave, nearly half (49%) of Android users would switch to iPhones due to security and privacy as the main factor. For example,
20% of iCloud Keychain users feel extremely secure compared to the 13% of Google Password Manager users feeling the same, while 27% of Apple users feel extremely secure using iCloud compared to 22% of Google Drive users feeling the same.
All in all, we believe that while Apple does not have a performance advantage for its hardware specs with below-average benchmark scores for its smartphones, it has a product feature quality advantage in terms of camera, audio, display and battery ratings which are higher than competitors. Moreover, we believe that another advantage for Apple is its high customer satisfaction with the highest NPS score, popularity with the highest Google Trends score and branding with the highest brand ranking by Interbrand among competitors.
The Americas Geographic Region Provides the Best Growth Opportunities
|
Smartphone Market Shipments (‘mln’) |
2018 |
2019 |
2020 |
2021 |
Average |
Forecast CAGR |
|
Greater China |
423 |
407 |
368 |
383 |
||
|
Growth % |
-3.8% |
-9.7% |
4.0% |
-3.1% |
2.20% |
|
|
Americas |
303 |
292 |
253 |
267 |
||
|
Growth % |
-3.6% |
-13.5% |
5.8% |
-3.8% |
3.70% |
|
|
EMEA |
358.59 |
360.86 |
324.31 |
341.39 |
||
|
Growth % |
0.6% |
-10.1% |
5.3% |
-1.4% |
6.95% |
|
|
Japan |
34 |
32 |
27 |
28.13 |
||
|
Growth % |
-6.7% |
-14.2% |
3.6% |
-5.8% |
3.30% |
|
|
Rest of Asia and Pacific |
437 |
449 |
407 |
414 |
||
|
Growth % |
2.6% |
-9.4% |
1.9% |
-1.6% |
4.20% |
|
|
Total |
1,556 |
1,541 |
1,379 |
1,434 |
||
|
Growth % |
-1.0% |
-10.5% |
4.0% |
-2.5% |
5.10% |
Source: Statista, Apple, Khaveen Investments.
Based on the table, the smartphone market had declined by 2.5% on average in the past 3 years as it was weighed down by the decline in 2020. Only two regions outperformed the market, EMEA and Rest of Asia and Pacific. In terms of market forecast CAGR by Statista, the EMEA segment has the highest CAGR of 6.95%, followed by Rest of Asia and the Pacific.
Furthermore, Apple claimed from its earnings briefing that the company’s performance was impressive in several markets in Asia and the Americas.
We set September quarter records in the vast majority of markets we track, and our performance was particularly impressive in several large emerging markets, with India setting a new all-time revenue record and Thailand, Vietnam, Indonesia and Mexico more than doubling year-over-year.” – Luca Maestri, Chief Financial Officer.
We compared Apple’s market share in each of its reportable geographic segments in Q2 2022, sales breakdown in FY2022 based on its annual report and smartphone market breakdown in the table below to analyze the difference between Apple’s sales breakdown and the market breakdown. Also, we compared the penetration rate of each region.
|
Comparison |
Apple’s Market Leadership (Q2 2022) |
Apple’s Revenue Breakdown (2022) |
Smartphone Market Breakdown |
Total Population (‘mln’) |
Penetration Rate |
|
Americas |
36.5% |
43.02% |
16.9% |
677.2 |
66.3% |
|
EMEA |
10.8% |
24.12% |
33.8% |
1,877.5 |
47.7% |
|
Greater China |
13.0% |
18.82% |
32.6% |
1,440.0 |
60.1% |
|
Japan |
65.0% |
6.59% |
3.6% |
126.1 |
75.2% |
|
Rest of Asia Pacific |
13.7% |
7.45% |
13.1% |
533.4 |
65.4% |
Source: Statista, Apple, Khaveen Investments.
Based on the table above:
- For the Americas region, Apple’s market leadership is the second highest among the region breakdown only behind Japan. This is because of Apple’s leading position as the number one smartphone maker in its home market of the US at 48% and Canada at 57%. The region accounted for the highest revenue contribution to Apple and is more than two times higher compared to the smartphone market breakdown, highlighting the importance of the segment to Apple. While the region’s population size is lower than EMEA and Greater China, it is higher than Japan and the Rest of Asia Pacific. Also, while the penetration rate of the region is higher than EMEA, Greater China and Rest of Asia Pacific, it is lower than Japan. Thus, this highlights the greater growth opportunities left for the smartphone market and we believe this bodes well for Apple as it has a stronghold in the region with a high market leadership.
- In Japan, Apple has the highest market leadership among its regions. According to Nikkei, Apple is ranked by its survey as the number one brand in Japan. Thus, we believe highlights the strong popularity of the brand in the country. However, the region is the smallest contributor to Apple’s revenues and is the smallest region based on the smartphone market breakdown. Moreover, the region’s population is the lowest and the penetration rate is the highest, thus we believe indicates limited growth opportunities for the smartphone makers and Apple despite Apple’s strong market leadership position.
- For the EMEA region, Apple’s market leadership is the lowest among other regions. While Apple has a high market share in Europe at 25.1%, its share is low in the Middle East and Africa regions at 2.2%. However, the region is the second largest in its revenue contribution but lower as compared to the smartphone market breakdown where it is the largest region. The region has the highest population and the lowest penetration rate, thus indicating high growth opportunities left to be captured by smartphone makers. However, given Apple’s low market leadership, we believe this region not to be its significant growth contributor.
- In Greater China, the company has a low market leadership as it is ranked 5th behind China-based smartphone makers including Vivo, Oppo, Honor and Xiaomi. The region is the third largest contributor to Apple’s revenue but is lower compared to the smartphone market breakdown where it is the second largest region. The region has the second highest population and second lowest penetration rate, behind EMEA, thus indicating high growth opportunities left. Though, similar to EMEA, we believe it not to be the best region for Apple with its low market leadership.
- For the rest of Asia Pacific, Apple also has low market leadership in the region and is only slightly higher compared to China. In terms of revenue contribution to Apple, it is the second lowest region behind Japan and is lower compared to the smartphone market breakdown. Its population is also the second lowest but its penetration rate is lower than Japan and the Americas, thus we believe its growth opportunities left are higher than Japan but slightly lower than the Americas. We believe the region is not to be a key contributor to Apple with its low market leadership.
All in all, we believe that in terms of the geographic breakdown, the Americas region is the best region for Apple’s growth outlook as we believe the region has the highest growth opportunities for Apple left based on its high population and low penetration rate which bodes well for Apple due to its strong market leadership in the region. Furthermore, we believe that while the EMEA, China and Rest of Asia Pacific have high growth opportunities left based on the population and penetration rates, Apple’s low market leadership in the region could limit its ability to benefit from the region’s growth. Whereas in Japan, while Apple has a high market leadership there, we believe its growth outlook is low based on the low population and high penetration rate.
Risk: Increasing Competitive Threats from Honor
As mentioned in the first point, we believe that increasing competition could pose a threat to the top Chinese smartphone makers and Apple to a lesser extent as the company’s performance and market share had been resilient as the top premium smartphone maker. However, we believe Honor could pose a competitive threat to Apple in the premium segment in the future as it announced that it was planning to expand internationally in…
20 overseas markets in Europe, the Middle East, Latin America, and Southeast Asia,
including a premium lineup for the UK.
We believe Honor is a risk to Apple, as the company was spun off from Huawei in 2020 to protect the company against U.S. sanctions. In 2019, Huawei was the third largest company in terms of market share (16%) but had a decline following the U.S. trade sanctions to only 3% in Q2 2022. Additionally, Huawei is still in the top 5 in the smartphone premium segment in LATAM, China and MEA. Furthermore, the company’s workforce has increased by 50% since 2020 and plans to increase even further. Moreover, Honor stated that it has partnerships with foreign suppliers such as Qualcomm, MediaTek (OTCPK:MDTKF) and Sony (SONY). Also, Honor smartphones source a majority of components from the US (38.5%) followed by Japan and China which is in contrast to Huawei which sourced its components primarily from China (37.5%). Overall, we believe Honor could pose a threat to Apple, as it plans to expand internationally and compete with Apple following its spin-off from Huawei.
Valuation
We updated our revenue projections from our previous analysis and updated it with the full year FY2022 in the table below. Based on our forecast we derived a 4-year forward average growth rate of 9.9% for Apple, which is fairly in line with its 5-year historical average growth of 12.1%.
|
Apple Revenues ($ bln) |
2022 |
2023F |
2024F |
2025F |
2026F |
|
iPhone |
205.5 |
216.66 |
228.42 |
240.82 |
253.89 |
|
Growth % |
7.0% |
5.4% |
5.4% |
5.4% |
5.4% |
|
Mac |
40.2 |
41.03 |
41.91 |
42.80 |
43.71 |
|
Growth % |
14.2% |
2.1% |
2.1% |
2.1% |
2.1% |
|
iPad |
29.3 |
30.49 |
31.74 |
33.05 |
34.41 |
|
Growth % |
-8.1% |
4.1% |
4.1% |
4.1% |
4.1% |
|
Wearables, home and accessories |
41.2 |
48.07 |
54.61 |
60.40 |
65.00 |
|
Growth % |
7.4% |
16.6% |
13.6% |
10.6% |
7.6% |
|
Services |
78.1 |
96.14 |
118.09 |
144.92 |
178.32 |
|
Growth % |
14.2% |
23.1% |
22.8% |
22.7% |
23.0% |
|
Total |
394.3 |
432.4 |
474.8 |
522.0 |
575.3 |
|
Total Growth % |
7.8% |
9.7% |
9.8% |
9.9% |
10.2% |
Source: Apple, Khaveen Investments.
We continued to value the company with a discounted cash flow (“DCF”) analysis and updated our EV/EBITDA for its terminal value at 15x.
|
EV/EBITDA |
Revenue ($ bln) |
Weight |
Weighted Average |
|
Product |
316.2 |
80.2% |
10.40x |
|
Service |
78.1 |
19.8% |
33.65x |
|
Total |
394.3 |
100.0% |
15.00x |
Source: Apple, Seeking Alpha, Khaveen Investments.
Based on a discount rate of 10% (the company’s WACC), our model shows its shares are undervalued by 43%.
Khaveen Investments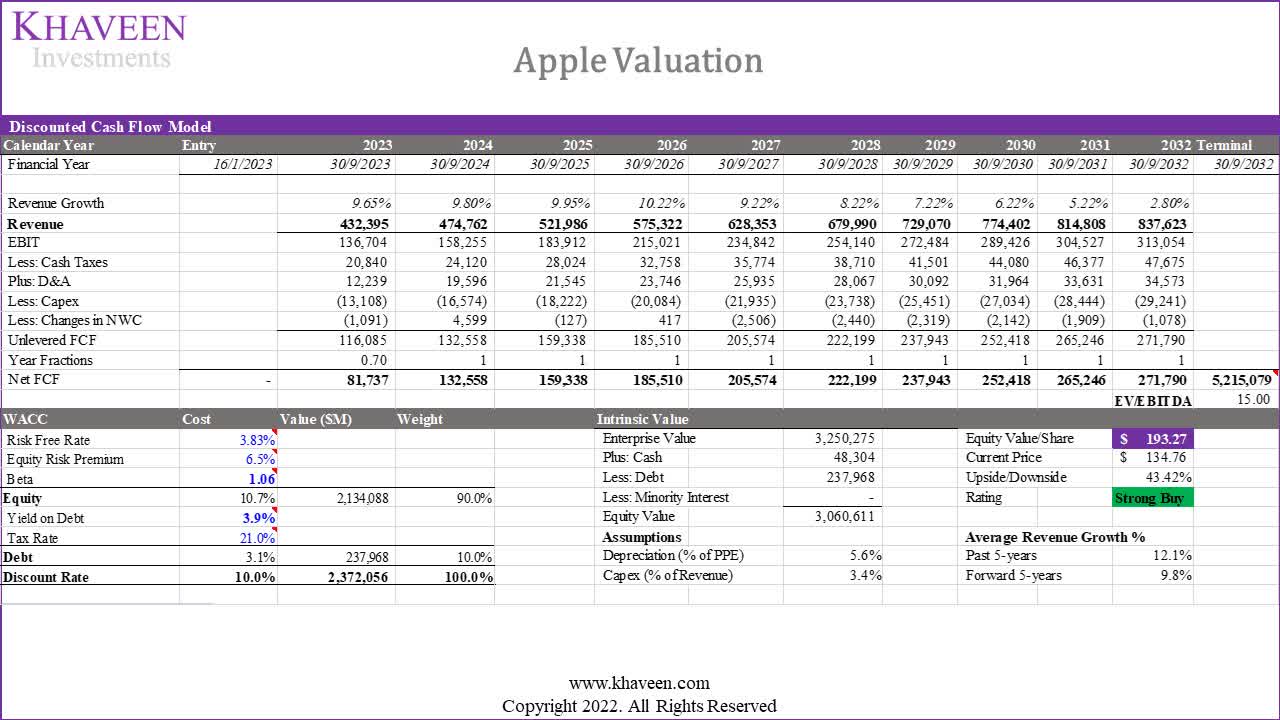
Verdict
To conclude, we believe competition from Honor could pose a threat to the Chinese smartphone makers and Samsung as it plans to expand into overseas markets in 2023, in addition to competition from other smartphone makers from smaller brands such as Motorola, Google, TCL, OnePlus, Tecno, Infinix and Itel which were gaining share in markets such as the US, Middle East and Africa. However, we expect the rise in competition to impact Apple Inc. to a lesser extent, as the company’s performance and market share had been resilient as the top premium smartphone maker.
Additionally, while we believe that while Apple does not have a performance advantage for its hardware specs with below-average benchmark scores for its smartphones, it has a feature quality advantage in terms of camera, audio, display and battery ratings which are higher than competitors. Moreover, we believe that another advantage for Apple is its high customer satisfaction with the highest NPS score, popularity with the highest Google Trends score and branding with the highest brand ranking by Interbrand among competitors.
We believe that in terms of the geographic breakdown, the Americas region is the best region for Apple’s growth outlook, as we believe the region has the highest growth opportunities for the smartphone market left based on its high population and low penetration rate which bodes well for Apple due to its strong market leadership in the region. Furthermore, we believe that while the EMEA, China and Rest of Asia Pacific have high growth opportunities left based on the population and penetration rates, Apple’s low market leadership in the region could limit its ability to benefit from the region’s growth. Whereas in Japan, while Apple has a high market leadership there, we believe its growth outlook is low based on the low population and high penetration rate.
Overall, we revised our Apple Inc. price target higher to $193.47, based on a higher average forward growth rate (9.8%). Thus we upgrade our price target on Apple to a Strong Buy.
Editor’s Note: This article discusses one or more securities that do not trade on a major U.S. exchange. Please be aware of the risks associated with these stocks.
Be the first to comment