

David Sacks/The Image Bank via Getty Images
Both Realty Income (NYSE:O) and Spirit Realty Capital (NYSE:SRC) are high yield triple net lease REITs with investment grade credit ratings. Both also have very defensive business models.
In this article, we will compare them side by side and offer our take on why SRC is a much better buy than O right now.
Realty Income Vs. Spirit Realty Capital: Business Model
Given that both REITs employ business models that involve almost exclusively leasing out a widely diversified portfolio of freestanding single-tenant real estate to a large number of tenants across a broad swatch of industries on a long-term triple net lease basis, the risks are generally considered to be quite low with both stocks. As a result, it should be unsurprising that both businesses have generated pretty stable cash flows through a wide variety of business environments.
When it comes to scale, O is the clear winner with a $58.9 billion enterprise value compared to SRC’s much smaller $9.4 billion enterprise value. Furthermore, O owns 11,733 properties compared to SRC’s 2,118 properties. O leases those properties out to 1,147 tenants, whereas SRC leases out its properties to 346 tenants. That said, the diversification for both is clearly sufficient to result in a pretty low risk profile should any of its tenants go through challenging times.
When it comes to lease terms, O has an 8.8-year weighted average lease term, whereas SRC has a 10.4-year weighted average lease term, giving it the clear edge here. That said, O generates 43% of its rent from investment grade tenants, compared to SRC’s 20.1% exposure to investment grade tenants, so O’s counterparties are clearly stronger on average. That said, both portfolios performed very well in terms of rent collection during the COVID-19 lockdowns, so their counterparties have already passed a pretty significant stress test.
It is also important to note that SRC has significantly greater exposure to industrial real estate (which generally enjoys superior rental growth and stronger overall demand than retail) than O does: 20.7% to 13.9%. Furthermore, SRC’s allocation to industrial is only growing moving forward, with SRC allocating nearly 35% of its trailing twelve-month acquisition spending towards industrial assets.
Realty Income Vs. Spirit Realty Capital: Balance Sheet
Both REITs clearly have strong balance sheets, with O boasting an A- credit rating and SRC enjoying a solid BBB credit rating.
However, on individual categories, SRC looks even better relative to O. O has a 6.3-year weighted average term to maturity for its notes and bonds, a fixed charge coverage ratio of 5.5x, a net debt to annualized pro forma adjusted EBITDA of 5.2x, and liquidity of over $2.5 billion (only 4.2% of its enterprise value). SRC, for its part, has a 6.1-year weighted average term to maturity for its debt, a fixed charge coverage ratio of 5.4x, and a net debt to annualized pro forma adjusted EBITDA of 5.2x. Its liquidity stands at $1.3 billion (13.8% of its enterprise value), which is quite impressive given its smaller size relative to O. While O had a meaningful amount of debt maturing in 2022-2024, SRC had no debt maturing in 2022-2025, insulating it better against the rising interest rate environment.
Moreover, SRC also bests O on two other debt categories: 99.9% of SRC’s debt is unsecured whereas 95% of O’s debt is secured, and 100% of SRC’s debt is at fixed interest rates whereas 88% of O’s debt is at fixed interest rates.
While it is true that O clearly has some advantages over SRC when it comes to financial strength, SRC more than holds its own and is very well-positioned to weather the rising interest rate environment as well as any potential recession that may hit this year.
Realty Income Vs. Spirit Realty Capital: Dividend Outlook
Analysts forecast low-single-digit annualized dividend growth moving forward for both businesses, which is in line with their recent trajectory. Analysts expect O to grow its dividend per share at a 3.3% CAGR through 2024 and SRC is expected to grow its dividend per share at a 2.7% CAGR through 2024. O is expected to grow its AFFO per share at a 3.1% CAGR through 2024 while SRC is expected to grow its AFFO per share at a 2.2% CAGR through 2024.
As a result, O is expected to have a slightly superior growth profile moving forward. This makes sense given that O shares currently trade at a meaningful premium to NAV, whereas SRC’s shares still trade at a slight discount to NAV. This means that O can issue new equity and reinvest the proceeds in a manner that is accretive to AFFO per share, whereas SRC cannot do that as easily.
Realty Income Vs. Spirit Realty Capital: Track Record
O wins this comparison hands down, with a much longer and better track record. In fact, in our view, this is really the only remaining strong argument in favor of investing in O instead of SRC, as most of the investment metrics tilt in SRC’s favor.
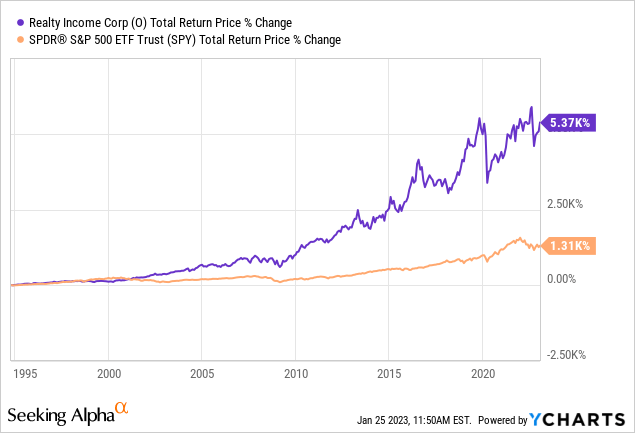
In addition to growing its dividend per share for 27 straight years (earning it a spot in the elite Dividend Aristocrats club) and paying out a monthly dividend (which is popular with many retirees in contrast to the quarterly dividend that SRC and most other companies pay out), O has delivered phenomenal long-term outperformance:
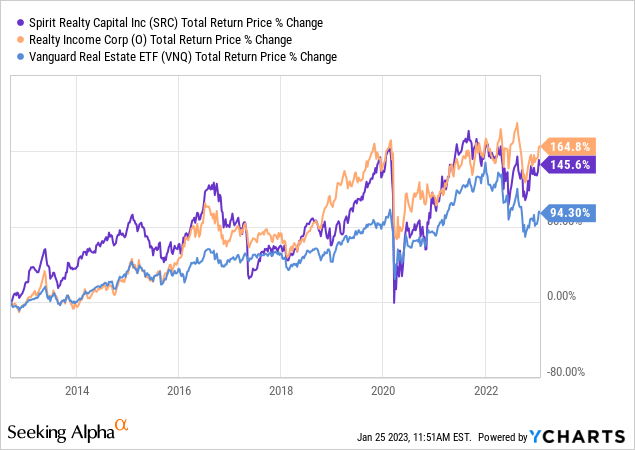
That said, since going public, SRC has only slightly underperformed O and both REITs have dramatically outperformed the broader REIT sector (VNQ):
Realty Income Vs. Spirit Realty Capital: Valuation
When comparing these REITs side-by-side, we see that SRC is convincingly cheaper than O on virtually every valuation metric:
| Valuation Metric | SRC | O |
| EV/EBITDA | 13.97x | 17.68x |
| EV/EBITDA (Historical Average) | 15.12x | 19.41x |
| P/AFFO | 11.58x | 16.95x |
| P/AFFO (Historical Average) | 12.75x | 18.51x |
| Dividend Yield | 6.3% | 4.5% |
| P/NAV | 0.98x | 1.18x |
| P/NAV (Historical Average) | 0.98x | 1.24x |
While some may favor O over SRC at the moment by pointing to its 90 basis point superior expected AFFO per share CAGR over the next few years, this is solely due to its superior P/NAV ratio. This benefit is offset by the 180 basis point superior dividend yield and 274 basis point superior AFFO yield that investors receive by investing in SRC today over O. As a result, SRC looks like it is positioned to deliver significantly superior total returns moving forward, even apart from accounting for potential future P/NAV multiple expansion.
Investor Takeaway
For investors who put a lot of emphasis on track record and credit rating, O is the clear winner here.
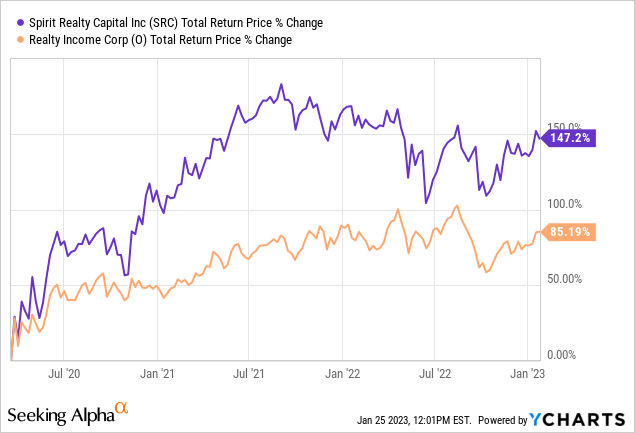
That said, SRC’s total return track record since going public only slightly trails O and that can largely be attributed to valuation multiples rather than underlying value creation. It is also largely due to SRC’s old (pre pure-play triple net lease) business model failures. Since becoming a pure-play triple net lease, SRC’s total return performance has significantly improved, and it has significantly outperformed O since the COVID-19 crash of early 2020:
Given that SRC’s portfolio and balance sheet are really not much worse than O’s in terms of overall strength and its total return potential is significantly stronger, we believe that SRC provides the best risk-reward between these two at the moment.
Be the first to comment