

Marina113/iStock Editorial via Getty Images
Introduction
I appreciate everyone who has taken the time to read my work over the past year. It is a joy to share my latest stock market analysis with you in this article on Seeking Alpha.
Seeking Alpha asked us to give an updated view about our forecast for the S&P 500 and our prediction for where it would be by the end of 2023. Even though I don’t like to make stock market predictions, I did my best to estimate where the market might be headed. Unfortunately, I believe that the S&P 500 will fall by 10%, to 3,465, because of rising interest rates and a likely recession.
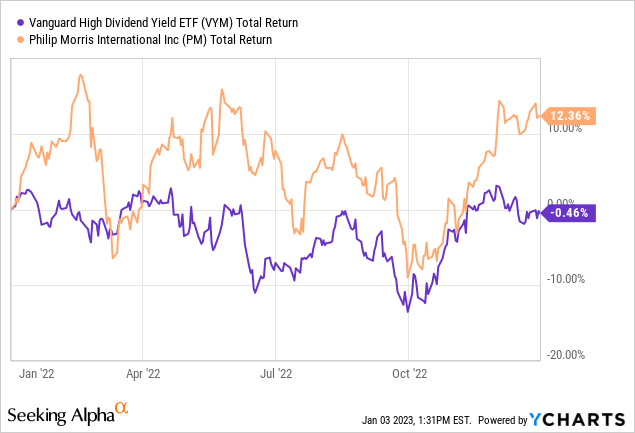
While major indices fell sharply during that year, the Vanguard High Dividend Yield ETF (VYM) had a total return of -0.46% in 2022.
So, I started thinking about dividend stocks. With a dividend yield of 5%, Philip Morris (NYSE:PM) is a high dividend yield stock. The company is a major player in the tobacco industry, producing popular brands like HEETS, Marlboro, Chesterfield, L&M, and others. With a total return of 12.4% last year, the stock outperformed the Vanguard High Dividend Yield ETF.
Higher interest rates have caused investors to flee the stock market, so it’s a good time to buy dividend stocks. Even in the face of declining earnings, dividend-paying companies are hesitant to reduce their dividend.
Global Tobacco Revenue Growing, Volume Is Expected To Decline
Philip Morris is a major player in the tobacco business, which faces numerous challenges from government regulators. High taxes, bans on advertising, and graphic warning labels on cigarette packages are just a few of the deterrents that governments all over the world have enacted to reduce tobacco use.
In 2023, the global tobacco market is expected to reach $941 billion, according to Statista. Cigarettes are a huge part of the global tobacco industry and are expected to bring in $835B. As of 2023, China is predicted to be the primary source of revenue ($294B, or roughly 31% of total expected revenue). Cigarettes are widely popular: a total of 1.3 billion people, according to the World Health Organization, smoke cigarettes regularly.
Revenue by segment (Statista)
As a result of these regulatory measures, the price of tobacco products has risen dramatically over the years, while volume has fallen. During the pandemic, global volumes rose as more people smoked cigarettes in response to the widespread fear and isolation caused by the outbreak.
Despite the anticipated decline in volume, the market is predicted to expand at a CAGR of 2.5% in revenue between 2022 and 2027.
Volume by segment (Statista)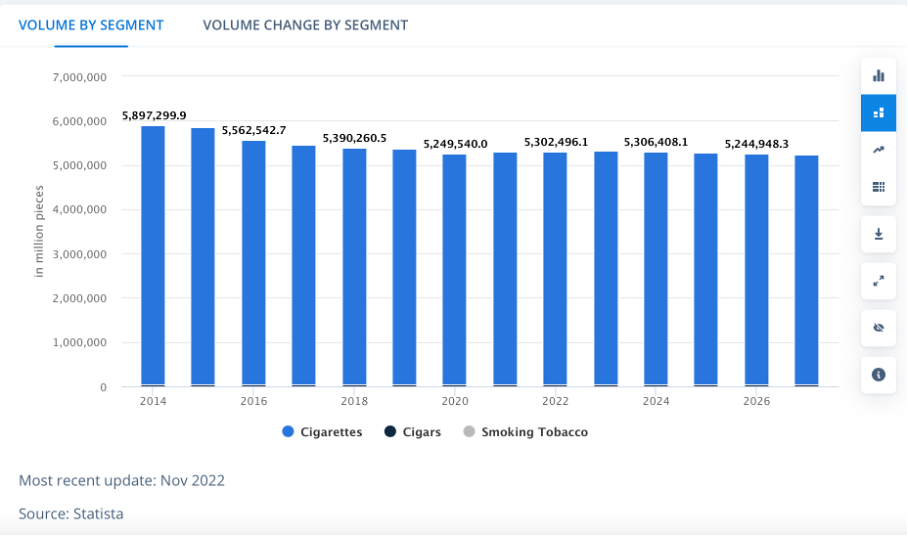
Philip Morris’ Heated Tobacco Units Are Popular
Looking at Philip Morris, we see strong volume growth which was mainly driven by heated tobacco units (HTU). Year-to-date in-market cigarette sales are up 1.4%, while heated tobacco units sales are up 19.2%.
Philip Morris’s IQOS is the number two selling HTU brand in countries where it is available. Brand recognition is skyrocketing across the globe, and on April 30, 2024, Philip Morris will take full control of IQOS commercialization rights in the United States. This is a key factor in the company’s expansion, adding an estimated 60% to the existing smoke-free international market. Philip Morris target is to obtain 10% market share of cigarettes and HTUs by 2030.
Exceptional cash flow generation (PM 3Q22 investor presentation)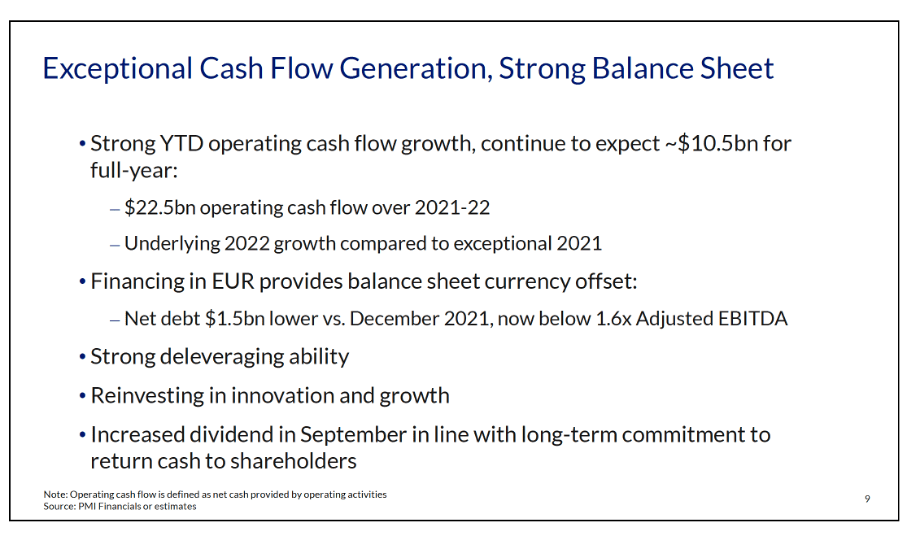
The company’s revenue dropped by 4% in 2020, but it rebounded strongly in 2021, growing by 9%. Over the past four years, net income has increased by an average of 11% while free cash flow has remained stable. The company has a healthy free cash flow margin (at 36%) and returns a large amount of money to shareholders.
Philip Morris financial results (SEC and author’s own graphical representation)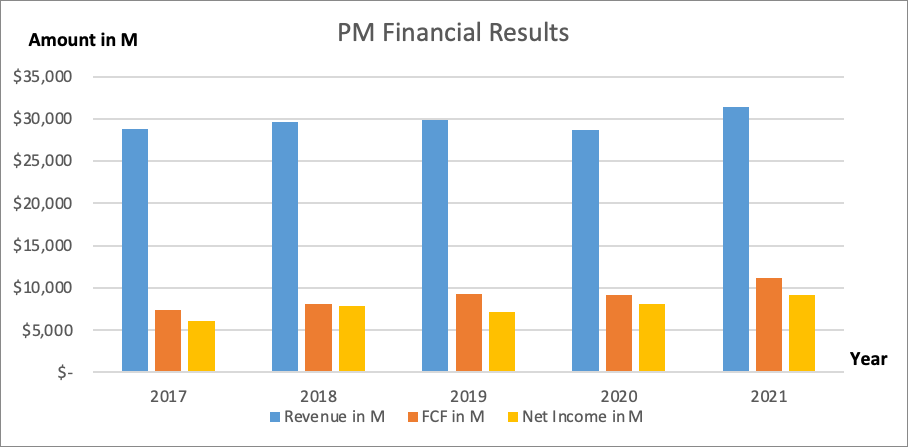
|
Year |
Revenue in M |
Revenue growth |
FCF in M |
FCF growth |
Net Income in M |
Net Income growth |
|
2017 |
$ 28,748 |
$ 7,364 |
$ 6,035 |
|||
|
2018 |
$ 29,625 |
3% |
$ 8,042 |
9% |
$ 7,911 |
31% |
|
2019 |
$ 29,805 |
1% |
$ 9,238 |
15% |
$ 7,185 |
-9% |
|
2020 |
$ 28,694 |
-4% |
$ 9,210 |
0% |
$ 8,056 |
12% |
|
2021 |
$ 31,405 |
9% |
$ 11,219 |
22% |
$ 9,109 |
13% |
The company has done well despite regulatory headwinds thanks to its innovative new products. Philip Morris still faces reputational risk due to the publicity surrounding the harmful effects of tobacco use. Philip Morris may find it more challenging to attract and retain customers as a result of the public’s negative perception of and reaction to the tobacco industry. Even with the recent growth, heated tobacco sales still only account for 30% of total sales.
Philip Morris Is A Dividend Compounder
Philip Morris is a classic dividend compounder, and over the previous 10 years it has boosted its payouts by 4.5% per year on average. The dividend yield is currently 5%, and the dividend rate is $5.08 per share.
Dividend growth history (Seeking Alpha PM ticker page)
Philip Morris has a history of increasing dividends while not repurchasing many shares of stock. The free cash flow has increased significantly, and the return to shareholders in 2021 was 74%. The average return to shareholders has been around 80% over the long term.
Philip Morris cash flow highlights (SEC and author’s own calculations)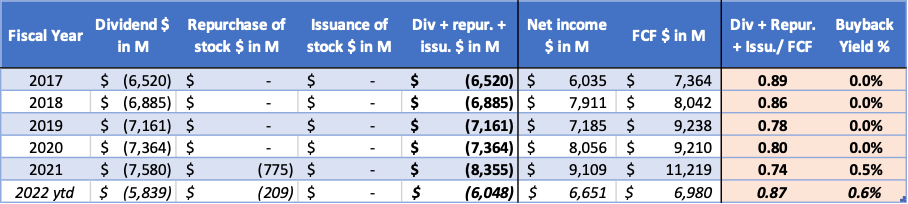
If the corporation is successful in growing its free cash flow, then the dividend per share should also grow. It is estimated that there will be a 3.4% increase in the dividend paid out per share in 2024.
Stock Valuation In Favorable Territory
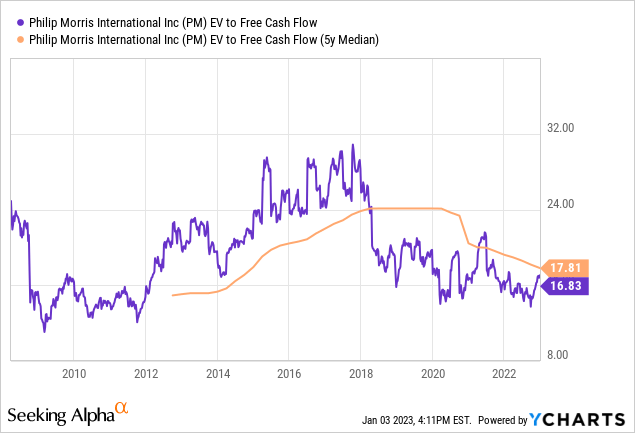
Finally, we take a look at the stock’s current valuation. Because the company’s net debt as of the third quarter was $21.9 billion (giving it a net-debt-to-equity ratio of 1.56), I choose to use the enterprise value to free cash flow ratio. This incorporates both cash on hand and outstanding debt into the overall valuation figure. The ratio is currently at 16.8, which is a little bit lower than its median of 17.8 for the past 5 years. I believe that the company is fairly valued, particularly taking into consideration the strong dividend yield of 5%.
Conclusion
In 2022, dividend stocks performed admirably, as their total return was just slightly negative at -0.46%, in contrast to the performance of the S&P500, which was -17%. Philip Morris is a dividend stock that has a high free cash flow margin of 36%, most of which is returned to shareholders by distributing dividends. The company has a long history of paying dividends to its shareholders.
Tobacco companies are particularly vulnerable due to the regulatory concerns they face. The use of tobacco has been reduced as a result of a variety of measures, and it is anticipated that global sales of tobacco would decrease. According to estimates, the majority of revenue comes from China, which accounts for 31% of total revenue and has the largest geographic share.
In a swift move to increase their market share, Philip Morris came out with IQOS, which are heated tobacco units. Revenue from heated tobacco units increased substantially by 19% year over year, and IQOS is now the second most popular nicotine brand in markets where it is offered. Beginning in the second quarter of 2024, Philip Morris will have complete control over the commercialization rights in the United States. This is a significant driver for the company as it will add around 60% to the existing smoke-free international market.
The financial results are very robust, and the company distributes approximately 80 percent of its free cash flow by distributing dividends to its shareholders. The dividend yield is currently at 5% and is anticipated to climb by 3.4% over the course of the following year. As investors who are concerned about environmental, social, and governance issues run from the shares, the company’s valuation has improved. Therefore, the share price is quite appealing to investors.
Be the first to comment