

Igor Vershinsky/iStock via Getty Images
Editor’s note: Seeking Alpha is proud to welcome Andrew Bordei as a new contributor. It’s easy to become a Seeking Alpha contributor and earn money for your best investment ideas. Active contributors also get free access to SA Premium. Click here to find out more »
It feels that it was years ago when investors were debating whether or not the Federal Reserve would raise rates at all in 2022, with many forecasting the highest probability outcome being that there would only be one 25bps hike the entire year. However, it has been almost a year since that debate gripped investors and amid countless market events occurring, ranging from the Russian invasion of Ukraine in February to the second biggest crypto exchange imploding along with institutional and retail investors’ money alike. While it is easy to pick a particular forecast out at a point in time and scoff at the inaccuracy compared to what later ensued, it would reveal an unhealthy bias. What determines an excellent investor is the ability to update one’s forecast slightly and often to reflect the constantly changing factors affecting the probability distribution. That brings us to the time of the year when it is necessary to look ahead and concretely develop a probabilistic outlook – that will undoubtedly need updating as time passes – for the year ahead. Inflation has been the key driver of markets in 2022 and will likely continue to be during 2023. For that reason, in this paper, I will do a deep dive on inflation with a focus on core inflation to understand where we stand today, what is most probable looking ahead and how investors can prepare their portfolios. Investors with heavy allocations to passive 60/40 portfolios and lack the diversification of alternatives will benefit from understanding the underlying drivers of inflation.
A Closer Look At Inflation
In my view, inflationary pressures the world is currently experiencing have been driven by two main factors. First is the fiscal proclivity to run deficits sponsored by central bank monetization of debt, with global central banks encouraging speculative behavior in the technology sector by pinning interest rates to 0% – and even negative in some countries – via unlimited quantitative easing resulting in the opportunity for almost anyone to raise seed capital with high valuations. The gasoline on the inflationary fire was the US government spending $5 trillion in pandemic stimulus to save the economy from a potential deflationary downturn. The spending during COVID-19 was the largest in history and I would argue greatly overdone with there being little economic need for a new round of stimulus checks in March 2021. The 2010s have been a decade hallmarked by underinvestment in energy and the real economy in favor of technology companies promising exponential growth with central banks encouraging feverish speculation with quantitative easing. Such economic behavior leaves countries in a vulnerable position to experience an energy crisis if there is any shock to demand or supply and subsequently, leading to an increase in inflation. The second factor is a societal attitude towards energy consumption and production that is detached from reality. By advocating for a transition away from fossil fuels when green energy is unable to support global energy expenditure a country would put citizens through unnecessary economic hardship. Not to mention creating security vulnerabilities that can be taken advantage of by bad actors. This is highlighted by the invasion of Ukraine and subsequent loss of cheap Russian oil directly to western markets; it was used to exploit an impractical energy policy pushed by European politicians. On a positive note, there is progress being made as Germany announced to keep two nuclear power plants running until April.
Now that we have set the background it is time to look at the data. First, we will be analyzing leading inflation indicators to understand where the trend might be heading 6 months or more into the future. Then we will look at the sticky core components of inflation that the Federal Reserve and especially Powell are watching like a hawk (pun intended). Leading indicators have seen a lower correlation to hard economic data – e.g., Philly Fed Prices Paid peaked in November 2021- for growth and especially inflation during the past two years. This is likely attributable to the change in consumption behavior due to the pandemic and will take time to readjust. Nevertheless, it is important to monitor leading indicators for any edge in forecasting the changing probabilities.
Created by Author using data from St. Louis Federal Reserve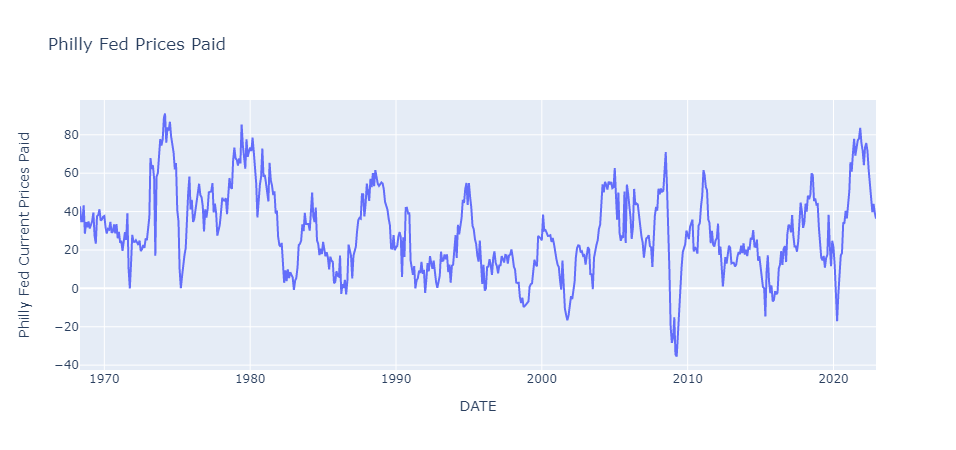
The current prices paid index from the Philadelphia Federal Reserve has trended well back to pre-inflationary levels that started in 2021. The recent release in January had a -0.24 z-score adding to the 7-month trend of deflationary forces in this American region. It is also important that the other regional data series of prices paid is showing the same trend across America. I believe it is increasing the probability of disinflationary forces that are in the pipeline for 2023. A more established data point showing similar conclusions is recent manufacturing prices data released by the ISM, declined for an eighth straight month. The latest reading of 39.4 – pictured below – is extremely low for an inflationary cycle and is very close to the bottom on a level’s perspective compared to previous cycles. Analyzing ISM manufacturing prices during different regimes provides eye-opening information. During the 1970-1989 period of high inflation ISM manufacturing prices averaged 67. On the other hand, the disinflationary period between 2000 and 2019 the average was only 59. A 12% increase sustained over an extended period of years is significant for a family’s budget and in turn the demand likely to be made by workers to have their salary increased to keep up with the inflation. Taking the average of ISM manufacturing prices from 2020 until today, we reach the same number as the 1970-1989 period, at 67. If the assumption is made that 2020 marked the beginning of a new regime with higher inflation – which is highly likely – I believe we can expect this time series to begin rising again in the not-so-distant future.
Created by Author using data from St. Louis Federal Reserve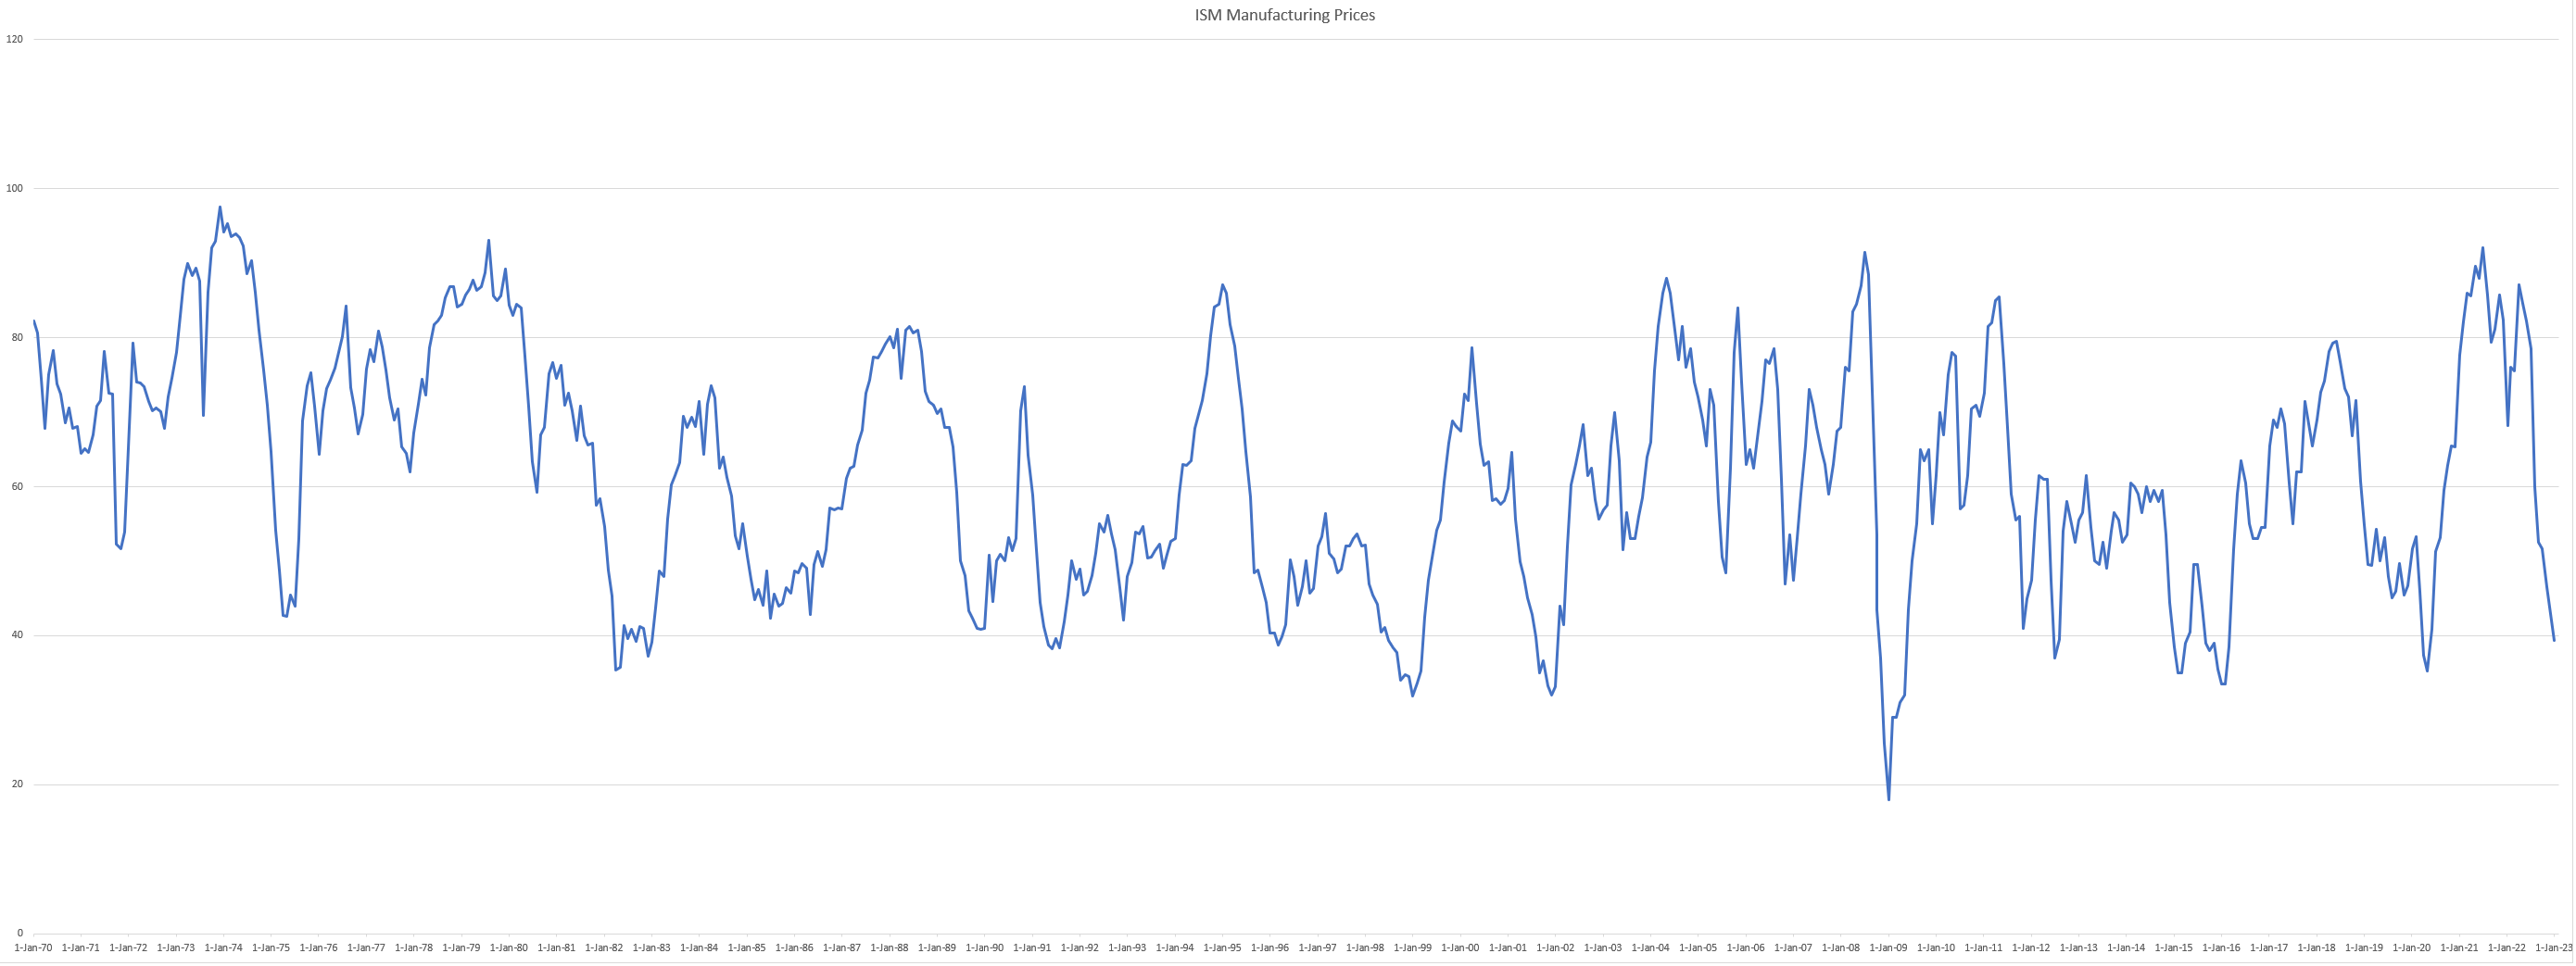
Breaking Down Core CPI
Having analyzed the leading data which has broken down from its highs and put disinflationary forces in the pipeline for the goods sector we will now look at the sticky services side of inflation. The lockdowns in 2020 caused a temporary eradication of many services resulting in the highest pent-up demand of any sector that is still proving steady to this day after two years. Populations now are inclined to eat out more and finally take holidays that were postponed during COVID. The strong US economy on a coincident basis is working in tandem adding to the strength of core services inflation. When discussing core CPI, it is important to define specifically what metrics we are examining and their impact on inflation. In my personal experience when reading economic research, it is very rarely, if ever stated the component weights of core inflation, leaving the reader at the mercy of hoping the researcher is painting the picture objectively. Core CPI is comprised of two categories. The first is “Commodities less Food & Energy Commodities” making up 27% of the index. It has five subcategories, and we will be analyzing two of those subcategories with the highest weights, in order to get a unique perspective on the main category. The second category, “Services less Energy Services” comprises an enormous portion of Core CPI, at 73%. This contains five subcategories as well, with my analysis again covering the biggest subcategory, being “Shelter”. Now that we have dissected the Core CPI index, we can inspect different components of inflation and I highly recommend you refer back to this paragraph to understand the significance of the data provided.
The first metric of Core CPI that I will be discussing is commodities excluding the volatile food and energy components, the second largest component of Core CPI. By extracting the time series of oil and grain commodities which exhibit a higher volatility, an unambiguous perspective can be drawn from the commodity market. Per my analysis, Commodities less Food & Energy has peaked on a level’s perspective in August 2022, being a significant deflationary force with the latest reading for December -3.96% month over month annualized (M/M Ann., moving forward) and -4.84% 3-month annualized (3M Ann., moving forward). In my view, these numbers are a positive development in the data regarding core inflation helping to keep it steady around 6% and not continuing its previous acceleration that started in February 2021. The initial progress while promising in Commodities less Food & Energy will need to continue and develop a trend for 9 or more months in order to assist in bringing Core CPI back to the 2% target set by the Federal Reserve.
Created by Author using data from St. Louis Federal Reserve
In economics, it is important to not take data at face value and conduct tedious research under the surface with the goal of attempting to understand the causal forces driving an economy. For such a reason I will be analyzing the biggest drivers Commodities less Food & Energy to interpret what is occurring beneath the surface. Per my analysis, the largest driver was the New Vehicles index that started a nearly vertical ascent in April 2021 contributing as one of many factors increasing core inflation. I believe on a rate of change basis New Vehicles have peaked after putting in a double top. The most recent data that was released added to an improving picture for New Vehicles with 1.39% 3M Ann., compared to the last peak of 11.5% in June 2022. Along with an even better -0.72% M/M Ann., relative to an April 2022 peak of 14.6%.
Created by Author using data from St. Louis Federal Reserve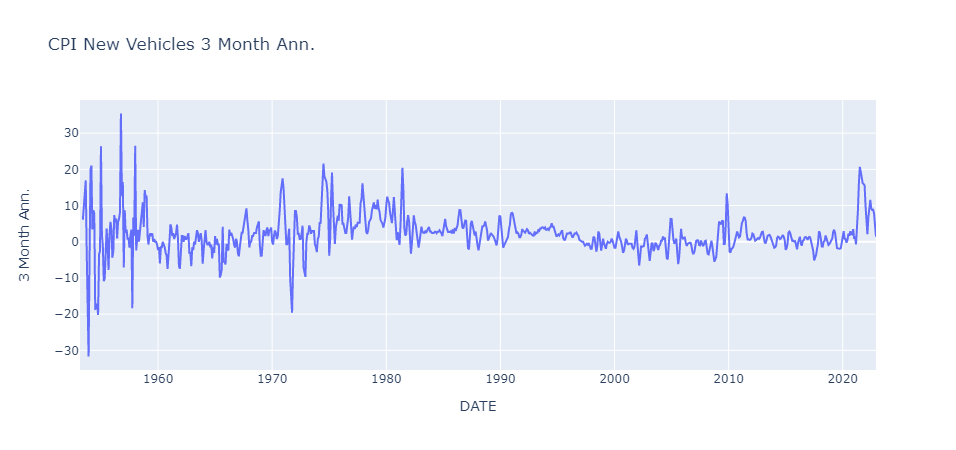
Is The Semiconductor Shortage Over?
In my view, the inflationary pressures in automotives are slowly improving and will need to continue this trend. During the COVID-19 pandemic, the fragility of the semiconductor supply chain was exposed when manufacturers shifted focus from producing older, lower-margin automotive chips to higher-demand and higher-margin semiconductors for video game consoles and smartphones. This strategic shift of focus bade well for customers that were under lockdown measures with a new need to create a technologically advanced space in their home for the dual purpose of work and entertainment. The ensuing months meant that customers had exceptionally long delivery times for new cars, while many of the biggest auto manufacturers such as GM and Stellantis had to shut down production at factories. Since the depths of the pandemic semiconductor shortages have improved with demand starting to realign with the current supply. New investment of $40 billion by TSMC into building two factories in Arizona will help increase the dependability of the supply chain after 2024 when the first factory will begin production of 4-nanometer chips. I believe barring a reacceleration of shortages driven by pandemics or a Chinese invasion of Taiwan before 2024, New Vehicles are likely to continue their trend lower as the semiconductor shortage eases and a glut is likely to ensue.
It is not a coincidence both metrics of Core CPI that we have analyzed so far began increasing during the start of 2021 when the third and final round of stimulus checks were dropped from a helicopter in America. The second and last metric of Commodities less Food & Energy we will take a closer look at displays the same pattern. Used Vehicles inflation after starting its trend higher at the beginning of 2021 fueled by semiconductor shortages -as discussed earlier-has peaked in January 2022. Reinforcing this stance is the most recent data released in January for Used Vehicles is -27% 3M Ann. and -26% M/M Ann. December inflation in Used Vehicles has continued its trend lower acting as a significant force of deflation on core inflation. Per my analysis, the easing of the semiconductor supply chain and economic strength is unlikely to maintain its current level, leaving the high probability that demand for used vehicles will continue to decline into 2023.
Created by Author using data from St. Louis Federal Reserve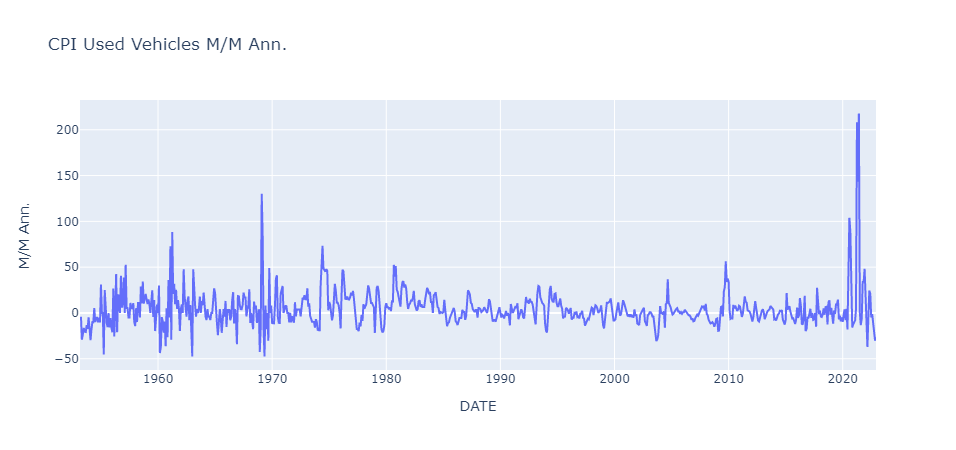
Core Services Remain Stubbornly Elevated
The consensus view during the pandemic was that during a reopening, goods demand will cool and come back into equilibrium with a then, much lower demand for services. The logic behind this view is that people used the government stimulus to fund the purchases of goods (TVs, game consoles, etc.) to relieve their boredom of being locked down. And once the economy reopened the urge for consumers to indulgently spend on goods would pass while slowly taking advantage of the previously unavailable services. Subsequently, bringing down goods inflation as the real economy shifted its buying power back to pre-pandemic trends. On the contrary, the pent-up demand for services created an enormous boost to inflationary pressures, exacerbated by a labor shortage in the sector. Let us focus on the best metric that captures services inflation, Services less Energy Services, which is the biggest driver of Core CPI making up 73% of the index. The most recent data released in January has been mixed with a slight deceleration in the 3M Ann. metric to 6.13% compared to last month’s 7.15% but the negative note has been a bounce higher to 6.76% M/M Ann. compared to 5.35% in the previous month. Both metrics, however, are still above the federal interest rate. I believe there is the high probability the peak in core services will remain intact for this cycle. Nevertheless, the lagged nature in which core services data responds to the economy will result in a slow trend lower with much stickier inflation especially if a strong labor market continues.
Created by Author using data from St. Louis Federal Reserve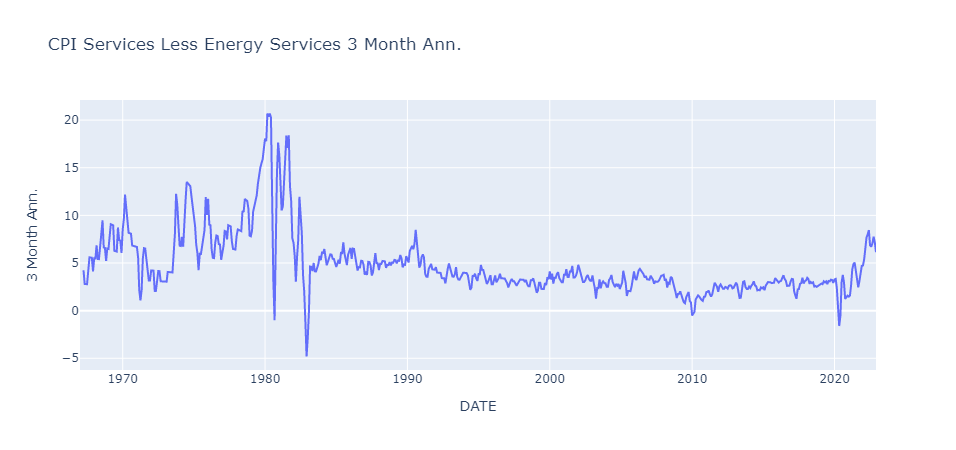
One of the fundamental desires of humans is to have a relatively safe place to shelter from the outside world. In recent years there has been a political debate taking place in the background on whether housing should be an unalienable right provided by the federal government to all citizens specifically those lower on the socioeconomic ladder. To debate, the merits of each stance on the issue are beyond the scope of this paper. However, I bring up the matter to highlight how economics and politics are intertwined in a self-reinforcing loop for better or – as is usually the case – worse. Shelter inflation has proved to be the biggest driver of elevated core inflation throughout 2022 and January data is again adding to that trend with a new high in both the 3M Ann. metric of 9.15% and M/M Ann. of 10%. The BLS (Bureau of Labor Statistics) calculates the Shelter component of CPI by collecting the data on rent from 50,000 people and updating the rent of each unit twice a year. Comprising of 57% of Services less Energy Services and due to the lagged nature with which the data is aggregated in my view shelter inflation is likely to continue moving higher throughout the first few months of 2023. However, there is good news on the shelter inflation front. Higher frequency data tracking rents on a monthly basis with a 92% correlation to Shelter CPI have peaked in September in the 3M Ann. metric and has been slowly trending lower. I believe the trend will continue given the weakening backdrop for global growth, it will mean a peak in shelter inflation showing up in the CPI around March 2023. And likely a trend lower moving forward into the latter half of 2023 with Shelter CPI being the biggest driver of core services inflation a trend reversal would be significant.
Created by Author using data from St. Louis Federal Reserve
Connecting The Dots On Inflation
After examining the biggest drivers of core inflation, we have a better understanding of the current inflationary picture and what is most likely moving forward. The biggest components of Core CPI Services less Energy Services are still above the Federal Funds Rate amid a very slight deacceleration in the upward trend. While higher frequency data has shown that a peak is ahead for shelter inflation, in my view, it is critical the Federal Reserve continues on their tightening path to ensure that interest rates do not move lower and financial conditions loosen subsequently, with lower inflation increasing consumers’ real income. The outlook on inflation is more positive moving forward barring any geopolitical shocks. Per my analysis, disinflation is very likely to be the trend in 2023 with many tops having been confirmed or soon to be among CPI components. However, with a secularly strong labor market that is experiencing 6.1% YoY wage growth, inflation has a high probability of bottoming around 4% and requires exponentially tighter policy to bring it down to 2%.
We are currently in every central banker’s nightmare of services inflation proving to be extremely sticky and elevated on a stand-alone basis, and also when comparing it to other metrics of consumer inflation. Whether you prefer to evaluate inflation data on an M/M Ann. or 3M Ann. timeframe, both are above the current federal funds rate. Conventional wisdom and empirical evidence say that in order to rein in inflation interest rates have to be raised above the inflation rate. In today’s case, the most popular measures of inflation are still higher than the federal funds rate such as: CPI 6.5% year-over-year or Core CPI 5.7% year-over-year. I believe if the Federal Reserve is going to succeed in quelling the inflationary fires that have been unleashed, they will have to keep rates at or above 5% for all of 2023 or until a major downturn occurs in the real economy or financial stability is at risk from a breakdown in the treasury market. Having to continue down the current path of hawkish policy is necessary in order to avoid the mistake of the 1980s, by cutting too soon and creating a double top in inflation resulting in an even more aggressive second tightening cycle. Furthermore, as witnessed in the 1980s the economic pain required to bring down inflation will be significantly higher during the subsequent round of tightening.
Takeaways For Investors
As alluded to in the beginning of the paper traditional 60/40 portfolios are vulnerable to the current economic environment of falling inflation and growth with tighter monetary policy. The conventional strategy during deflation was to increase exposure to long-term bonds to hedge equity losses. But with the bond market already pricing in inflation returning to the Federal Reserve’s 2% target, I believe this isn’t the best allocation of capital. There are 3 main options investors can choose from:
- Reducing exposure to the 60/40 portfolio and having a healthy amount of capital in cash to buy equities and bonds when a major sell-off occurs.
- Shifting bond duration exposure from the long end to the short end of the curve. 1-month bills to 2-year notes are yielding above 4% providing a good return source with much lower risk relative to the long end.
- Higher allocation to alternative strategies. There are many alternatives that increase a portfolio’s alpha and decrease correlation to the overall market for example: trend following, long-short, relative value, etc. These strategies can help insulate losses during a bear market.
Every investment requires a trade-off between risk and reward; however, I hope after reading my paper, investors will be better prepared to make these decisions and understand the possible outcomes for inflation during 2023.
Be the first to comment