

Nuthawut Somsuk
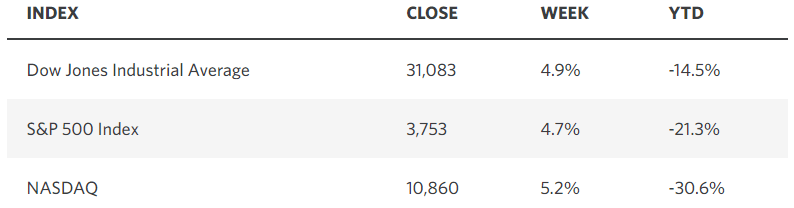
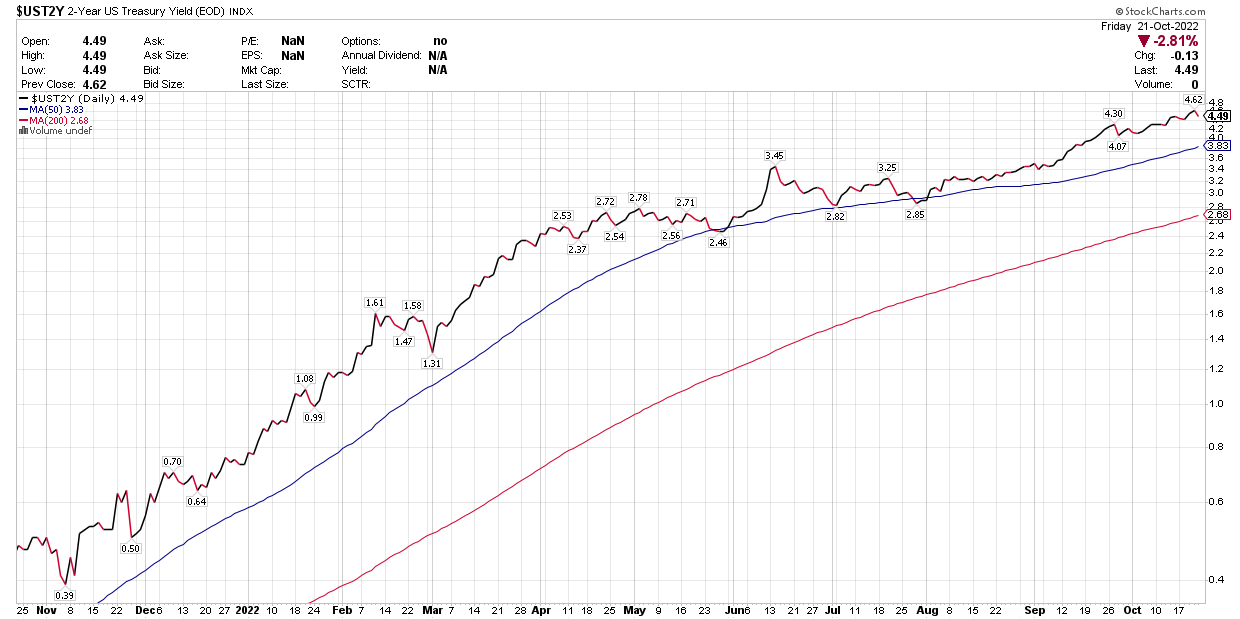
The major market averages had their best week since June with near-5% gains across the board, increasing the likelihood that a fourth-quarter rally is underway, which should be further fueled by the passing of the midterm elections on November 8. Stock prices are in a tug-of-war between better-than-expected earnings reports and the relentless run up in bond yields. While profits reports are exceeding expectations, Treasuries have been on their longest weekly losing streak since 1984, driving yields higher. Early Friday morning the 10-year Treasury yield touched a new high of 4.33%, while the 2-year yield reached 4.62%, weighing on stocks at the open until a Wall Street Journal article from a well-known Fed watcher gave new life to the bullish narrative.
Edward Jones
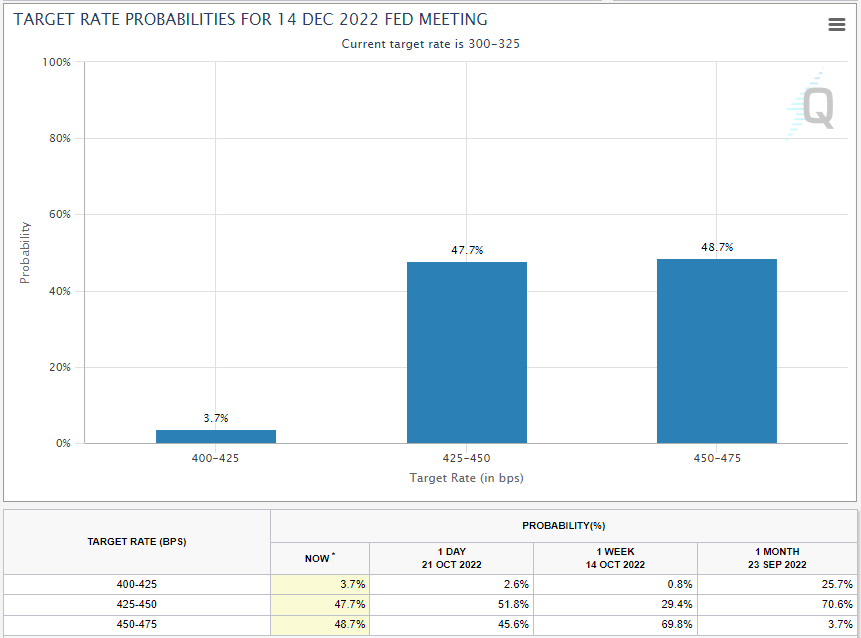
Nick Timiraos, who evidently has the ear of a Fed official or two, wrote that a 75-basis-point rate increase is a guarantee at next week’s Fed meeting, but that discussions about reducing the size of a December hike to 50 basis points is gaining ground. The probability of a 75-basis-point hike in December plunged in the futures market from almost 70% to 45%, while chances of a 50-basis-point hike soared from 29% to almost 52%. That is the pivot bulls wanted to see, and it served as rocket fuel for stock prices.
CME Group
I have been advising for several months to focus on what the Fed does and not what Fed officials say they may do. This is because their words are meant to manage inflation expectations and suppress any enthusiasm for risk assets that may refuel the wealth effect, while they wait for their actions to date to impact the leading indicators of tomorrow’s inflation rate. Shrinking the size of the rate increases would be the first sign that Fed officials are finally seeing the impact of tighter monetary policy conditions, but they are wary of acknowledging it for fear of igniting a market rally. Regardless, I think the market is starting to sense the Fed’s inevitable pivot from a hawkish to more neutral stance, which should give bulls the upper hand.
Bloomberg
The sharp reversal in 2-year yields on Friday from a high of 4.62% to 4.49%, which underpinned the surge in stocks, is a reflection of the market’s conviction in a Fed pivot. As the market’s forecast for where the Fed funds rate will be approximately one year from now, we need the 2-year yield to stabilize or decline to see a sustained rally in the stock market.
Stockcharts
I think Fed officials quietly recognize that inflation break-even rates, supply-chain pressure indexes, and the prices paid by purchasing managers in the ISM and S&P Global surveys are indicating a much lower inflation rate next year. The most obvious and impactful of the leading indicators to future prices is the housing market, which is weakening rapidly in the face of what are 7% mortgage rates. Home price appreciation should continue to slow on an annual basis before we see modest price declines, which should be followed a similar pattern in rents. As such, I think the Fed’s December rate hike will be its last, as it begins to see a more definitive downtrend in the headline and core inflation rates during 2023. Then we should see the Fed move from neutral to a more dovish stance on monetary policy during the second half of 2023, as its rate hikes to date have their full impact on the rate of economic growth.
This week I expect a strong rebound in the rate of economic growth for the third quarter, which should near 3%. The bearish consensus is likely to say the number was inflated by a plunge in imports, narrowing the trade gap, and a rise in inventories. Yet it was a surge in imports and drop in inventories that resulted in declines of 1.6% and 0.6% during the first two quarters of the year. This volatility was the result of pandemic-related disruptions to the global supply chain and the war in Ukraine. These irregularities led to huge swings in what would have otherwise been more stable numbers, convincing many pundits that we are in or on the cusp of recession.
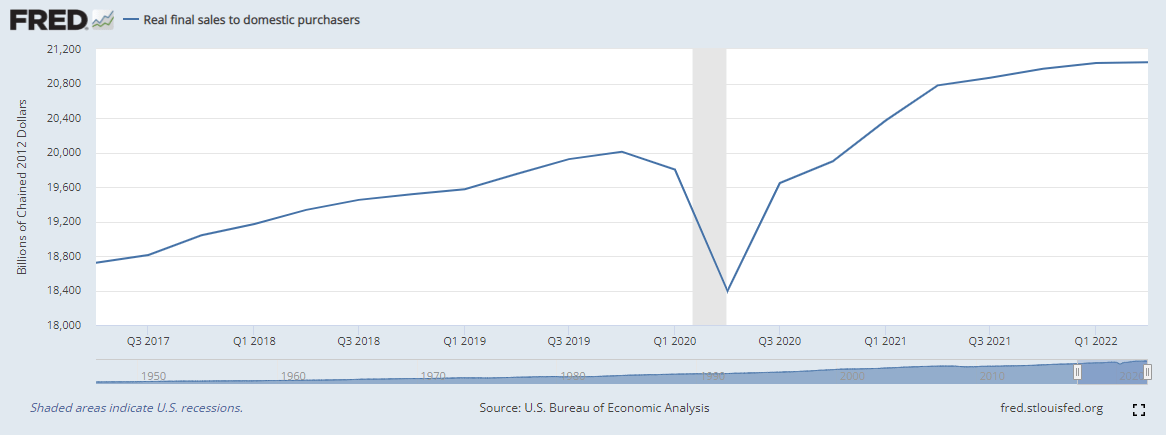
A far more reliable metric for the underlying rate of economic growth is final sales to private domestic purchasers, which includes consumption by consumers, businesses and government. It has grown consistently since the current expansion began in 2020, which is why the first half of the year is very unlikely to be ruled a recession by the National Bureau of Economic Research. While the rate of growth for this broad measure of consumption has slowed on an inflation-adjusted basis, it continues to grow, despite the rapid rise in prices over the past 18 months. I think the rate of inflation will taper more rapidly than any nominal decline we see in this broad measure of consumption over the coming year, fueling continued growth in GDP and avoiding recession in 2023.
FRED
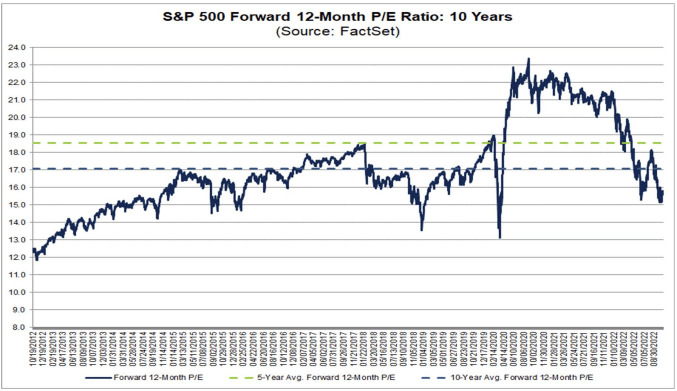
That will be the key to realizing continued growth in corporate profits, albeit significantly slower than what was realized over the past two years, but from significantly lower valuations levels.
FactSet
Economic Data
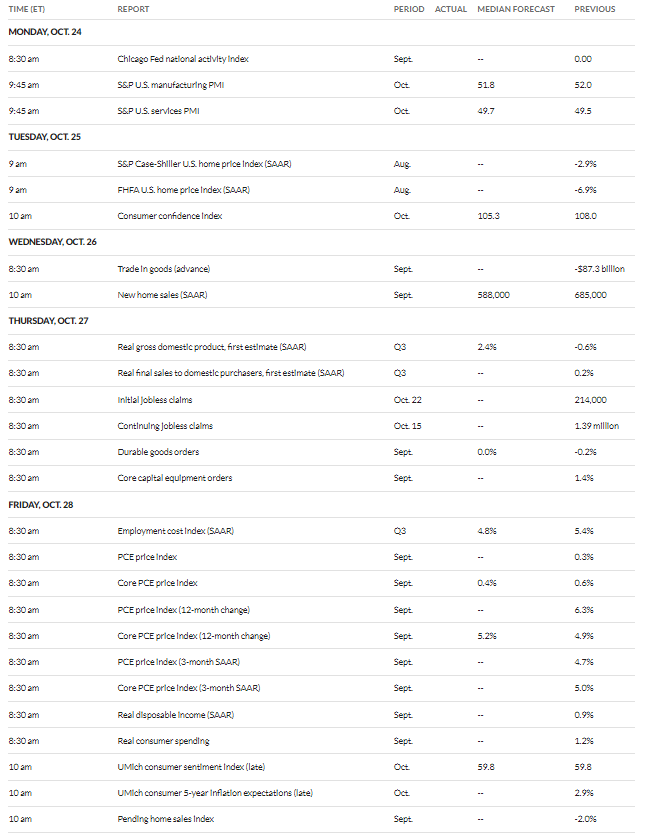
Tuesday’s home-price index is of particular importance, as it relates to the rate of inflation. I will also be focused on Thursday’s GDP report for the third quarter with respect to real final sales to domestic purchasers. Lastly, Friday brings the personal consumption expenditures price index (PCE) for September.
MarketWatch
Technical Picture
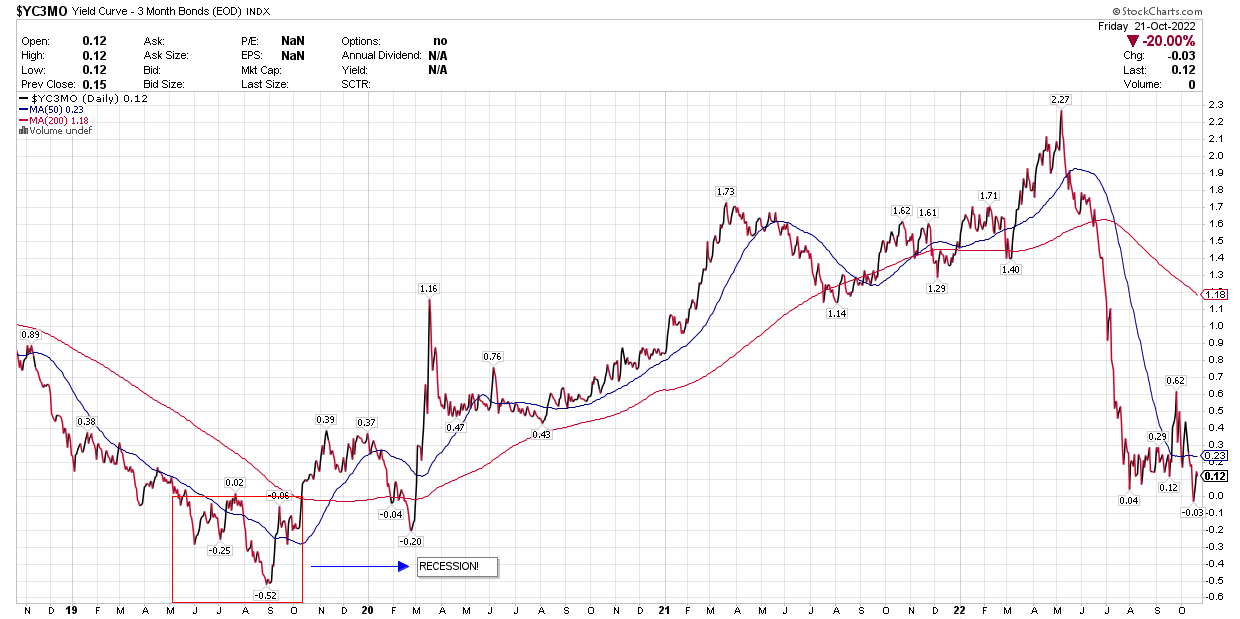
When it comes to recessions, the most reliable of yield-curve inversions is between the 3-month and 10-year yields, whereby the inversion occurs when the shorter-term yield is above the longer-term yield. This did happen momentarily last week, as in one day, when it inverted by 3 basis points before steepening again to what was 12 basis points on Friday. If the inversion of this curve were to be more meaningful and last longer, as it did in summer of 2019, I would take it as a clear warning sign of an impending contraction in economic activity. It has not happened yet.
StockCharts
Be the first to comment