

cemagraphics
This article was first released to Systematic Income subscribers and free trials on July 7.
It’s fair to say that the mortgage REIT sector has gotten the most attention on our service over the past month or so. A big part of this is due to the sheer price action in the sector, or at least in common shares, given the steep sell-off in agency MBS as 30-year mortgage rates hit a level of 6%.
In this article, we take a look at some of the considerations for investors looking across the mREIT space. We also highlight the key capital structure issues for investors thinking about allocating to preferreds vs. common securities. We use the popular Annaly Capital Management (NYSE:NLY) as a case study.
What’s Not To Like?
The basic appeal of an mREIT like NLY has been very obvious. NLY (like other agency-focused mREITs) holds almost entirely agency MBS securities. These securities have an explicit or implicit backing by the US government, depending on the specific GSE and thus negligible credit risk.
Secondly, they feature very high dividend yields – often in double-digit levels. For instance, the NLY common sports a 14.5% dividend yield – this is 65% more than the high-yield corporate bond market and about twice that of the loan market.
Third, mREITs often trade below book value which juices their dividend and also creates the potential for capital gains in case the stock price rises towards its book value.
Fourth, unlike fixed-income securities such as bonds or preferreds which have a “par” amount and which serves as an upside anchor and limits capital gains, the mREIT book value can, in theory, keep rising if its management does a good job adding value above the income stream it receives.
Fifth, agency mREITs carry a low-duration profile due to hedges in the form of interest rate swaps, swaptions and Treasury futures which limits their sensitivity to changes in interest rates.
A Few Flies In The Ointment
Despite all the reasons above, we have never held common shares of agency mREITs in our Income Portfolio.
The first reason is that agency MBS securities are not particularly high-yielding so even a relatively high level of leverage doesn’t create a compelling level of return.
For instance, agency MBS, using the S&P MBS index as one example, has a yield of 3.62% which is very close to what NLY showed as its average yield on interest-bearing assets in Q1 (the two measures are not directly comparable but they’re close enough for our purpose).
NLY and other mREITs will hedge out some of that yield so net interest margin is a better indicator and that came in at 2.04% in Q1 for NLY. So, back-of-the-envelope 2% leveraged 6.4x equates to nearly 13% which is pretty healthy.
However, that overestimates the actual yield of the company’s assets as it focuses on current yield (i.e. coupon / price) rather than yield-to-worst, ignores the cost of hedges and conflates interest and principal repayments. For a better gauge of the company’s likely longer-term profitability, we need to look at the MBS basis or the spread between MBS yield-to-worst and Treasury yields (a rough indication of the post-hedge yield that accrues to investors). This number has traded below 1% historically (it is currently fairly elevated at 1.2%). So, a much more sound back-of-the-envelope will be something like 1% of MBS basis x 6x leverage or closer to 6%.
NLY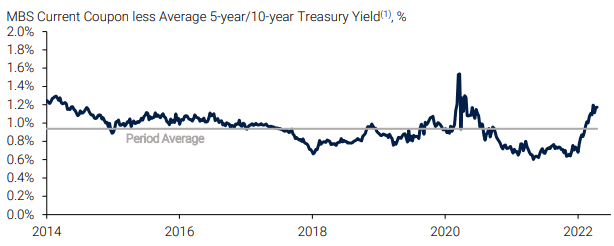
However, we aren’t done. To refine the back-of-the-envelope we would need to take into account expenses, turnover, hedging and trading costs and other factors.
Obviously, there are potential things on the positive side of the ledger as well. These are attractive carry on TBA dollar rolls, potential alpha from tilting to different MBS coupons which can behave differently in different rate environments etc. However, the key point remains – that even when leverage is high, if you take something that earns around 1% historically it’s pretty difficult to arrive at anything approaching a double-digit sustainable income level.
What this means is that, as shown above, mREITs will tend to overdistribute relative to their true earning capacity and we tend not to hold securities that do this.
The second reason we don’t hold mREIT common shares is that book value has tended to deflate over time – NLY book value is shown below.
Systematic Income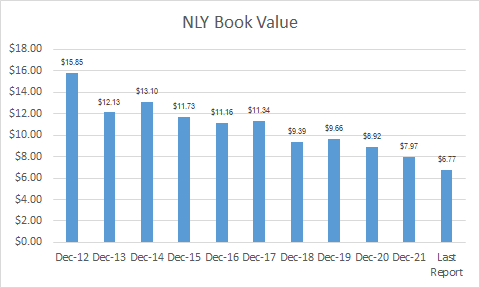
NLY is not unusual in this sense among agency mREITs – you will find the same dynamic (often worse) across other names as well. There are two primary reasons why this has been the case. First, is the simple fact discussed above that mREITs tend to overdistribute relative to their longer-term earnings capacity, in effect, using their book value for dividends. And two, mREITs will tend to periodically deleverage, locking in significant economic losses for investors.
We can see this in the chart above where the book value occasionally takes a decisive step lower. This happened in 2012 (during the Euro crisis), in 2018 (the Fed auto-pilot tantrum) and in 2020 (the COVID period). In short, during periods of high interest rate volatility mREIT book values can step down. However, unlike “traditional” common shares of companies, a deleveraging for an mREIT means that a book value increase to its previous level is nearly impossible as it now has fewer assets with which to make that happen.
To illustrate this more closely we can look at quarterly NLY book values over the COVID period. We see that book value fell by 22% over Q1-2020 due to a forced deleveraging and only peaked at $8.95 or 7% below the Dec-20 level before falling again. This dynamic of occasional bouts of volatility keep book values on a downward trend and further subtracts from mREIT returns.
Systematic Income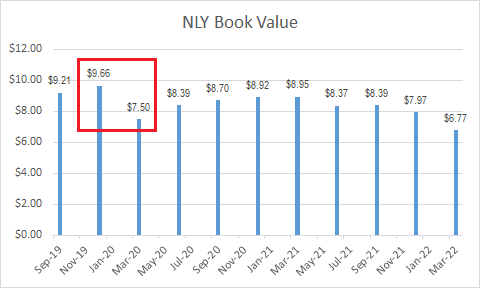
The knock-on impact of this drift lower in book value is that the earning capacity of the common share will move lower as well causing dividends to adjust lower over time. This also means that the currently much higher dividend yield on common shares is likely fleeting – investors who held NLY common shares for some time have much lower dividends on their cost basis. For example, the common had a dividend cut in 2020 of 12% and one in 2019 of 17%.
None of this is to say that investors can’t make money with mREIT common shares or that they are uninvestable. But it’s important to show that they don’t behave like traditional income securities which have some sort of contractual coupon and some sort of principal amount. A better way to look at common shares is as a leveraged trading strategy.
Overall, we are quite surprised by the amount of negative commentary about mREITs this year. Anyone who was aware that 1) agency MBS were trading at a very rich level relative to Treasuries, 2) the MBS basis (i.e. the different between agencies and Treasuries) tends to be quite mean-reverting and 3) the Fed was about to enter QT with a plan to reduce its balance sheet should have been well-prepared for the current outcome. However, if anything we find mREIT common shares much more attractive now than they were in 2021 on strict valuation grounds. This doesn’t mean we are buyers but it’s still worth saying.
A Preference For Preferreds
As suggested above, we continue to maintain a preference for preferred over common shares in the agency mREIT space. About a year ago we discussed this element of our investing approach and it’s held up very well since then.
The key principle that informs this approach is the simple fact that, in the agency mREIT space, preferreds have delivered similar or better absolute but better risk-adjusted returns than their common counterparts. The longer-term chart of NLY is shown below. What we see is that the common does have occasional periods of outperformance but it doesn’t tend to last. The preferred delivers similar returns with much less volatility. We do expect the common to bounce back and close the gap with the preferred over the medium term as it has historically but it’s difficult to have a lot of conviction in the common after seeing such massive drawdowns.
Systematic Income Preferreds Tool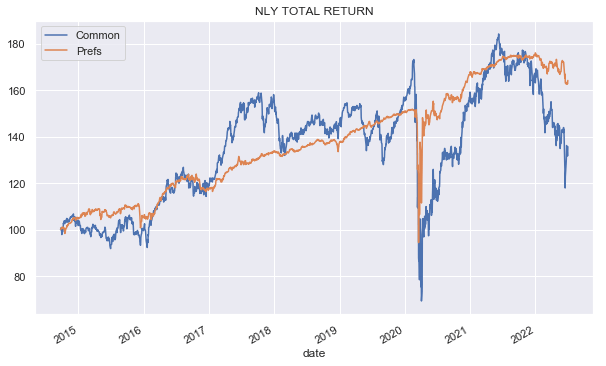
NLY has actually done fairly well comparatively. Other agency mREITs have not been able to keep up with their preferreds. This is how AGNC looks over time. The performance of the common has clearly been diverging more and more from the preferreds.
Systematic Income Preferreds Tool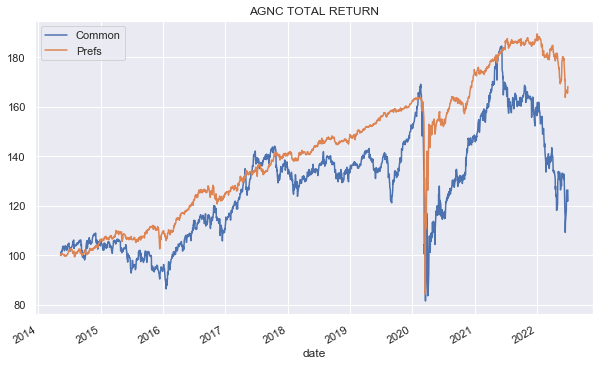
This is how ARR looks which is truly scary.
Systematic Income Preferreds Tool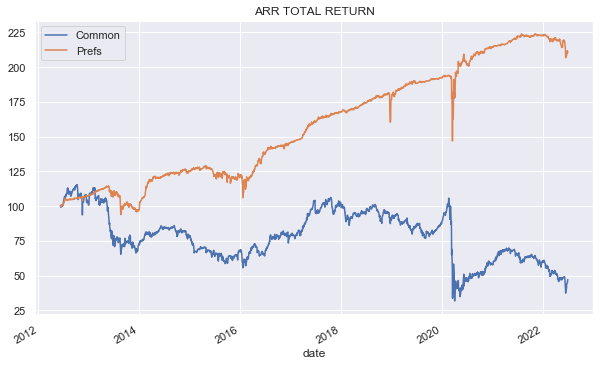
And this is how DX looks.
Systematic Income Preferreds Tool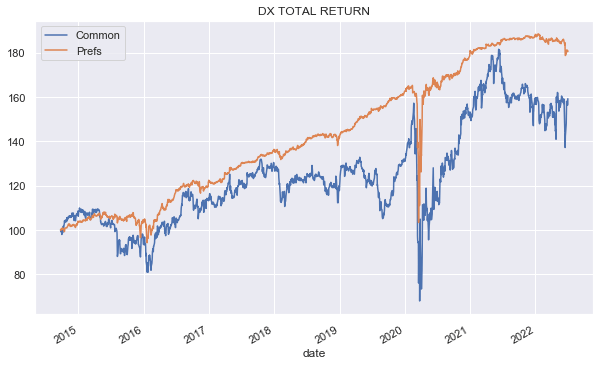
Again, this doesn’t mean that common shareholders can’t do well over certain periods but the longer-term common shareholder story doesn’t look amazing relative to the preferreds.
Does this mean that, if agency mREITs hold primarily assets without credit risk and preferreds are more insulated from the dangers of the mREIT portfolio strategy, that the preferreds are “safe”?
This is a question we looked at in an earlier article. The short of it is that a highly leveraged portfolio cannot be really called safe, for any sensible definition of the word, even if it holds securities with no credit risk. By our estimate the MBS basis has to blow out to about 3% for the equity of a typical agency mREIT to go to zero. In this scenario the preferreds are obviously worthless as well. This level in the basis is about 3x of what we saw during the GFC and the COVID shocks. It is extremely unlikely that the Fed will allow the basis to reach this level as it would be indicative of utter chaos in the fixed-income market. However, the key point here is that any agency mREIT security, whether common or preferred, relies on the backstop of the Fed to remain alive. Is it reasonable to assume the Fed will be there to backstop the market to prevent such a dislocation? In our view, it’s a reasonable assumption but it’s still an assumption.
Allocating Within The NLY Preferreds Suite
When we first highlighted out preference for NLY Series F (NLY.PF) at the end of April it was trading at the highest yield across the 3-series suite but this has changed as NLY.PF has outperformed.
Systematic Income Preferreds Tool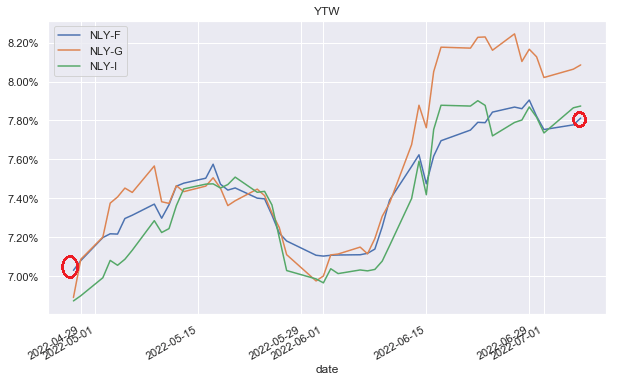
The key details of the suite are shown in the table below – an extract from our service investor Preferreds Tool.
Systematic Income Preferreds Tool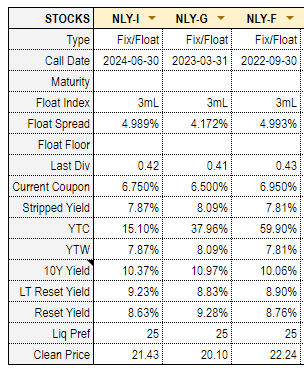
This outperformance is not surprising in the context of the 1Y Treasury yield that has moved from 2% to 2.8% over the same period – a direct result of a fast pace of hiking by the Fed.
The chief attraction of NLY-F is that it has the nearest first call date which also means that it switches to a floating-rate the earliest and benefits the first among the trio from the sharp series of Fed hikes.
Selecting the “best” series in the suite is a very tricky task for Fix/Float preferreds since investors need to be able to project the yield up to the first call period, estimate the likelihood of redemption and the likely path of short-term rates in the post-redemption period (when the stock will bear a floating-rate coupon). Doing this across multiple series with different coupons, prices, call dates and spreads over Libor would be a tough job even for Rain Man.
The way we distill this process is by plotting the yields for all the series based on current prices and Libor forwards which are future Libor rates implied by the current interest rate curve.
Systematic Income Preferreds Tool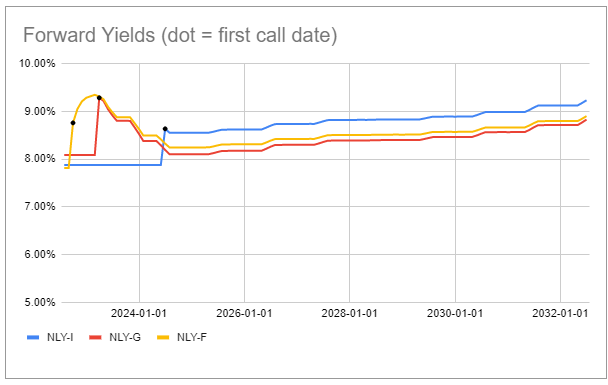
What the chart shows is that NLY.PF sees the first boost in its yield to about 8.76% (which we call reset yield) on its first call date of 30-Sep. This is based on the fact that the Libor forward on that date is 2.8%. So, adding the spread of 4.993% to 2.8% gets us to a coupon of 7.8% which on the current clean price of 22.24 gets us an expected yield of 8.76% on 30-Sep. If Libor is above 2.8% on that date, the yield will be higher and vice-versa.
The chart also shows that the yield of NLY.PF dominates that of NLY.PG if the stocks remain unredeemed. When we first highlighted NLY.PF, its yield also dominated that of NLY.PI, however that has changed overtime and NLY.PI has pulled away from NLY.PF in the period after its first call date of 30-Jun-2024. Specifically, NLY.PF is expected to have a yield advantage over NLY.PI of 1-1.5% for a bit less than two years but after June-2024 NLY.PI will have a yield advantage of around 0.30%.
This suggests that investors who think that the preferreds will stick around for more than 6 years or so should hold NLY.PI rather than NLY.PF. Investors who think that the preferreds will actually all get redeemed fairly soon, maybe in 2023 or 2024 may want to tilt to NLY.PG because it trades at the lowest clean price and offers the biggest upside to “par”.
Takeaways
The recent struggle of the agency mREIT sector has, once again, shined a light on the dynamics of common and preferred shares. Our view remains that, while it’s clearly possible to make a lot of money trading the common shares, the periodic deleveraging, dividend cuts, steady book value erosion and amazing volatility makes common shares very difficult as income holdings.
Within the NLY suite we continue to have a preference for NLY.PF, though its yield advantage in the suite has been deflating in the last few months as it has outperformed. Over the short-term, we expect it to outperform further as its yield on current price will rise sharply when it moves to a floating-rate coupon in a couple of months.
Be the first to comment