

RgStudio
It’s a scary time for many investors right now.
Daily Shot
We just saw the worst inflation-adjusted annualized returns for stocks since 1872 according to Goldman Sachs.
And 10% of U.S. stocks are down 90+% with nearly 33% down 70+%.
Recession fears are rising by the month, with more and more blue-chip economist firms saying that a mild, or even severe recession might be necessary for the Fed to slay the inflation dragon.
- A deep recession would be needed to bring down soaring inflation, and high prices are going to be very sticky, BofA says:
Deutsche Bank’s latest client survey found that 90% of respondents expected a U.S. recession by the end of next year, which was up from 35% of respondents in December, according to Bloomberg.” – Business Insider
David Rice
16 of 18 economic indicators have weakened in the last three months, and their average value (above historical baseline) indicates that a recession could begin within about seven months.
Daily Shot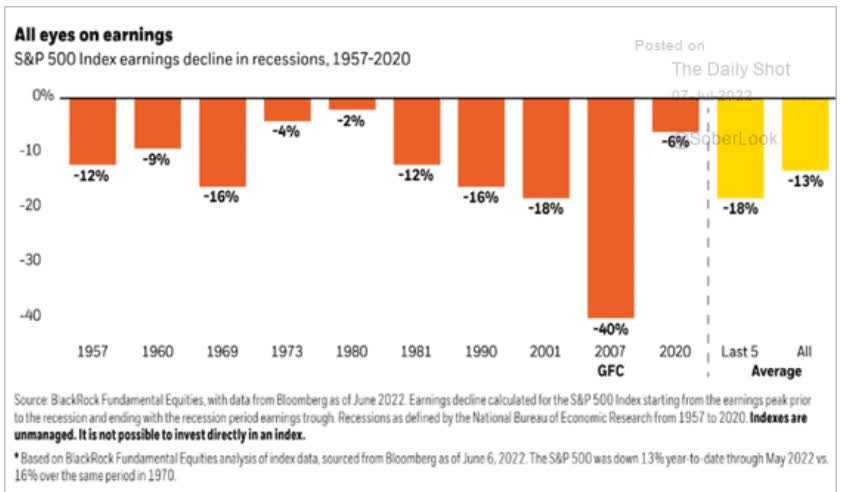
The average recession since 1957 sees earnings fall 13%, though the last five recessions have averaged an 18% decline.
Daily Shot
Based on the PMI data, the Financial Times estimates a 15% EPS decline might be coming.
- housing data points to a potential -20% decline
- Morgan Stanley’s base-case recession forecast is a 20% decline
The bad news is that recession risk is rising. The good news is that the world’s most dependable high-yield blue-chips can help you sleep well at night, keep growing your income, AND lock in incredible long-term income and wealth compounding that can help you retire in safety and splendor.
A new Dividend Kings member just got $100K in cash and is looking for some great ideas on how to generate the world’s safest 4+% income, as well as potential market, aristocrat, and even Nasdaq beating long-term returns.
So let me show you how I was able to screen for seven of the safest high-yield blue-chips, in a matter of minutes, to help this member put their hard-earned money to work in these uncertain economic times.
How To Quickly And Easily Find The World’s Safest And Most Dependable Blue-Chips Even With A Potential Recession Just Months Away
Here’s the screening criteria I used in the Dividend Kings Zen Research Terminal to get this list of world-class high-yield blue-chips.
- Ultra SWAN list (as close to perfect quality companies as exist, wide moat aristocrats and future aristocrats)
- good buy or better
- 3+% yield
- 11+% long-term consensus return potential (more than aristocrats and S&P).
Then I sorted by sector, and selected the highest total return potential high-yield Ultra SWAN for each sector, arriving at a diversified and prudently risk-managed high-yield Ultra SWAN portfolio that retirees can trust in any recession.
Finally, I used the Watchlist creation feature of the terminal to quickly create the following watchlist, which allows me to summarize the equally weighted fundamentals (up to 60 metrics) that I’ll be showing you today.
7 High-Yield Blue-Chips Retirees Can Trust In This Recession
Dividend Kings Zen Research Terminal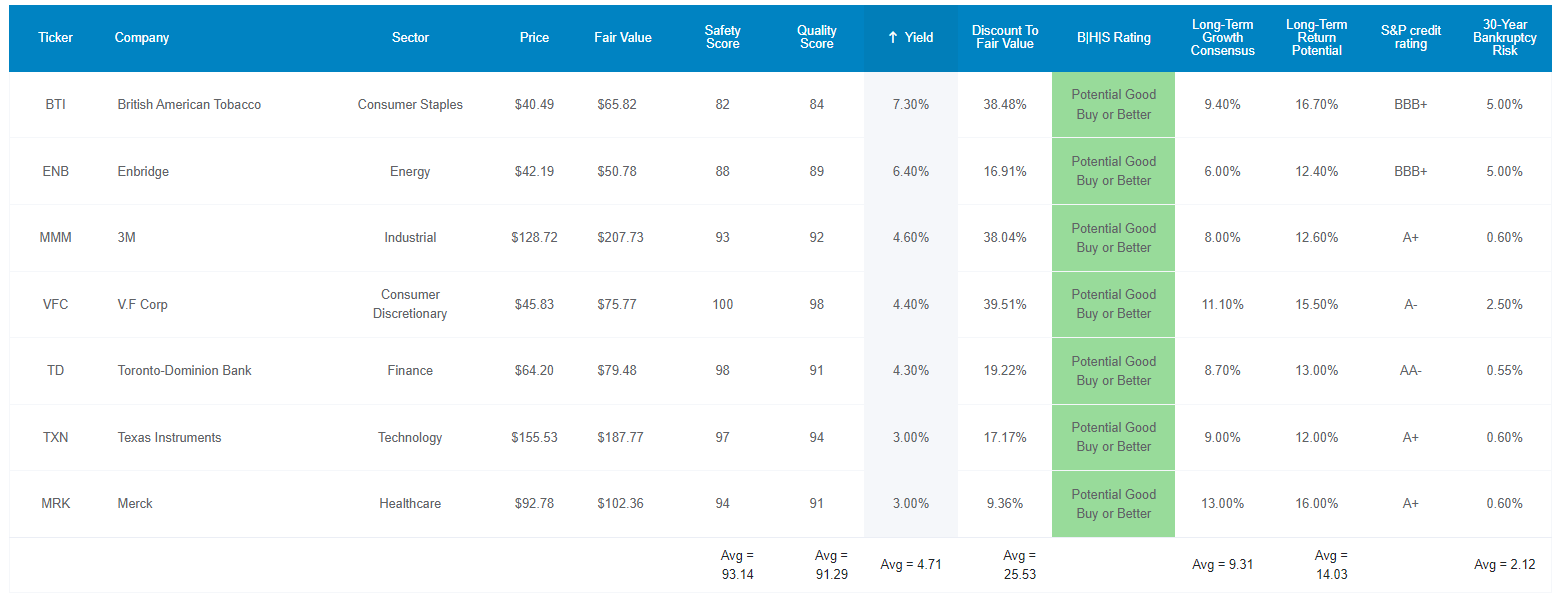
I’ve linked to articles providing deeper looks at each company’s growth prospects, investment thesis, risk profile, valuation, and return potential.
TD and ENB are Canadian companies:
- 15% tax withholding on dividends in TAXABLE Accounts
- none in retirement accounts
- tax credit available for US investors in taxable accounts to recoup the withholding.
Down Just 7% In 2022, About 1/3rd As Much As The S&P
(Source: Portfolio Visualizer Premium)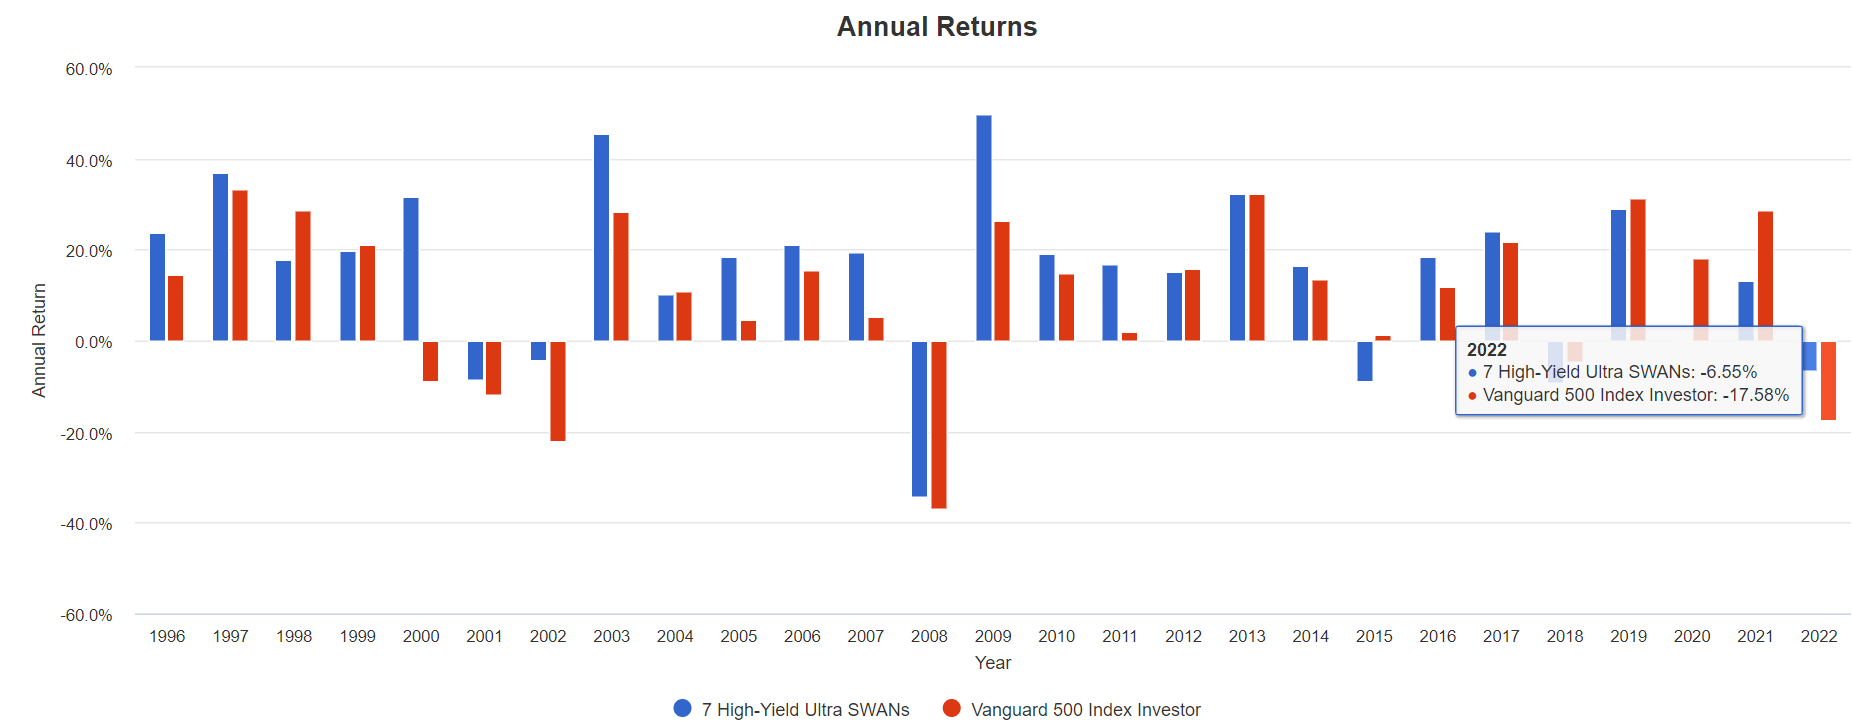
So far in 2022, these Ultra SWANs are acting very defensively, down less than 7%, about 67% less than the broader market.
FAST Graphs Up Front
British American Tobacco 2024 Consensus Total Return Potential
(Sources: FAST Graphs, FactSet)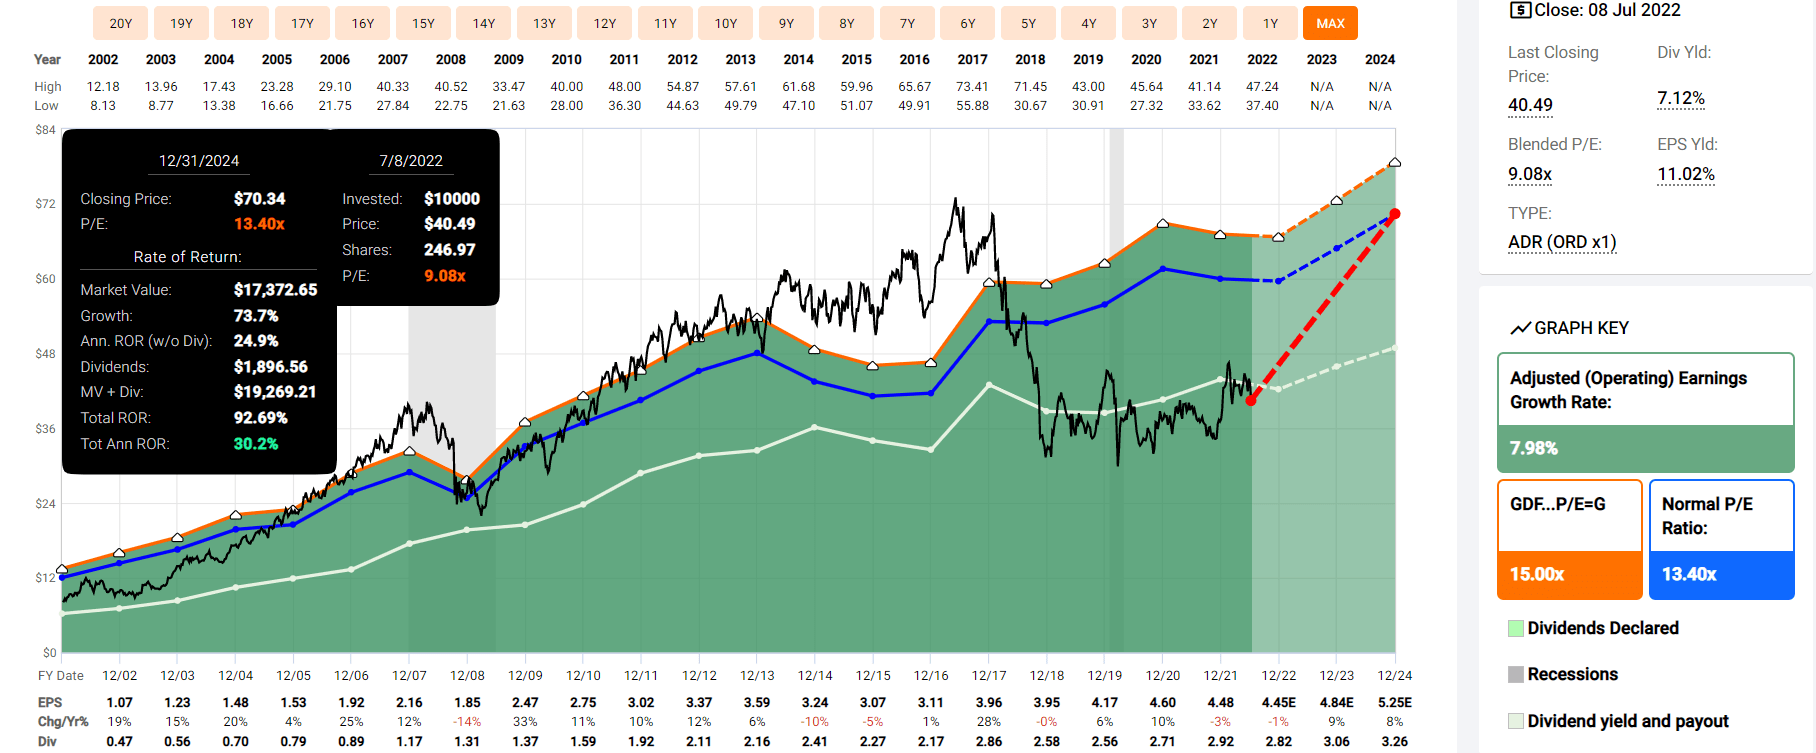
Enbridge 2024 Consensus Total Return Potential
(Sources: FAST Graphs, FactSet)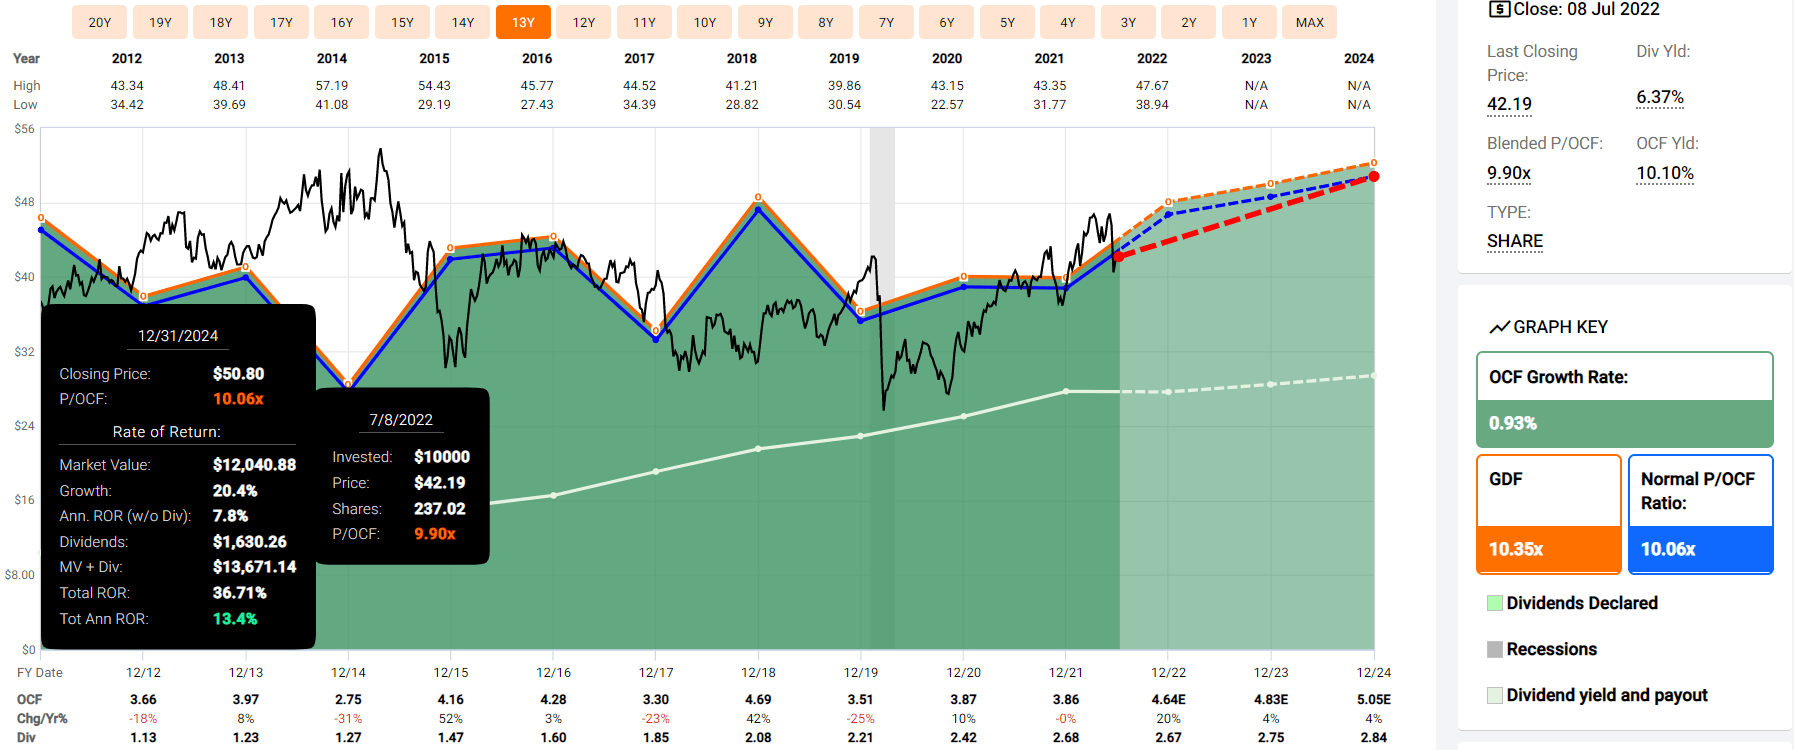
3M 2024 Consensus Total Return Potential
(Sources: FAST Graphs, FactSet)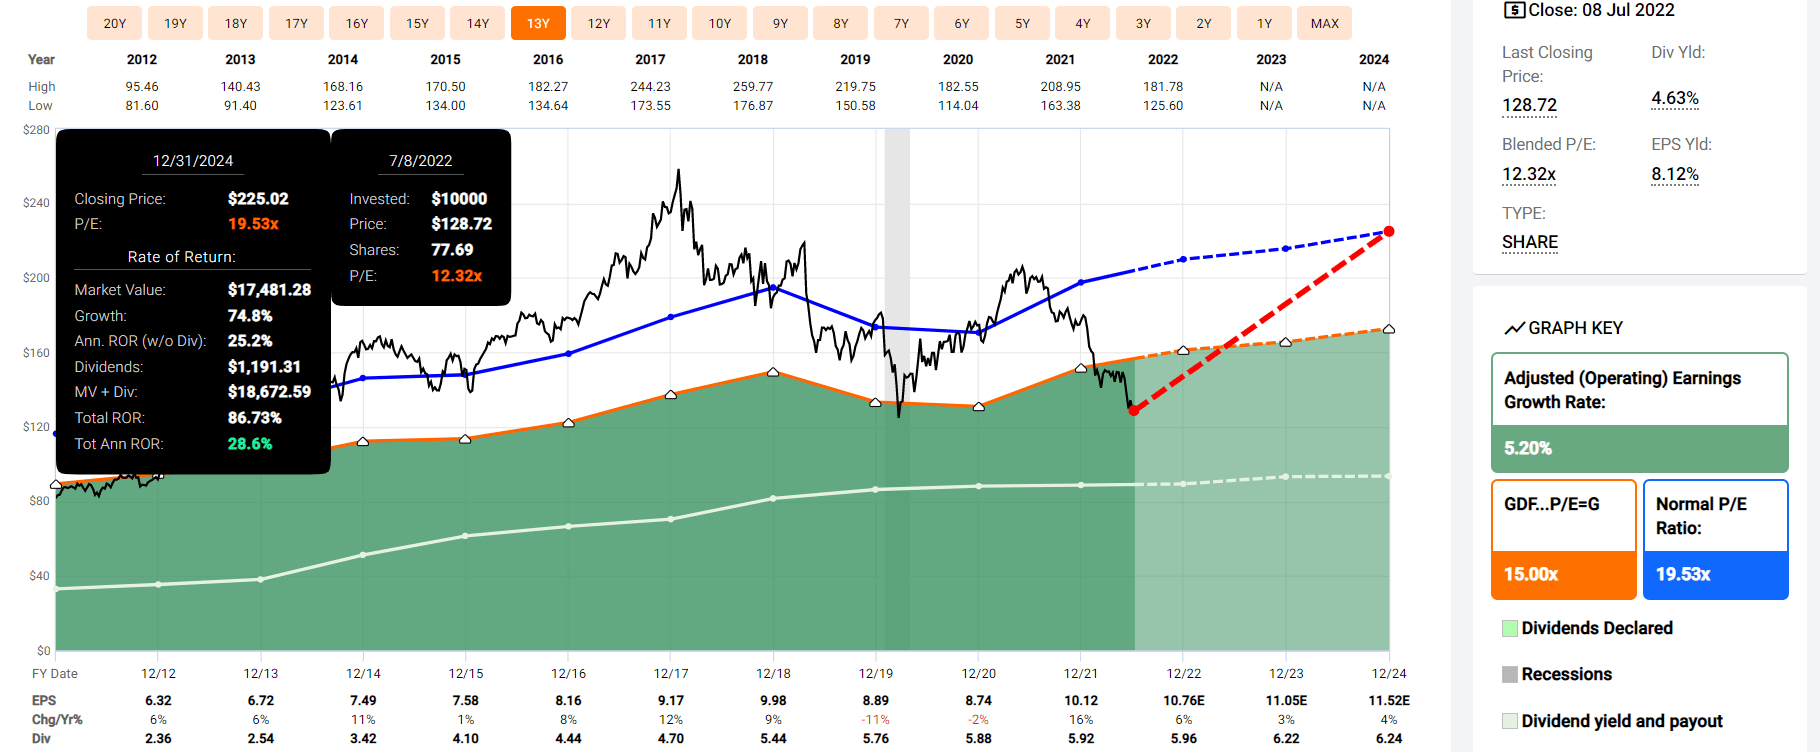
V.F Corp 2024 Consensus Total Return Potential
(Sources: FAST Graphs, FactSet)
Toronto-Dominion 2024 Consensus Total Return Potential
(Sources: FAST Graphs, FactSet)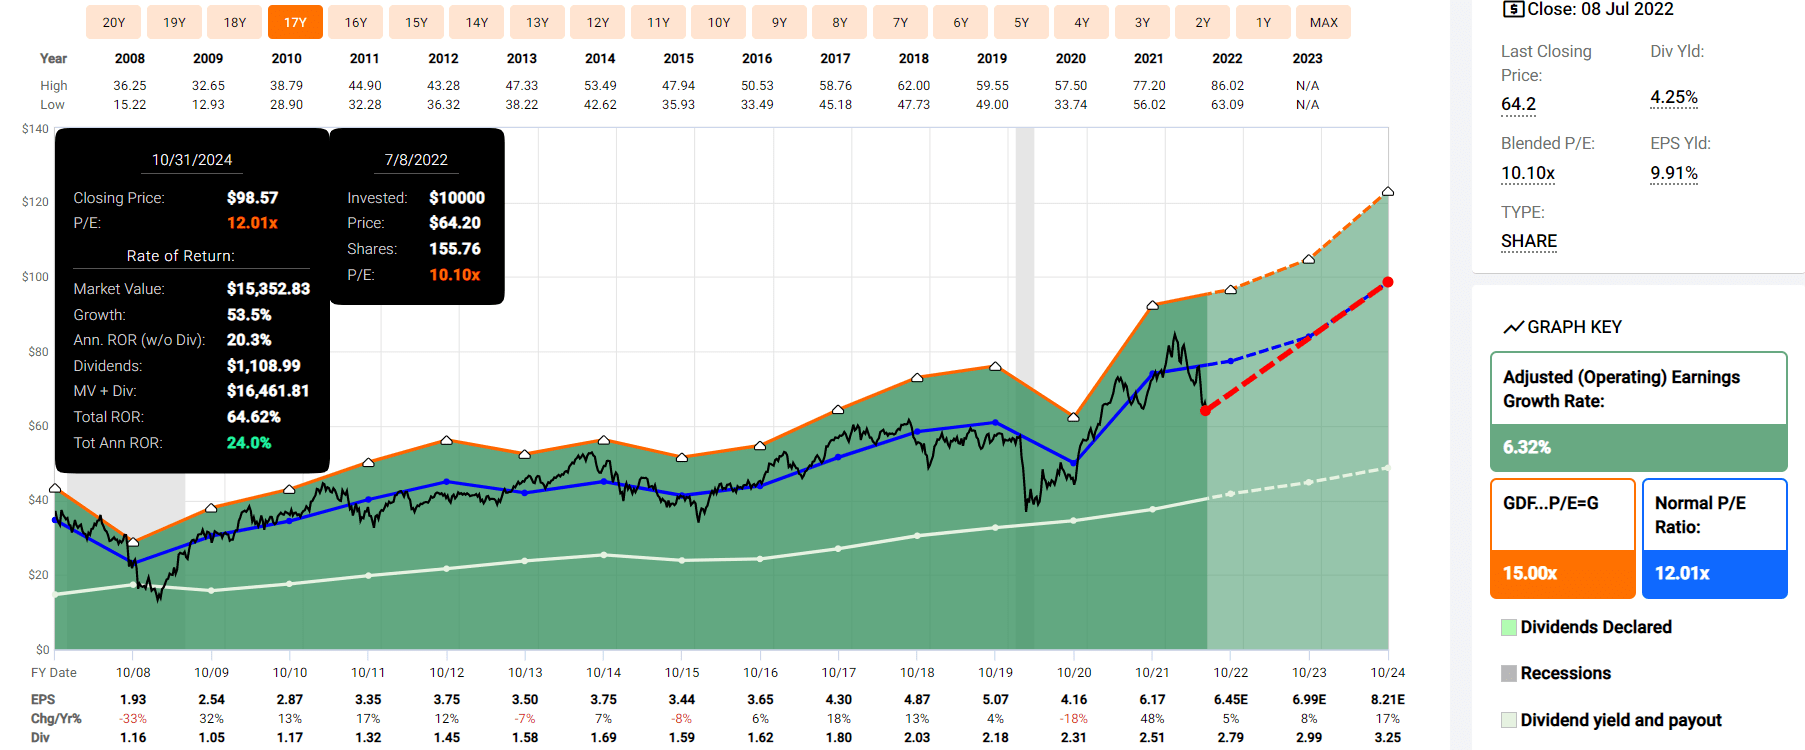
Texas Instruments 2024 Consensus Total Return Potential
(Sources: FAST Graphs, FactSet)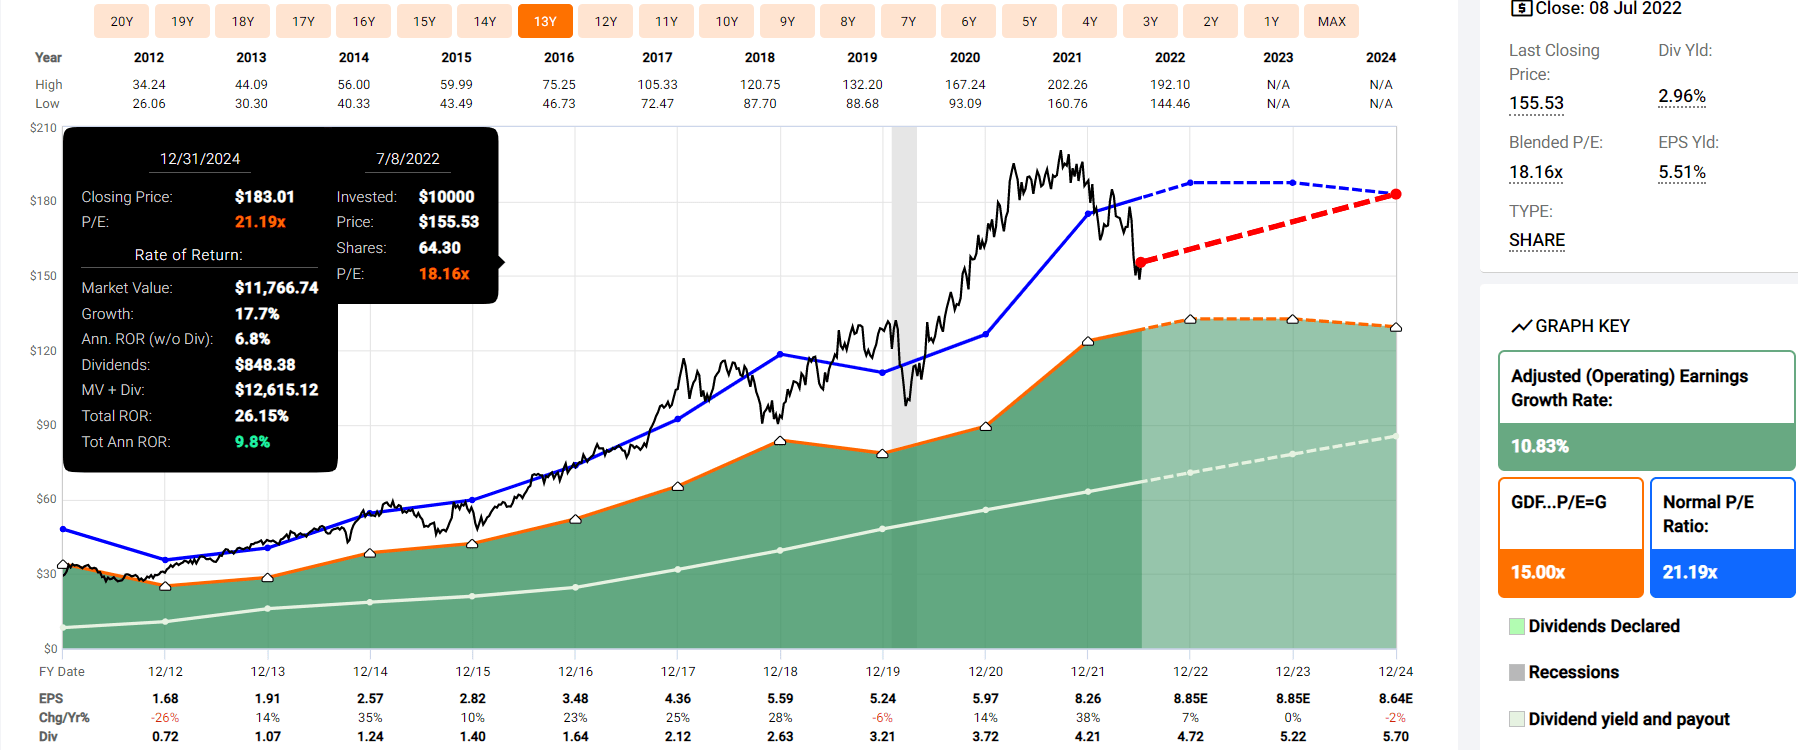
Merck 2024 Consensus Total Return Potential
(Sources: FAST Graphs, FactSet)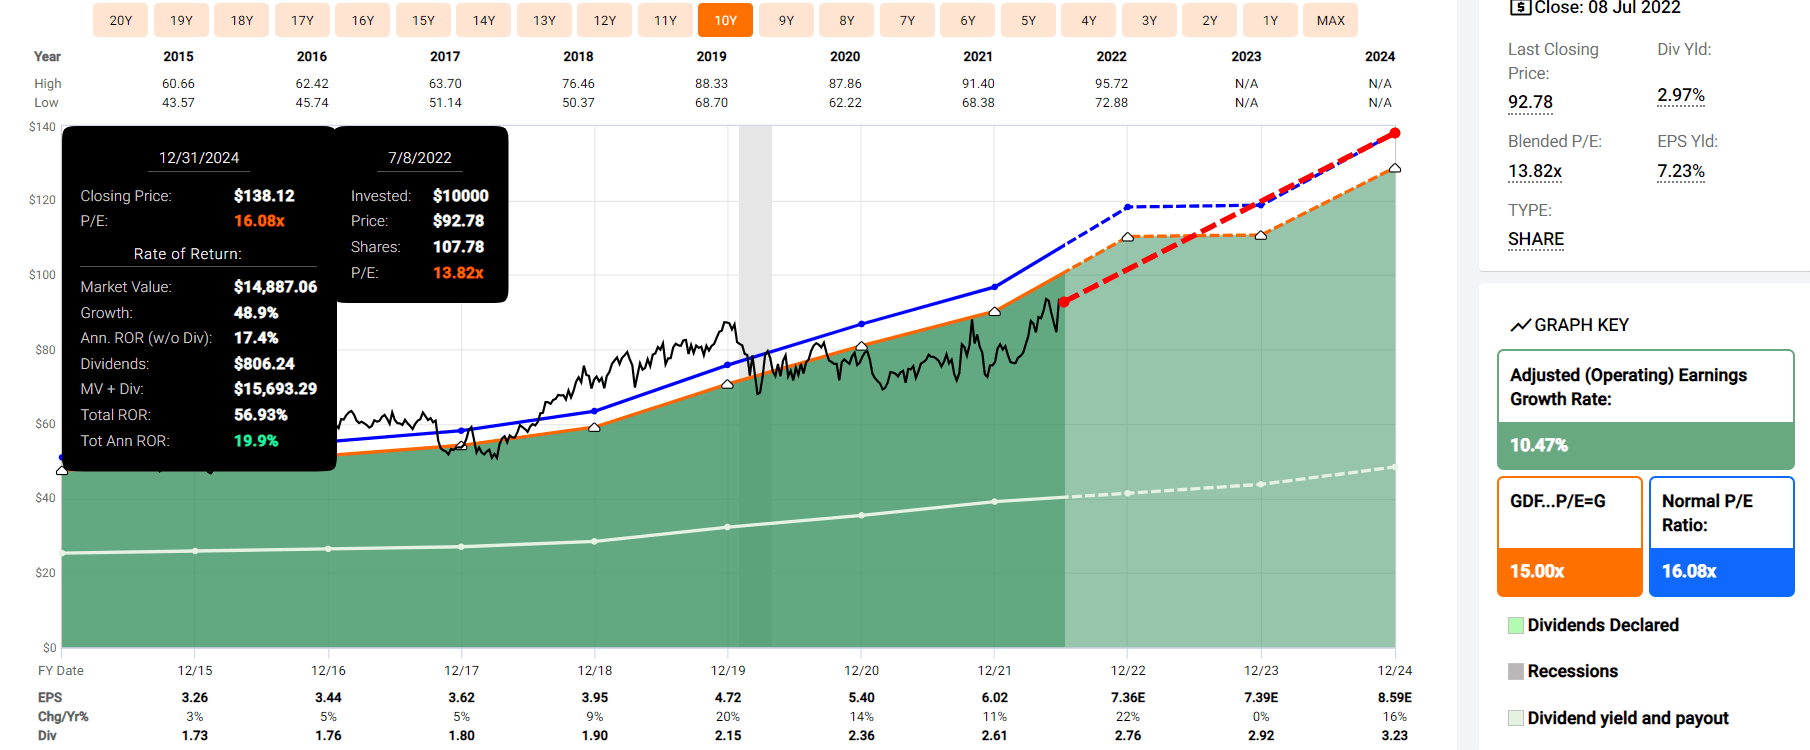
Given the average consensus for all these Ultra SWANs, an equally weighted portfolio is:
- +23% annually through the end of 2024
- that’s how much you’d earn IF each company grew as expected and returned to historical fair value
- the risk-adjusted expected return is 15.8% CAGR (factoring in the probability of these companies not growing as expected and not returning to fair value until after 2024).
S&P 2024 Consensus Total Return Potential
(Sources: FAST Graphs, FactSet)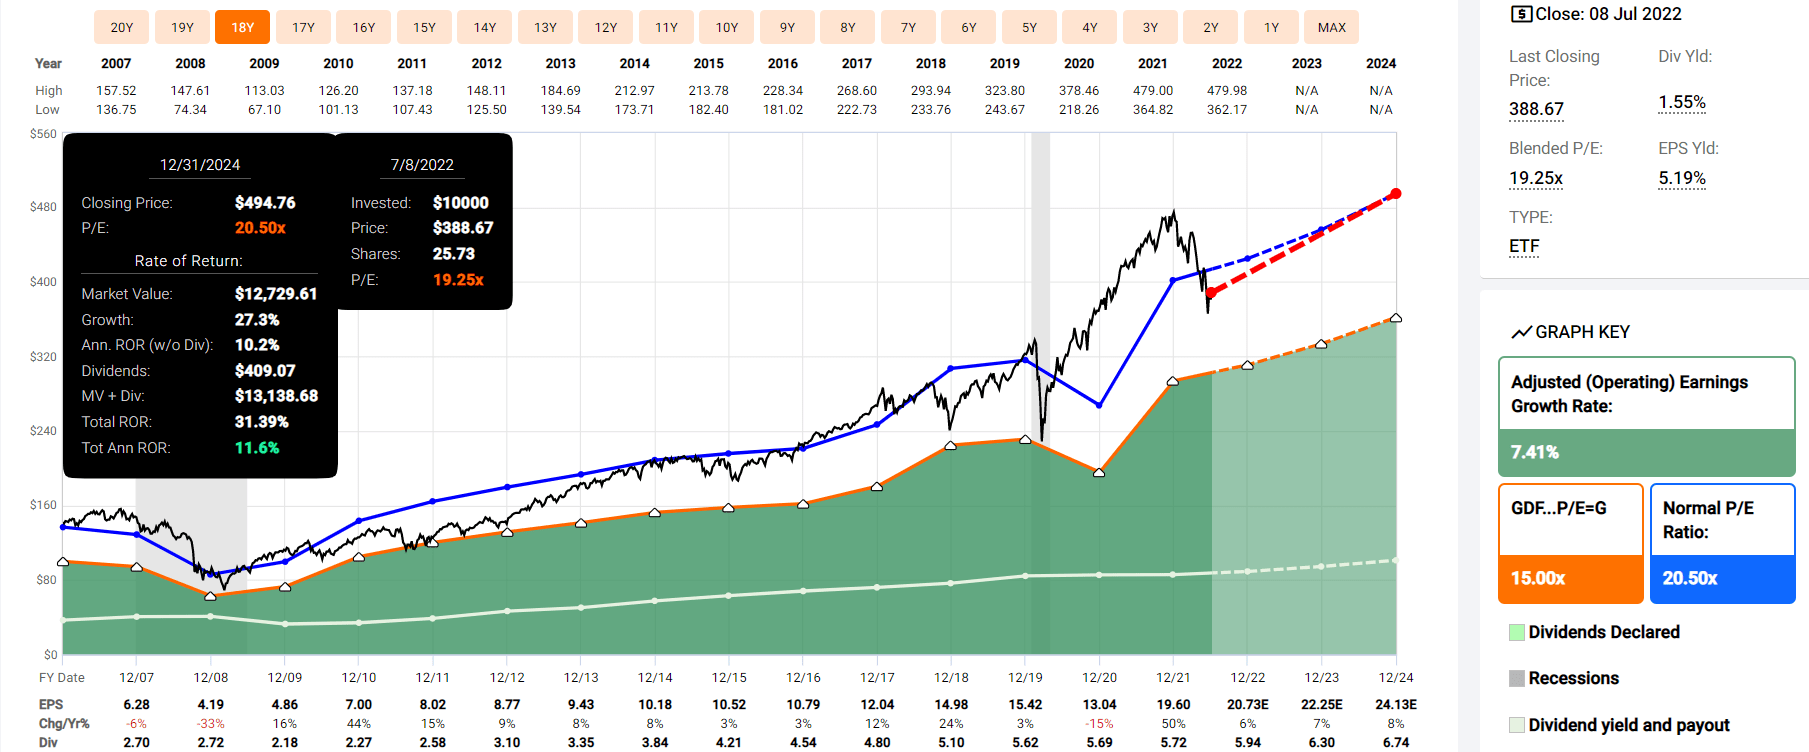
The FactSet consensus for the S&P 500 is 12% annual returns, about half what analysts expect from these high-yield Ultra SWANs.
Why I Trust These Ultra SWANs And So Can You
Dividend Kings Zen Research Terminal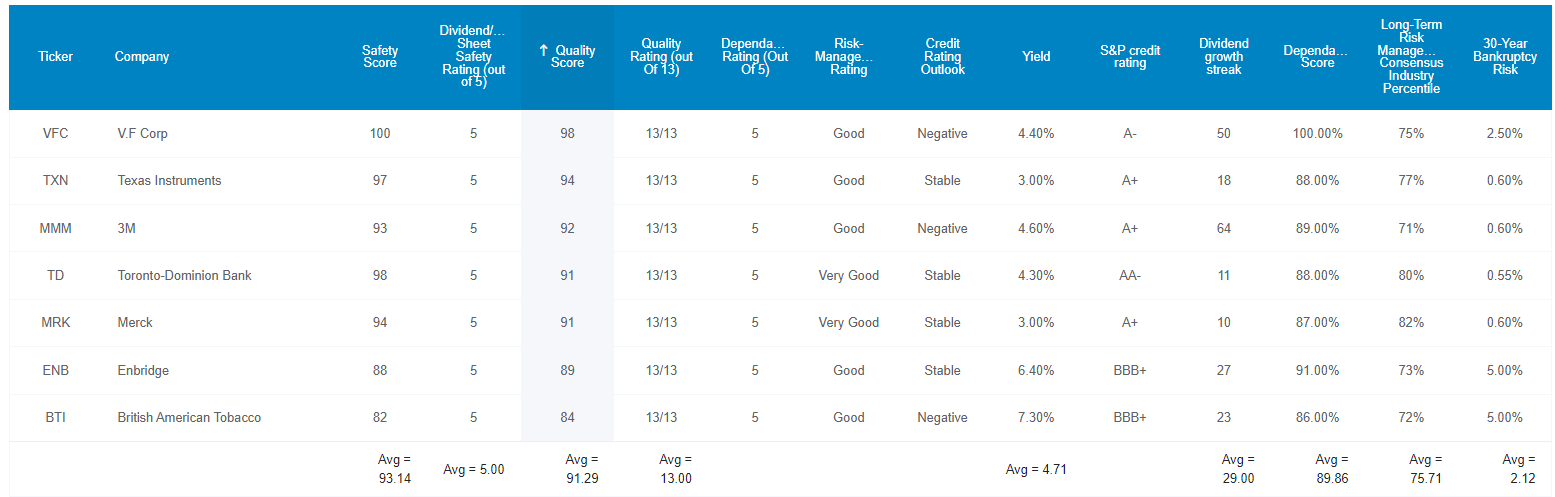
These aren’t just sleep well at night blue-chips, they are Ultra SWAN quality companies that retirees can trust in any recession. How do we know? Because their quality is superior to the bluest of blue-chips, the dividend aristocrats.
Far Superior In Quality To The Dividend Aristocrats
| Metric | Dividend Aristocrats | 7 High-Yield Ultra SWANs | Winner Aristocrats |
Winner 7 High-Yield Ultra SWANs |
| Quality | 87% | 91% | 1 | |
| Safety | 89% | 93% | 1 | |
| Dependability | 84% | 90% | 1 | |
| Long-Term Risk Management Industry Percentile | 67% Above-Average | 76% Good | 1 | |
| Average Credit Rating | A- Stable | A- Stable | 1 | 1 |
| Average 30-Year Bankruptcy Risk | 3.01% | 2.12% | ||
| Average Dividend Growth Streak (Years) | 44.3 | 29.0 | 1 | |
| Average Return On Capital | 100% | 105% | 1 | |
| Average ROC Industry Percentile | 83% | 89% | 1 | |
| 13-Year Median ROC | 89% | 87% | 1 | |
| Total | 3 | 7 |
(Source: DK Zen Research Terminal)
If this portfolio was a single company it would be the 60th highest quality company on the DK 500 Masterlist.
How significant is this? The DK 500 Master List is one of the world’s best watchlists, including:
- every dividend aristocrat (S&P companies with 25+ year dividend growth streaks)
- every dividend champion (every company, including foreign, with 25+ year dividend growth streaks)
- every dividend king (every company with 50+ year dividend growth streaks)
- every foreign aristocrat (every company with 20+ year dividend growth streaks)
- every Ultra SWAN (wide moat aristocrats, as close to perfect quality companies as exist)
- 40 of the world’s best growth stocks.
In other words, even among the world’s best companies, these Ultra SWANs higher quality than 88% of them.
These Ultra SWANs offer one of the safest 4.7% yields on earth. How safe?
| Rating | Dividend Kings Safety Score (162 Point Safety Model) | Approximate Dividend Cut Risk (Average Recession) | Approximate Dividend Cut Risk In Pandemic Level Recession |
| 1 – unsafe | 0% to 20% | over 4% | 16+% |
| 2- below average | 21% to 40% | over 2% | 8% to 16% |
| 3 – average | 41% to 60% | 2% | 4% to 8% |
| 4 – safe | 61% to 80% | 1% | 2% to 4% |
| 5- very safe | 81% to 100% | 0.5% | 1% to 2% |
| 7 High-Yield Ultra SWANs | 93% | 0.50% | 1.40% |
| Risk Rating | Low-Risk (76th industry percentile risk-management consensus) | A- stable outlook credit rating 2.1% 30-year bankruptcy risk | 20% OR LESS Max Risk Cap Recommendation (Each) |
In the average recession since WWII, the risk of a dividend cut is about 1 in 200. In a severe recession, like the Pandemic, or Great Recession, it’s about 1 in 71.
Ben Graham considered a 20+ year dividend growth streak an important sign of excellent quality. These Ultra SWANs average a 29-year streak, making this an effective dividend aristocrat portfolio.
Joel Greenblatt, one of the greatest investors in history, considers return on capital to be his gold standard proxy for quality and moatiness.
- the basis for his 40% annual returns for 21 years at Gotham Capital
- annual-pre-tax profit/the money it takes to run the business.
The S&P 500’s 2021 ROC was 14.6% and the dividend aristocrats 100%.
These Ultra SWANs average 105%, indicating supreme quality and wide moats.
Their ROC is in the 89th percentile of their respective industries, further confirming their wide moats.
And their 13-year median ROC of 87% confirms stable or even improving wide moats.
S&P estimates the average risk of bankruptcy over the next 30 years (Warren Buffett’s definition of fundamental risk) at 2.12%, almost 50% lower than the dividend aristocrats.
And six rating agencies estimate these Ultra Swan’s long-term risk-management is in their 76th industry percentile. What does that mean?
| Classification | Average Consensus LT Risk-Management Industry Percentile |
Risk-Management Rating |
| S&P Global (SPGI) #1 Risk Management In The Master List | 94 | Exceptional |
| Strong ESG Stocks | 78 |
Good – Bordering On Very Good |
| 7 High-Yield Ultra SWANs | 76 |
Good |
| Foreign Dividend Stocks | 75 | Good |
| Ultra SWANs | 71 | Good |
| Low Volatility Stocks | 68 | Above-Average |
| Dividend Aristocrats | 67 | Above-Average |
| Dividend Kings | 63 | Above-Average |
| Master List average | 62 | Above-Average |
| Hyper-Growth stocks | 61 | Above-Average |
| Monthly Dividend Stocks | 60 | Above-Average |
| Dividend Champions | 57 | Average |
(Source: DK Research Terminal)
Superior risk management to the dividend aristocrats and even higher than the average Ultra SWAN.
OK, so now that you understand the supreme quality of these companies, let’s see why you might want to buy them today.
Wonderful Companies At Wonderful Prices
Dividend Kings Zen Research Terminal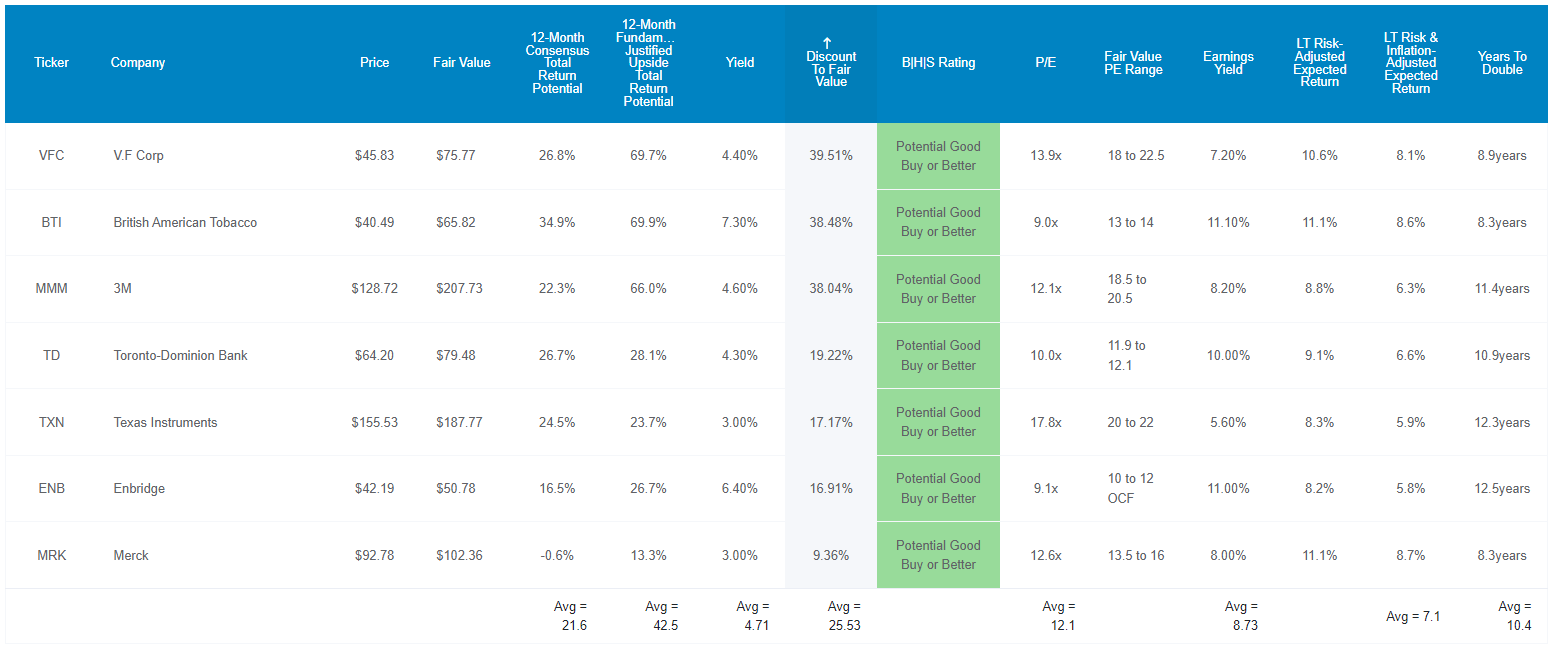
For context, the S&P 500 trades at 16.3X forward earnings, a 3% discount to its 10-year, 25-year, and 45-year average market-determined fair value of 16.9X.
These Ultra SWANs, whose quality is superior to the aristocrats, much less the S&P 500, trade at just 12.1X earnings and a 26% historical discount.
Analysts expect them to deliver 22% total returns in just the next year alone (vs 23% CAGR consensus through 2024) but their fundamentals are so attractive that a 43% total return within 12 months would be justified.
- if these companies all grew as expected and returned to fair value within 12 months, investors would make 43% total returns.
But my goal isn’t to help you earn JUST 22% returns over 12 months or even 43%. My goal is to help you earn hundreds or even thousands of percent gains over years and decades.
In other words, to help you retire in safety and splendor with the world’s best blue-chip bargains hiding in plain sight.
Long-Term Return Fundamentals That Can Help You Retire In Safety And Splendor
Dividend Kings Zen Research Terminal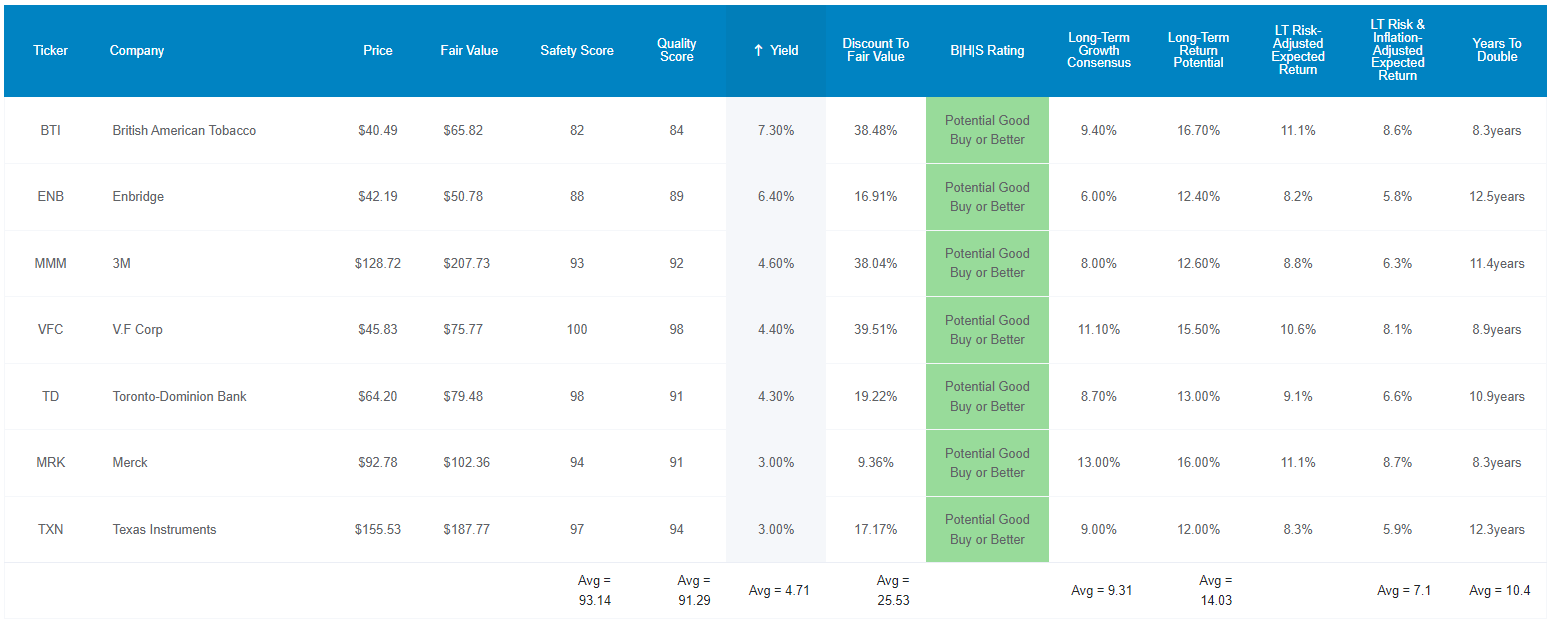
Not only do these Ultra SWANs offer one of the world’s safest 4.7% yields, but analysts expect them to grow at 9.3% over time.
- S&P has a 1.7% yield and 8.5% growth consensus
- aristocrats 2.3% yield and 8.9% growth consensus.
That means analysts think these Ultra SWANs can deliver 14% total returns over time.
| Investment Strategy | Yield | LT Consensus Growth | LT Consensus Total Return Potential | Long-Term Risk-Adjusted Expected Return | Long-Term Inflation And Risk-Adjusted Expected Returns | Years To Double Your Inflation & Risk-Adjusted Wealth |
10-Year Inflation And Risk-Adjusted Expected Return |
| 7 High-Yield Ultra SWANs | 4.7% | 9.3% | 14.0% | 14.0% | 11.5% | 6.2 | 2.98 |
| Nasdaq | 1.0% | 12.7% | 13.7% | 9.6% | 7.1% | 10.1 | 1.99 |
| Dividend Aristocrats | 2.4% | 8.5% | 10.9% | 7.6% | 5.2% | 14.0 | 1.65 |
| S&P 500 | 1.7% | 8.5% | 10.2% | 7.1% | 4.7% | 15.4 | 1.58 |
(Sources: Morningstar, FactSet, Ycharts)
Analysts not only expect these Ultra SWANs to run circles around the S&P and aristocrats but potentially to even beat the Nasdaq long-term.
- but with almost 5X the very solid yield.
Adjusting for the risk of these companies not growing as expected and the bond market’s 30-year inflation expectations that’s a 7.1% risk and inflation-adjusted expected return.
- vs 5.2% aristocrats and 4.7% S&P 500
- realistically you can expect these Ultra SWANs to double your inflation-adjusted wealth every 10.4 years
- vs 14.0 years for the dividend aristocrats and 15.4 years for the S&P 500.
What could that mean for you over time? Potentially life-changing income and wealth compounding.
Inflation-Adjusted Consensus Total Return Forecast: $1,000 Initial Investment
| Time Frame (Years) | 7.6% CAGR Inflation-Adjusted S&P Consensus | 8.4% Inflation-Adjusted Aristocrats Consensus | 11.5% CAGR Inflation-Adjusted 7 High-Yield Ultra SWAN Consensus | Difference Between Inflation-Adjusted 7 High-Yield Ultra SWAN Consensus Vs S&P Consensus |
| 5 | $1,445.67 | $1,493.29 | $1,725.67 | $280.00 |
| 10 | $2,089.97 | $2,229.92 | $2,977.95 | $887.98 |
| 15 | $3,021.42 | $3,329.92 | $5,138.96 | $2,117.55 |
| 20 | $4,367.98 | $4,972.54 | $8,868.17 | $4,500.19 |
| 25 | $6,314.67 | $7,425.45 | $15,303.56 | $8,988.89 |
| 30 | $9,128.95 | $11,088.36 | $26,408.95 | $17,279.99 |
(Source: DK Research Terminal, FactSet)
Analysts think these high-yield Ultra SWANs could deliver 26.4X inflation-adjusted returns over the next 30 years.
| Time Frame (Years) | Ratio Aristocrats/S&P Consensus | Ratio Inflation-Adjusted 7 High-Yield Ultra SWAN Consensus vs S&P consensus |
| 5 | 1.03 | 1.19 |
| 10 | 1.07 | 1.42 |
| 15 | 1.10 | 1.70 |
| 20 | 1.14 | 2.03 |
| 25 | 1.18 | 2.42 |
| 30 | 1.21 | 2.89 |
(Source: DK Research Terminal, FactSet)
That’s potentially 3X more than the S&P 500 and 2.5X more than the dividend aristocrats.
- the average retired couple age 65 has $510K in savings
- these Ultra SWANs could potentially deliver $8.8 million in extra inflation-adjusted wealth over a 30-year retirement.
What evidence is there that these high-yield Ultra SWANs can actually deliver something like 14% long-term returns?
Historical Returns Since September 1996 (Equal Weight, Annual Rebalancing)
“The future doesn’t repeat, but it often rhymes.” – Mark Twain
Past performance is no guarantee of future results, but studies show that blue-chips with relatively stable fundamentals over time offer predictable returns based on yield, growth, and valuation mean reversion.
Bank of America
So let’s see how these Ultra SWANs did over the last 26 years, a period of time when 93% of total returns were the result of fundamentals, not luck.
(Source: Portfolio Visualizer Premium)
Analysts expect 14% long-term returns in the future and over the last 26 years, these Ultra SWANs delivered 14.2% annual returns, along with 71% better negative volatility-adjusted returns compared to the S&P 500.
- Sortino ratio is excess total return (vs 10-year treasuries) divided by negative volatility
(Source: Portfolio Visualizer Premium)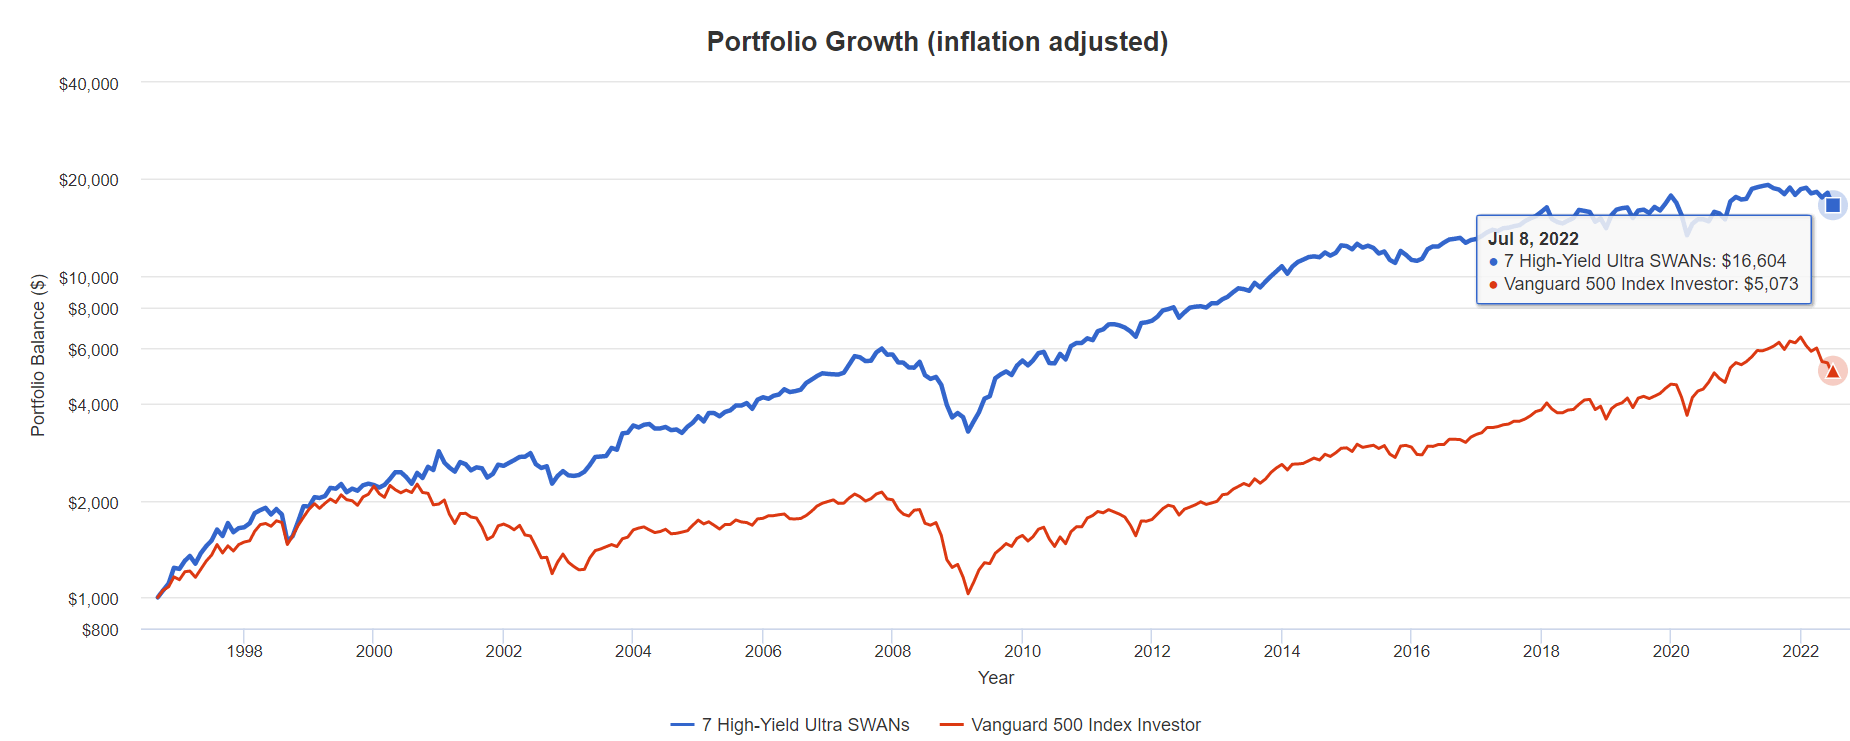
Analysts expect these Ultra SWANs to deliver about 15.3X inflation-adjusted returns over the next 25 years and beat the market by 3X.
In the last 26 years, they’ve delivered 16.6X inflation-adjusted returns and beaten the market by 3X.
(Source: Portfolio Visualizer Premium)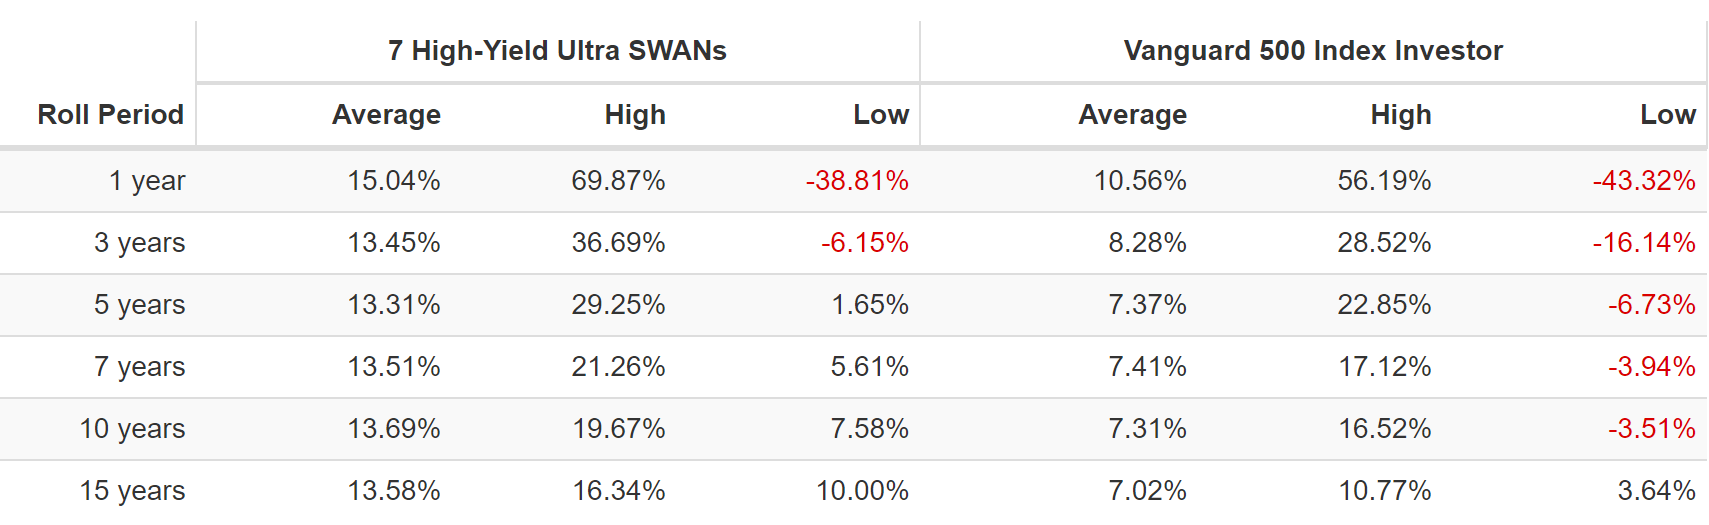
These Ultra SWANs delivered average rolling returns between 13.3% and 15% annually for 26 years, depending on the time frame.
Their worst 15-year return was 10% annually, 3X more than the S&P 500’s worst 15-year return.
- worst 15-year return: 371% vs 70% S&P 500
(Source: Portfolio Visualizer Premium)
While they don’t always outperform the market during periods of market stress, during the worst mega crashes, such as the tech crash and Great Recession, they outperformed by significant amounts.
(Source: Portfolio Visualizer Premium)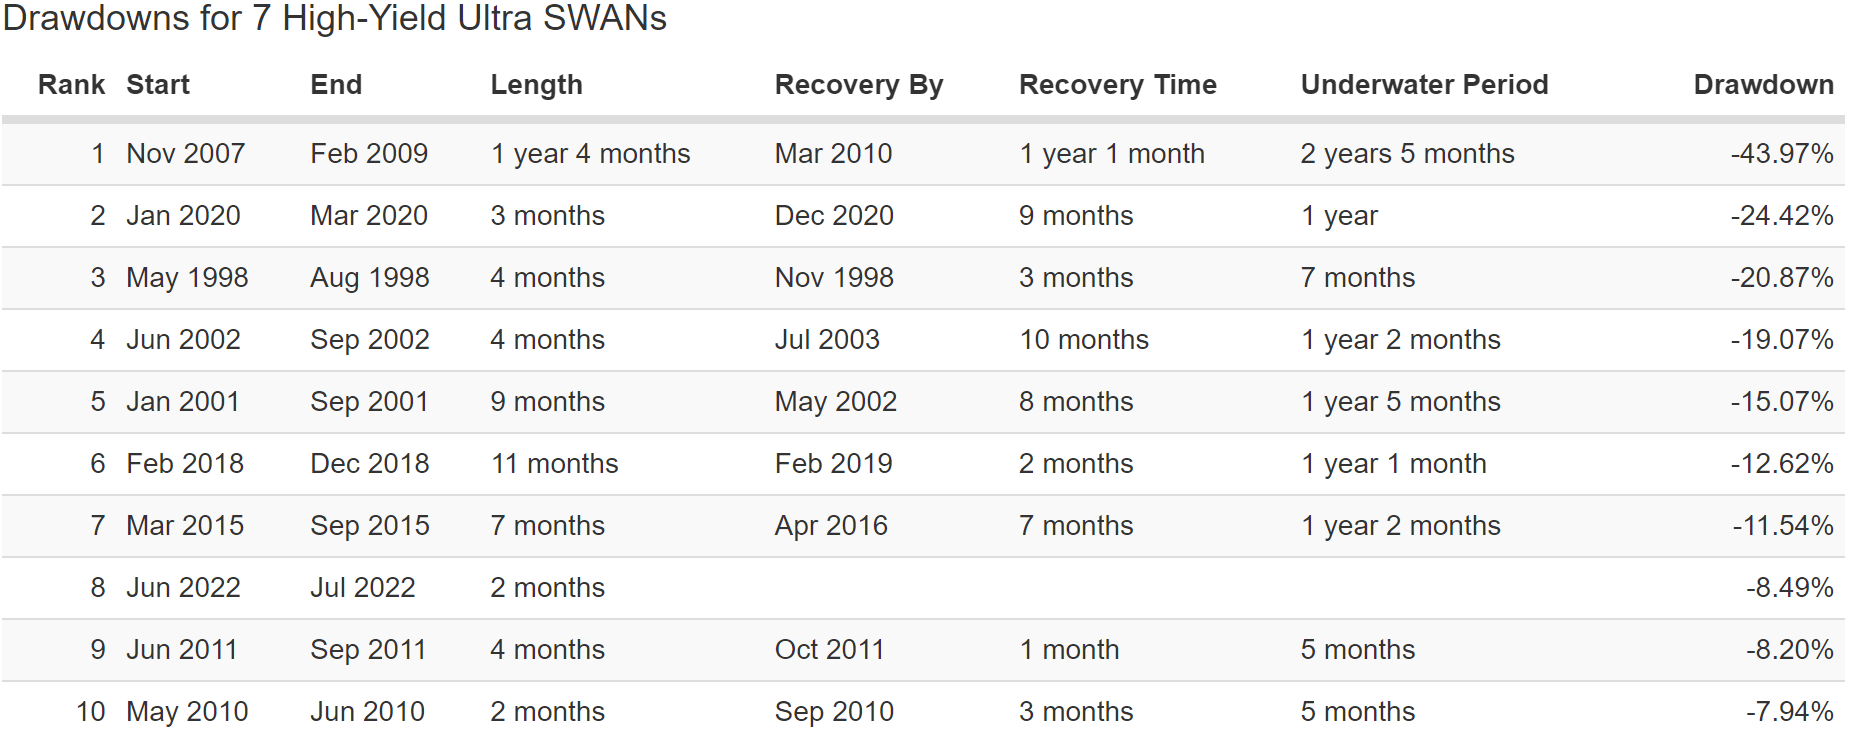
(Source: Portfolio Visualizer Premium)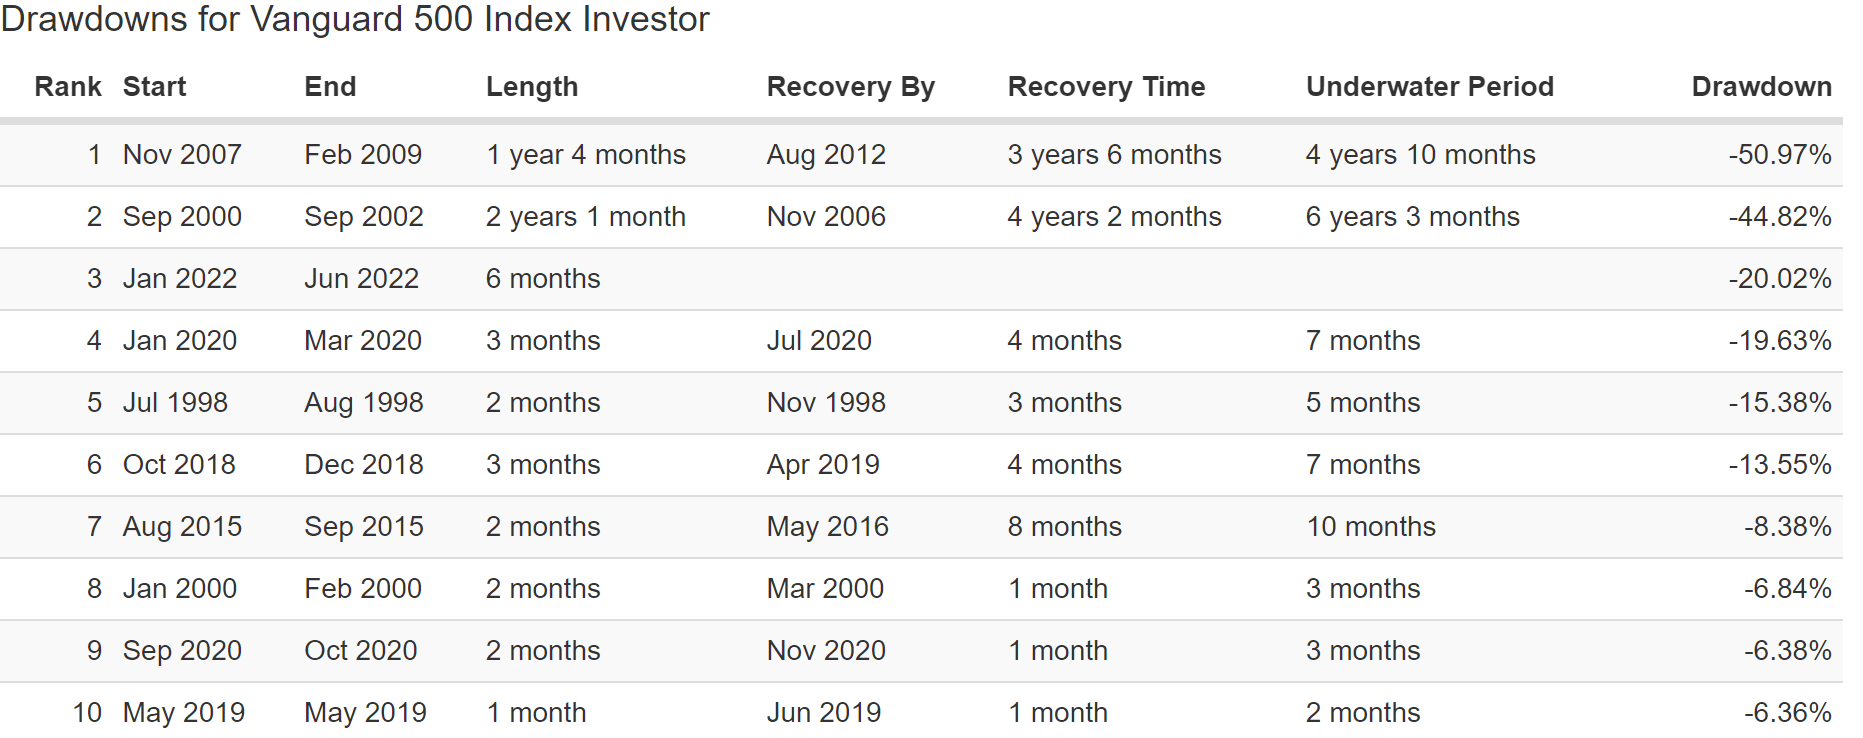
In this bear market, they are down 8.5%, less than half the markets.
The S&P has taken as long as 6.25 years to return to record highs from the tech crash. These Ultra Swans’ longest recovery time was just 2.5 years.
And let’s not forget about the main reason to consider buying these high-yield Ultra SWANs, generous, solid, and growing dividends.
(Source: Portfolio Visualizer Premium)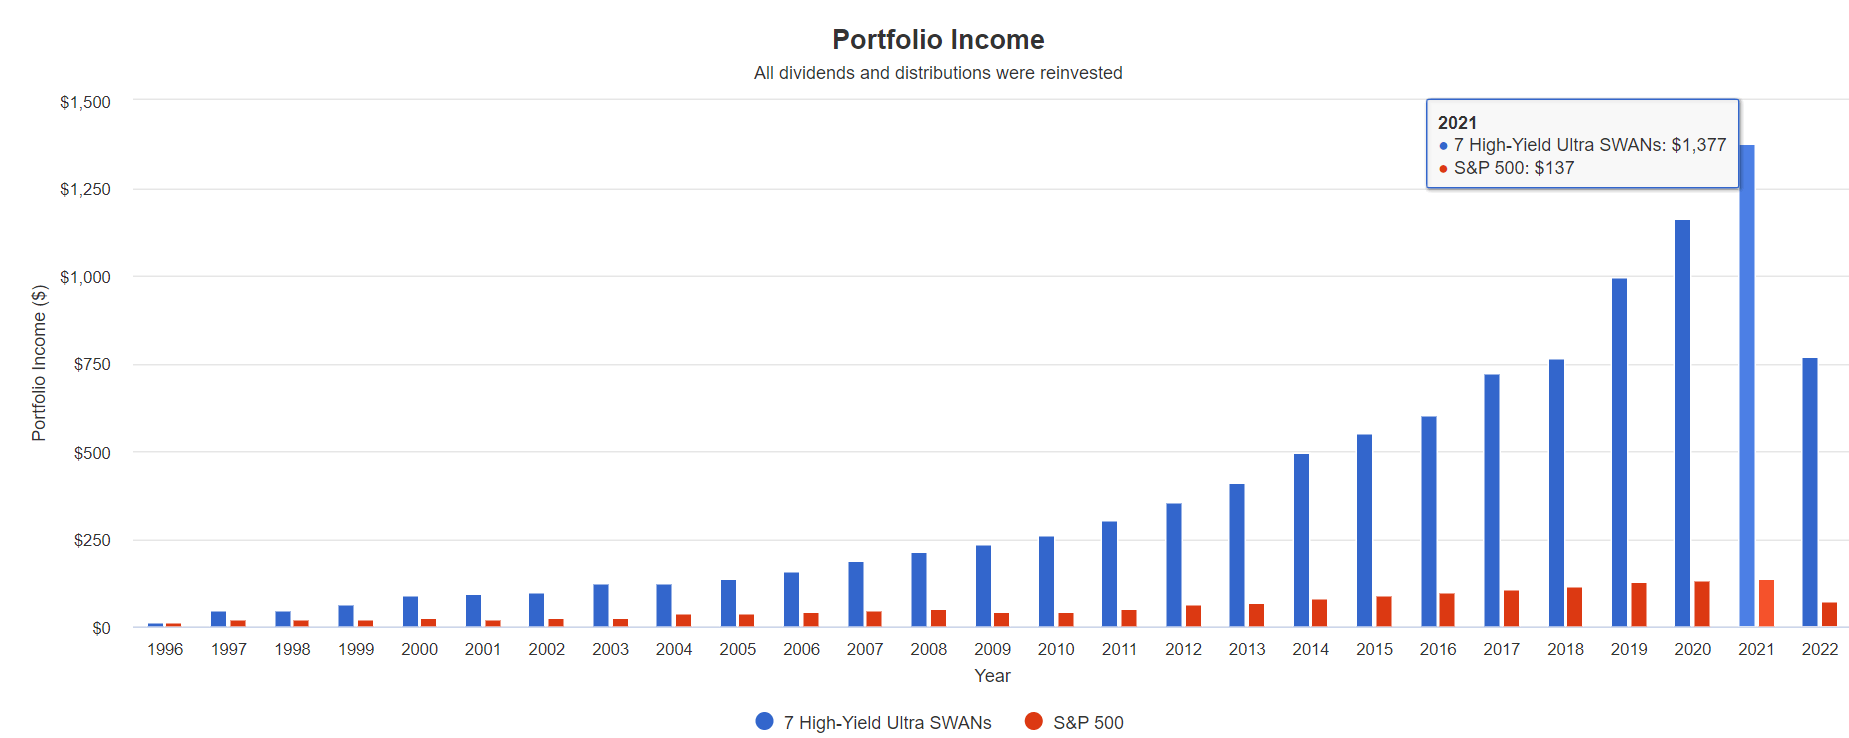
| Portfolio | 1997 Income Per $1,000 Investment | 2022 Income Per $1,000 Investment | Annual Income Growth | Starting Yield |
2022 Yield On Cost |
| S&P 500 | $21 | $142 | 7.95% | 2.1% | 14.2% |
| 7 High-Yield Ultra SWANs | $47 | $1,536 | 14.97% | 4.7% | 153.6% |
(Source: Portfolio Visualizer Premium)
Over the last quarter-century, these Ultra SWANs went from a yield of 4.7% (the same yield as today) to a yield on cost of 154%, delivering 15% annual income growth that was 2X that of the S&P 500.
- almost matching the Nasdaq’s 18% annual income growth
What about future income growth?
| Analyst Consensus Income Growth Forecast | Risk-Adjusted Expected Income Growth | Risk And Tax-Adjusted Expected Income Growth |
Risk, Inflation, And Tax Adjusted Income Growth Consensus |
| 13.9% | 9.8% | 8.3% | 5.7% |
(Source: DK Research Terminal, FactSet)
Analysts expect 14% future income growth from these Ultra SWANs, which adjusting for the risk of these companies not growing as expected, inflation, and taxes is 5.7% real expected income growth.
Now compare that to what they expect from the S&P 500.
| Time Frame | S&P Inflation-Adjusted Dividend Growth | S&P Inflation-Adjusted Earnings Growth |
| 1871-2021 | 1.6% | 2.1% |
| 1945-2021 | 2.4% | 3.5% |
| 1981-2021 (Modern Falling Rate Era) | 2.8% | 3.8% |
| 2008-2021 (Modern Low Rate Era) | 3.5% | 6.2% |
| FactSet Future Consensus | 2.0% | 5.2% |
(Sources: S&P, FactSet, Multipl.com)
Analysts expect the S&P 50 to deliver 2% real dividend growth over time.
- 1.7% post-tax real income growth.
What about a 60/40 retirement portfolio?
- 0.5% consensus inflation, risk, and tax-adjusted income growth.
In other words, these seven high-yield Ultra SWANs offer:
- almost 3X the market’s yield (and a much safer yield at that)
- almost 3.5X its long-term inflation-adjusted consensus income growth potential
- 10.4X better long-term inflation-adjusted income growth than a 60/40 retirement portfolio.
This is the power of high-yield Ultra SWAN investing in a bear market.
Bottom Line: 7 High-Yield Blue-Chips Retirees Can Trust In This Recession
I can’t tell you where the market will bottom, or when, only what the blue-chip consensus expects.
| Time Frame | Historically Average Bear Market Bottom |
| Non-Recessionary Bear Markets Since 1965 | -21% (Achieved May 20th) |
| Median Recessionary Bear Market Since WWII | -24% (Citigroup base case with a mild recession) June 16th |
| Non-Recessionary Bear Markets Since 1928 | -26% (Goldman Sachs base case with a mild recession) |
| Average Bear Markets Since WWII | -30% (Morgan Stanley base case) |
| Recessionary Bear Markets Since 1965 | -36% (Bank of America recessionary base case) |
| All 140 Bear Markets Since 1792 | -37% |
| Average Recessionary Bear Market Since 1928 |
-40% (Deutsche Bank, Bridgewater, SocGen Severe Recessionary base case, Morgan Stanley Recessionary Base Case) |
|
(Sources: Ben Carlson, Bank of America, Oxford Economics, Goldman Sachs) |
Is the market done falling? That will depend on the economy, which in turn will depend on all of us, and the Fed, which in turn will depend on inflation.
But guess what? Retiring in safety and splendor, on a river of solid and growing dividends doesn’t require knowing when inflation will peak, the Fed will pivot, the economy will bottom, or stocks will stop falling.
Nobody can predict interest rates, the future direction of the economy, or the stock market. Dismiss all such forecasts and concentrate on what’s actually happening to the companies in which you’ve invested.” – Peter Lynch
Here’s what I can tell you with high confidence about VFC, BTI, ENB, TD, MRK, MMM, and TXN:
- a very solid 4.7% yield (almost 3X the S&P 500)’s
- quality that’s in the top 12% of the world’s best blue-chips
- higher quality than the dividend aristocrats
- A- stable average credit rating (2.12% avg 30-year bankruptcy risk according to S&P)
- risk-management consensus: 76th industry percentile
- 29-year average dividend growth streak (an effective aristocrat portfolio)
- 25% historically undervalued (12.2X earnings)
- analyst 12-month price forecast: 25% total return
- 12-month fundamentally justified total return potential: 43%
- consensus total return through 2024: 23% CAGR
- long-term consensus: 9.3%
- long-term consensus total return potential: 14.0% vs 14.2% over the last 26 years
Do you want a very solid yield that’s 3X higher than the markets? Who doesn’t?
Do you want rock-solid dividend growth dependability, as represented by an average 29-year dividend growth streak? I know I sure do.
Do you want fortress balance sheets, as represented by an A- stable credit rating and 50% lower fundamental risk than the dividend aristocrats? Yes, please, I’ll have some of that.
How about historical and consensus future returns that don’t just beat the S&P 500 and dividend aristocrats, but even the Nasdaq? Now we’re cooking with gas.
This is how you do high-yield blue-chip investing during a bear market, not reaching for sucker yields, but the world’s most dependable 4.7% yield.
This is how you can sleep well at night in this or any future recession, knowing your hard-earned savings are in the hands of some of the world’s best wealth and income compounders and risk managers.
This is how you can stop obsessing over what happens with inflation, interest rates, the economy, or the stock market in the short-term.
High-yield Ultra SWANs like these are how you take charge of your financial destiny, make your own luck on Wall Street, and retire in safety and splendor.
Be the first to comment