

Pobytov/iStock via Getty Images
Introduction
The London-based Endeavour Mining plc (TSX:EDV:CA, LSE: EDV, OTCQX:EDVMF) is one of the largest gold producers in West Africa, with six operating assets across Senegal, Cote d’Ivoire, and Burkina Faso and a strong portfolio of advanced development projects and exploration assets in the Birimian Greenstone Belt across West Africa.
EDVMF Map Presentation 3Q22 (EDVMF Presentation)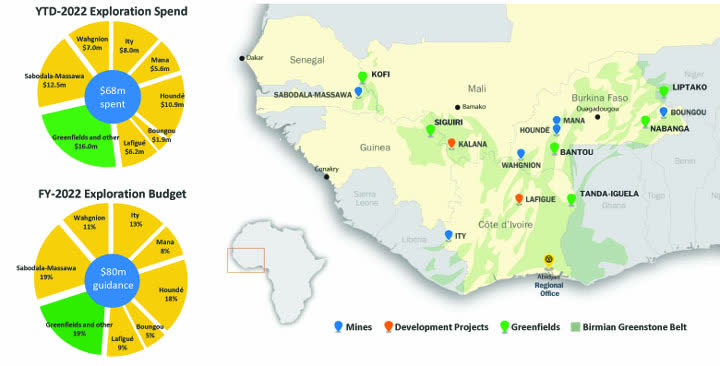
Important note: This article is an update of my article published on August 4, 2022. I have been following EDVMF on Seeking Alpha since 2021.
1 – 3Q22 Results Snapshot
On November 10, 2022, Endeavour Mining announced that gold production for the third quarter of 2022 was 342.743K ounces and sold 338.054K ounces at an AISC of $960/oz.
Revenue for the third quarter came in at $567.6 million, down from $657.4 million last year.
Endeavour Mining indicated that it is well positioned to achieve top-end of FY-2022 production guidance of 1,315-1,400koz at an AISC within the guided $880-930/oz range.
CEO Sebastien De Montessus said in the conference call:
We are pleased to report that we have continued our strong momentum from the first half of the year into Q3, putting us in a solid position to achieve another strong year for the Group, as we are delivering against our key objectives.
2 – Investment Thesis
Endeavour Mining continues to present an excellent financial profile despite mining exclusively in West Africa, which is not considered a safe jurisdiction compared to North America.
The bottom line for investors interested in this solid company is that they will have to deal with a risk premium.
However, on the positive side, Endeavour Mining has well-diversified assets and is not focused on one location. Furthermore, the new projects (brownfield and greenfield) pipeline is impressive.
Finally, Endeavour Mining is paying a semi-annual dividend of $0.40 per share:
During the period ended 30 September 2022, the Company announced its dividend for the first half of the 2022 fiscal year of $0.40 per share totalling $100.0 million.
The company said it is a minimum dividend that could be supplemented with additional dividends and buyback, assuming the gold price remains above $1,500 per ounce, and net leverage debt to adjusted EBITDA remains below 0.5x.
The share buyback program continued with $37 million worth of shares repurchased in 3Q22, totaling $75 million year-to-date.
Also, after 3Q22, the company repurchased an additional 361,567 shares at an average price of $17.27.
One crucial component for Endeavour is primarily the price of gold. Gold has recovered significantly since September and is now back to the same level as last year. The Fed raised interest by 50 points in early December, which pushed the market to turn bullish on gold.
EDVMF Gold and Silver price 1-year basis (Fun Trading StockCharts)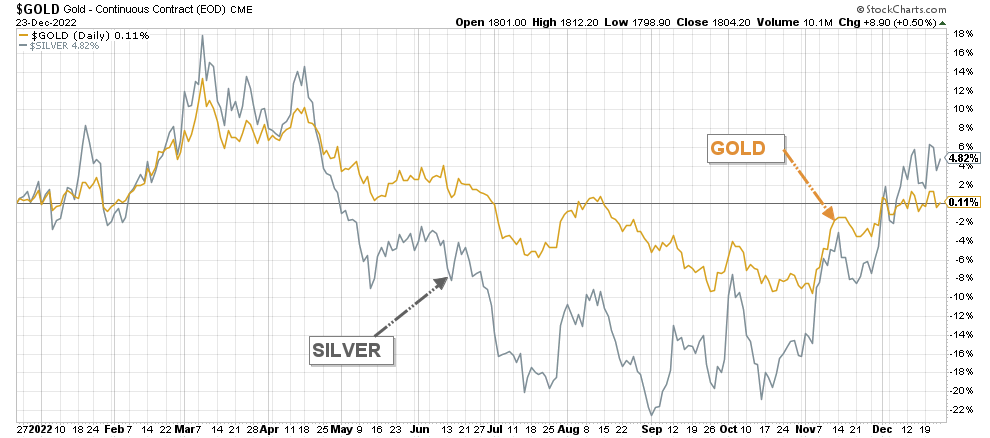
This situation has lifted the gold price average for the fourth quarter at around $1,735 per ounce, which will help the coming results. However, uncertainties about 2023 remain elevated.
Thus, the best way to profit from such a volatile market is to trade short-term LIFO of about 30%-40% of your total position and use your short-term gain to increase your core long-term position for a much higher target when the market decides to turn bullish on gold again.
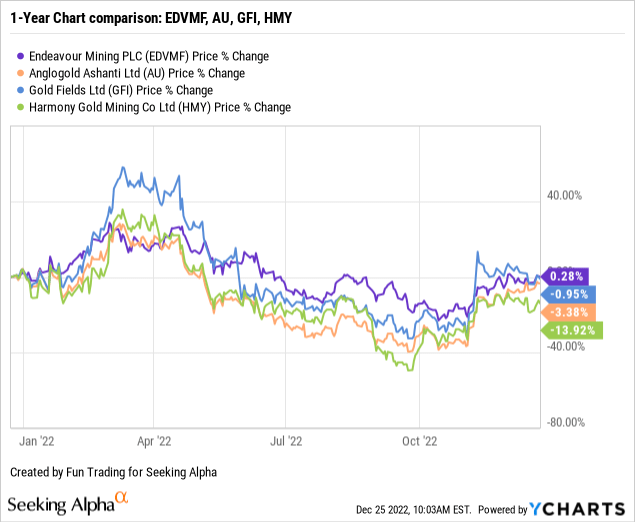
3 – Stock Performance
EDVMF has dropped significantly from its high in March-April and is down 18% on a one-year basis.
Endeavour Mining – 3Q22 Balance Sheet And Trend – The Raw Numbers
| Endeavour Mining | 3Q21 | 4Q21 | 1Q22 | 2Q22 | 3Q22 |
| Total Revenues in $ Million | 691.71 | 697.17 | 686.20 | 629.6 | 567.6 |
| Net income attributable to shareholders in $ Million | 113.59 | -106.36 | -42.20 | 189.4 | 57.6 |
| EBITDA $ Million | 341.85 | 85.27 | 215.40 | 414.6 | 299.2 |
| EPS diluted in $/share | 0.45 | -0.48 | -0.17 | 0.76 | 0.23 |
| Operating Cash flow in $ Million | 311.91 | 355.78 | 304.30 | 253.20 | 153.7 |
| Capital Expenditure in $ Million | 132.47 | 132.30 | 85.20 | 140.30 | 121.4 |
| Free Cash Flow in $ Million | 179.44 | 223.49 | 219.10 | 112.90 | 32.3 |
| Total Cash $ Million | 760.37 | 906.20 | 1,054.30 | 1,109.8 | 888.9 |
| Total Long-term Debt in $ Million | 850.43 | 841.90 | 916.80 | 885.10 | 829.9 |
| Shares outstanding (diluted) in Million | 252.13 | 251.82 | 249.64 | 249.06 | 248.31 |
| Production Au Oz | 3Q21 | 4Q21 | 1Q22 | 2Q22 | 3Q22 |
| Total Production Gold | 382.2 | 398.0 | 367.0 | 345.1 | 342.7 |
| AISC (co-product) from continuing operations | 904 | 900 | 848 | 954 | 960 |
| Gold Price realized | 1,763 | 1,787 | 1,911 | 1,832 | 1,679 |
Source: Company release M&A. Fun Trading files.
Analysis: Revenues, Free Cash Flow, Debt, And Gold Production
1 – Quarterly Revenues for the Third Quarter of 2022
EDVMF Quarterly Revenues history (Fun Trading) Revenues were $567.6 million in the third quarter of 2022, down 13.4% from a year ago and 9.8% sequentially. The lower gold price was to blame. The adjusted net earnings were $52 million in 3Q22 compared to $134 million in the preceding quarter. The net income attributable to shareholders was $57.6 million or $0.23 per diluted share in 3Q22 compared to a net income of $117.6 million or $0.47 per diluted share in 3Q21.
2 – Quarterly Free Cash Flow History
EDVMF Quarterly Free cash flow history (Fun Trading)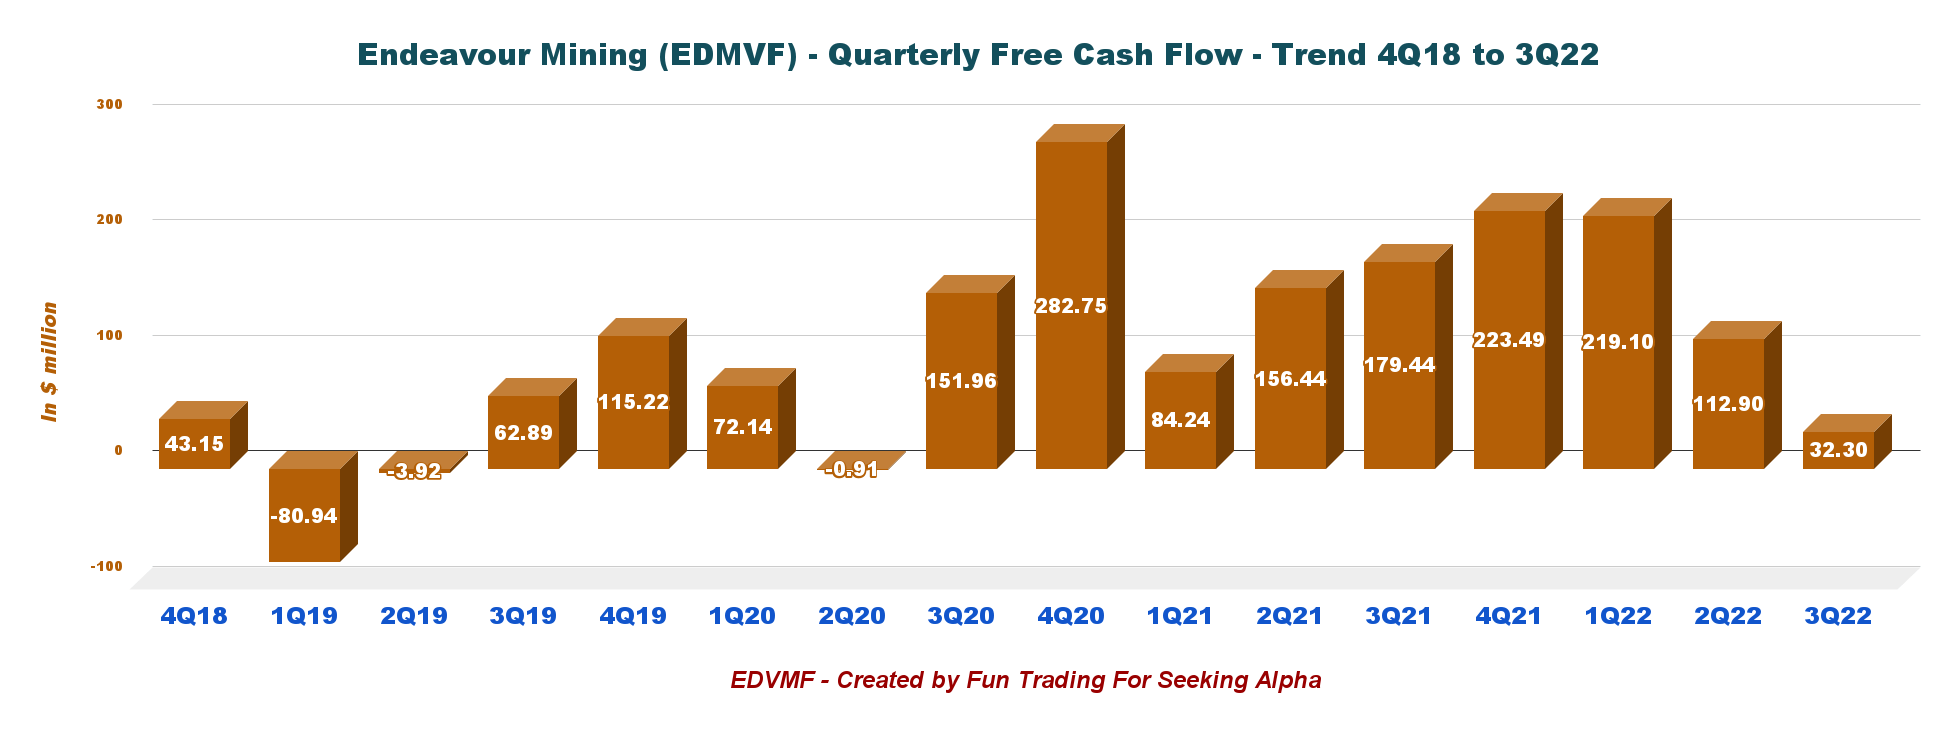
Note: Free cash flow is the Cash from operations minus CapEx.
The company’s free cash flow for the third quarter was $32.3 million, and the trailing 12-month free cash flow was $584.2 million.
3 – Debt Situation in 3Q22; No Net Debt and Total Cash of $888.9 million; Liquidity $1.3 billion
EDVMF Quarterly Cash versus Debt history (Fun Trading) Cash and cash equivalent and investment were $888.9 million, and the debt (including current) was $829.9 million at the end of September 2022. The company continues to be net debt-free with net cash of $59 million. EDVMF Balance sheet as of Sept. 30, 2022 (EDVMF Presentation)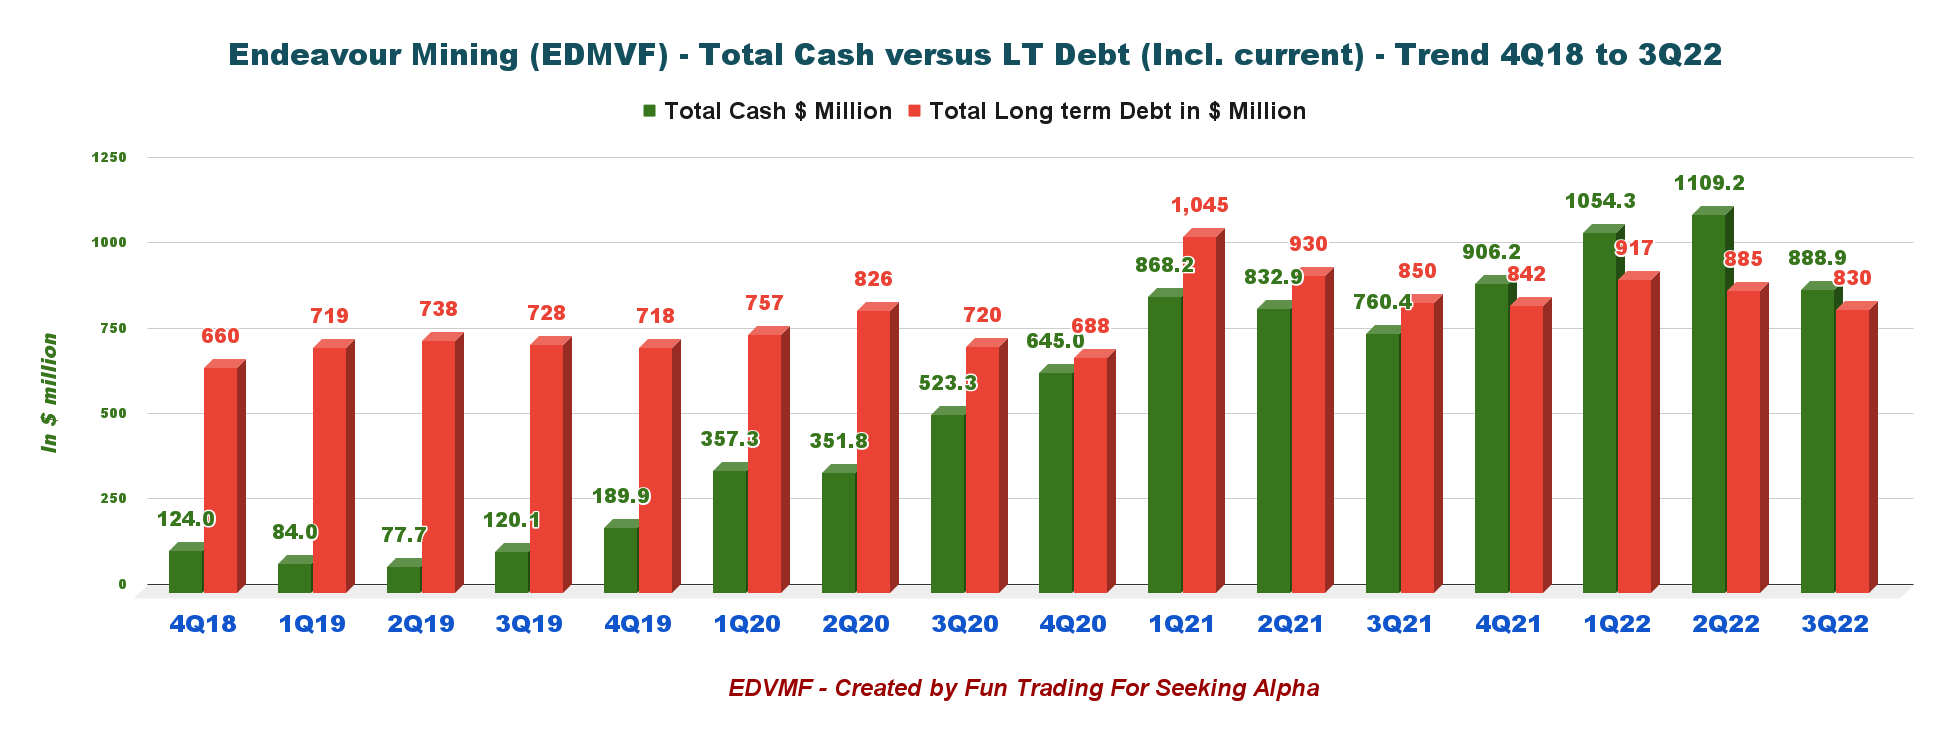

4 – Quarterly Gold Production Analysis
4.1 – Gold Production
EDVMF Quarterly Gold equivalent Production history (Fun Trading)
3Q22 gold production from continuing operations was 342.743k ounces, a slight decrease over 2Q22, mainly due to lower production due to the seasonal impact of the wet season.
4.2 – Gold production per mine. Comparison between 3Q21 and 3Q22
EDVMF Quarterly production per mine (Fun Trading)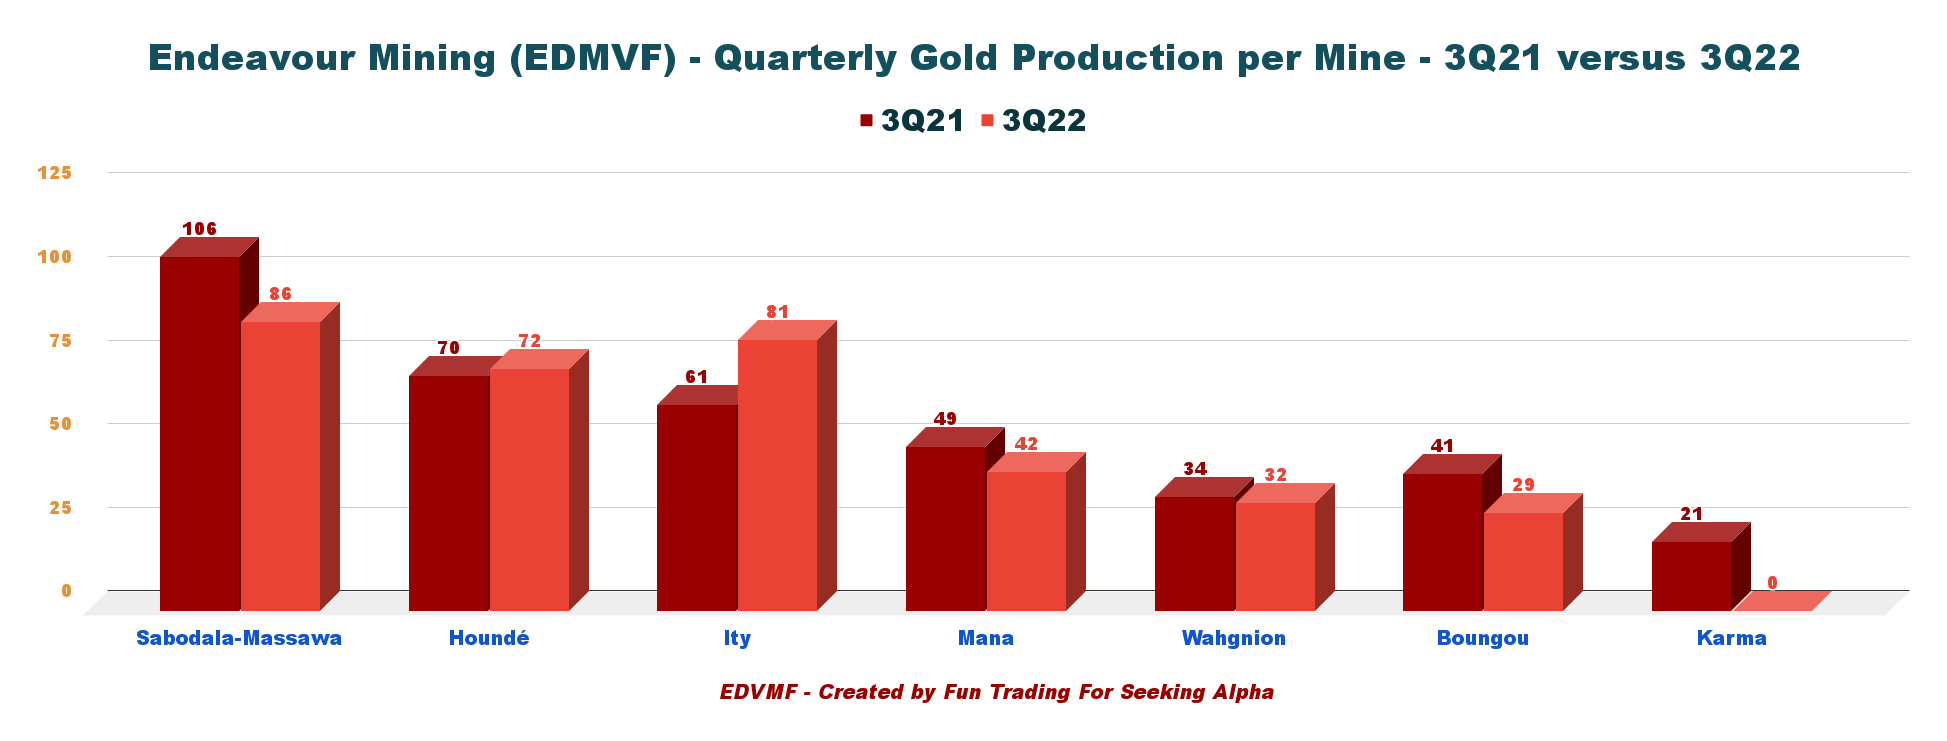
4.3 – Quarterly Gold price realized and AISC
AISC for all operations increased slightly this quarter to $960 per ounce, which is still excellent but higher than 3Q21 due to inflationary pressures.
EDVMF Quarterly AISC and gold price history (Fun Trading)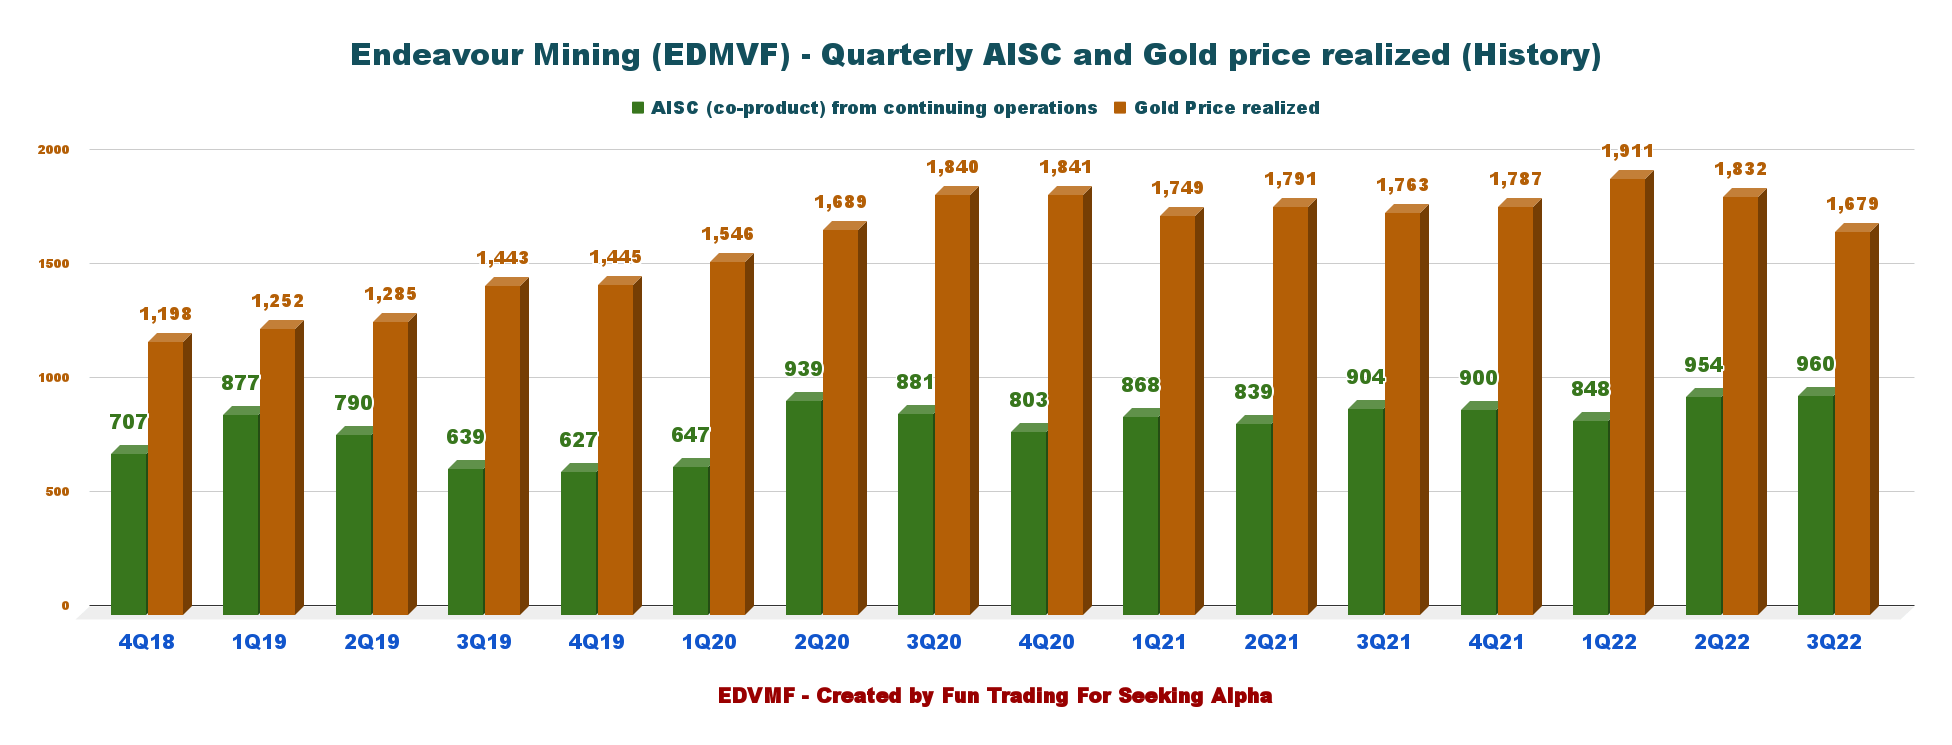
5 – 2022 Guidance unchanged
2022 production is expected to be 1,315K-1,400K oz at an AISC of $880-930/oz.
EDVMF 2022 Guidance (EDVMF Presentation)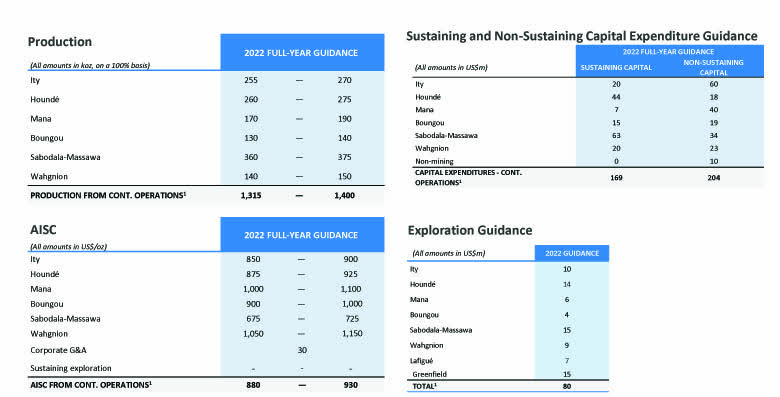
6 – Sabodala-Massawa project expansion and the new 80%-owned Lafigué Project:
Construction commenced in April 2022 and remained on budget and schedule for completion in H1-2024.
EDVMF Sabadola expansion 3Q22 (EDVMF Presentation)
Also, the new project Lafigué in Côte d’Ivoire has started and will be completed in 2024. The 80%-owned Lafigué project construction decision was announced the 17 October 2022.
Sebastien de Montessus, President and CEO, said in the conference call:
…you see how our production has increased in recent years, while our all-in sustaining costs have remained near the $900 per ounce level over the last three years. We’re looking forward to both the Sabodala-Massawa expansion and the Lafigue project coming on stream in 2024, which will continue to add low cost production to the portfolio.
Commentary And Technical Analysis
EDVMF TA Chart short-term (Fun Trading StockCharts)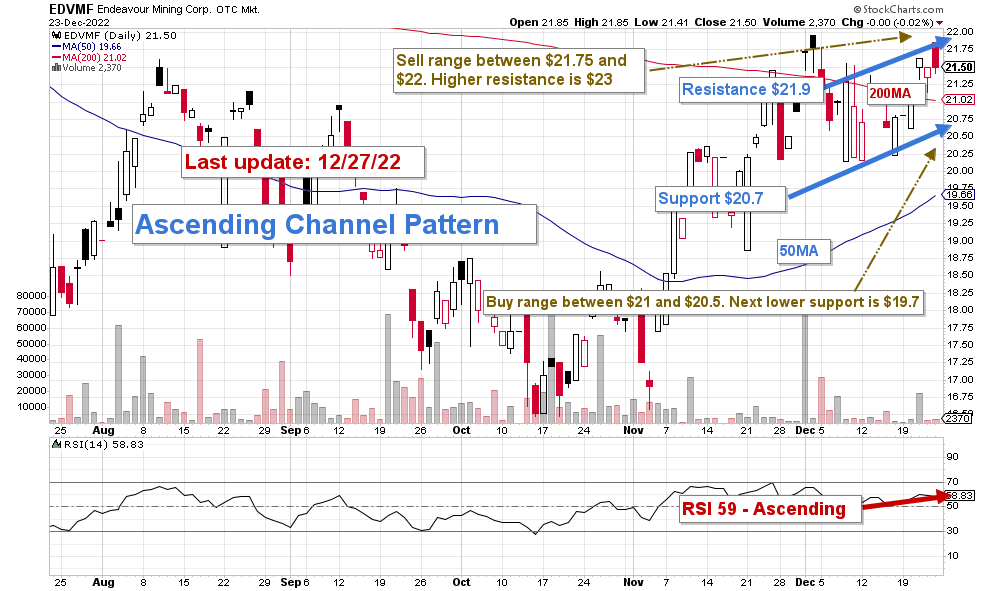
Note: The chart is adjusted for dividends.
Ascending channel patterns or rising channels are short-term bullish in that a stock moves higher within an ascending channel, but these patterns often form within longer-term downtrends as continuation patterns.
The trading strategy I suggest is to gradually sell about 30%-40% of your EDVMF position between $21.75 and $22 with possible higher resistance at $23 and accumulate between $21 and $20.5 with potential lower support at $19.7.
EDVMF is highly correlated to the gold price, and even if I am bullish long-term on gold, I believe we are now at a strong resistance for gold, and we should retrace a little before going up again, probably in H2 2023.
Thus, the best-adapted approach is to sell short-term LIFO while keeping a core long-term position for a much higher final target. It is what I am suggesting in my marketplace, “The Gold and Oil Corner.”
Watch the gold price like a hawk.
Warning: The TA chart must be updated frequently to be relevant. It is what I am doing in my stock tracker. The chart above has a possible validity of about a week. Remember, the TA chart is a tool only to help you adopt the right strategy. It is not a way to foresee the future. No one and nothing can.
Author’s note: If you find value in this article and would like to encourage such continued efforts, please click the “Like” button below to vote for support. Thanks.
Editor’s Note: This article discusses one or more securities that do not trade on a major U.S. exchange. Please be aware of the risks associated with these stocks.
Be the first to comment