

R.M. Nunes
This article examines what I call “Class II” banks. These are the regional banks that have total assets around $500 billion, significantly smaller than the Big 4 money-center U.S. banks. But they are quite a bit larger than the small regional banks, “Class III”, I recently examined that have total assets around $200 billion. The banks that comprise this group are Truist Financial Corporation (NYSE:TFC), U.S. Bancorp (NYSE:USB) and The PNC Financial Services Group, Inc. (NYSE:PNC). Truist is the amalgamation of two large banking legacies, BB&T and SunTrust Banks. U.S. Bancorp’s history goes back to 1863 and has had run-ins with notorious bank robbers Butch Cassidy, Baby Face Nelson and John Dillinger. And PNC began in 1845 in Pittsburgh, where its headquarters remain today.
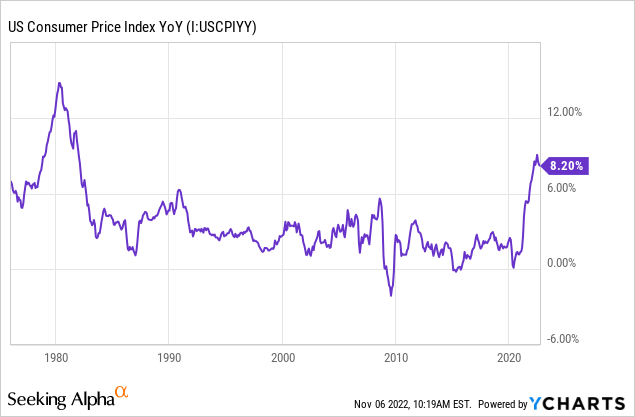
Before we get into the analysis of these three competitors, we should examine the economic backdrop that is affecting the banking industry today. The big story that is impacting the banking sector this year is inflation. In the U.S., inflation, as measured by the Consumer Price Index (CPI), has not only increased to levels not seen since the early 1980s, but has remained stubbornly high, despite the strong actions by the Federal Reserve bank.
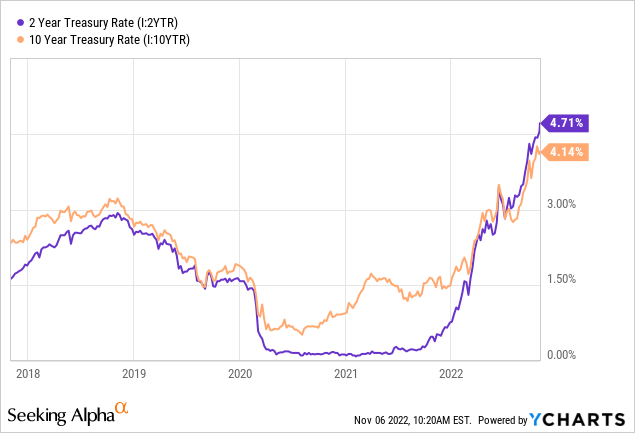
In order to combat rising inflation, the Federal Reserve has raised short-term interest rates very aggressively, and at the same time, the Fed has begun tapering its long-term bond holdings previously acquired as part of “quantitative easing.” As a result, both short and long-term interest rates have increased at a rate not seen for a generation.
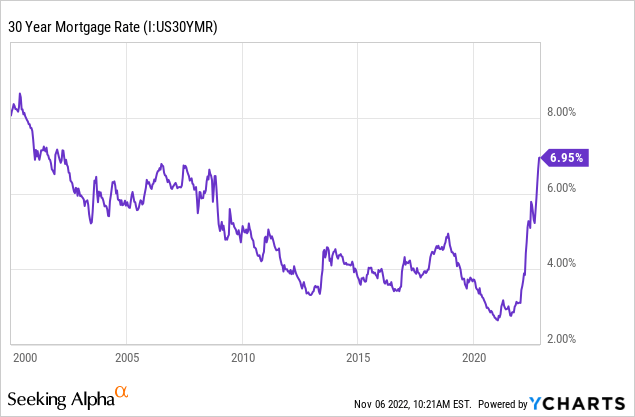
As a result of the Fed’s actions, the average 30-year mortgage rate has reached the highest levels since before the financial crisis began in 2007:
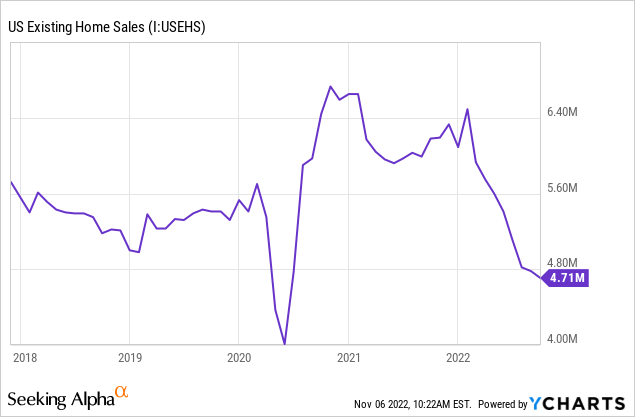
While higher rates have translated into higher net interest income at the banks, the banks have been hit especially hard in mortgage banking, investment banking and asset management. Mortgage banking has been hit with a double-whammy, with rising mortgage rates resulting in declining home sales:
Investment banking revenues have been hit as M&A deal volume has slowed compared to prior years:
Global and US deal volume (RBC Capital Markets)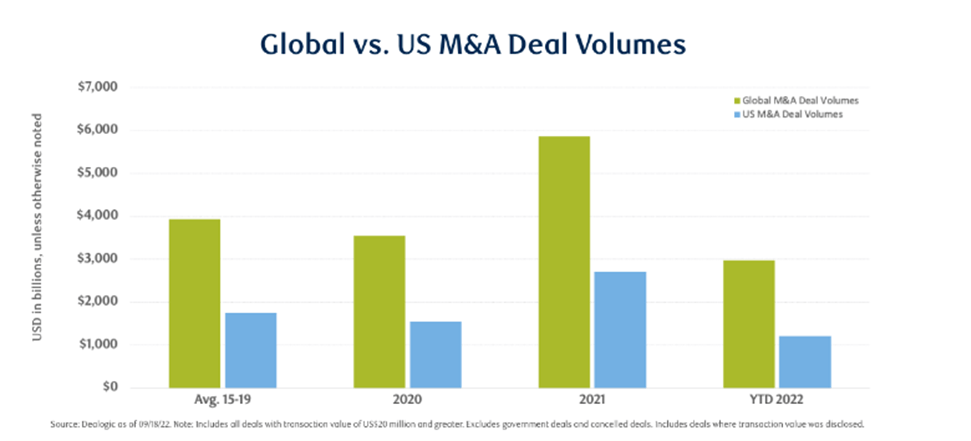
Finally, with both equity and fixed income markets down considerably this year, many asset management businesses that rely on fee income have faced some tough headwinds with decreasing assets under management resulting in lower fees.
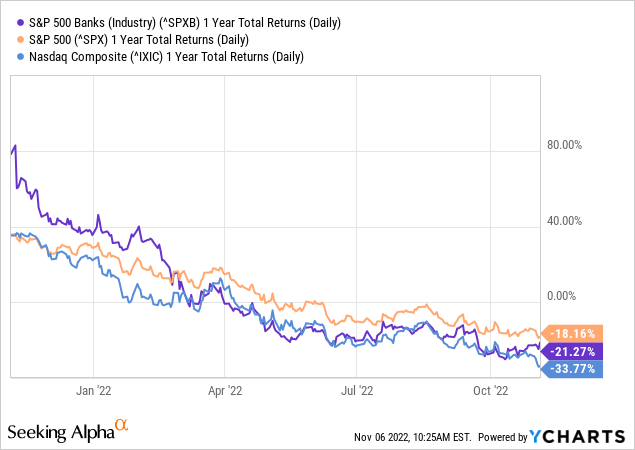
So, with that as the backdrop, one might think that banks are getting absolutely slaughtered. Broadly speaking, yes, bank stocks are getting hit relatively hard. Bank investors can be thankful they are not invested in technology, I suppose.
So keep this macro environment in mind as we look through each of the banks’ current year results to determine which stock or stocks are worth considering at this time. Unless otherwise noted, all financial data is sourced from the quarterly results of TFC, USB and PNC.
Beginning with net interest income, each of the banks reported strong growth in net interest income in the third quarter. All three companies showed strong double-digit growth for the quarter compared to last year, attributable to higher yields on interest-earning assets and solid loan growth. On the YTD basis, PNC reported 20% growth, USB 11% growth and TFC “only” 6% growth. Incidentally, TFC reported the highest net interest margin at 3.1%.
| Q322 vs Q321 | TFC | USB | PNC |
| Interest income | +27.5% | +38.7% | +38.9% |
| Interest expense | +223% | +279% | +452% |
| Net interest income | +15.8% | +20.7% | +21.7% |
| Net interest margin | +31bp | +30bp | +55bp |
| YTD 22 vs YTD 21 | TFC | USB | PNC |
| Interest income | +10.0% | +18.2% | +26.6% |
| Interest expense | +77% | +115% | +167% |
| Net interest income | +5.9% | +10.6% | +19.8% |
Each of the companies reported declines in their noninterest revenues as well. At TFC, Q3 noninterest revenues were down 11%, primarily due to investment banking and trading income and wealth management. USB reported an 8.3% decline in Q3 noninterest revenues, mainly because mortgage banking revenue decreased 81%. And PNC reported an 11% drop as the mortgage line decreased 42% and capital markets declined 38%. As mentioned earlier, with mortgage rates rising and home sales declining, activity in the mortgage business is grinding to a halt. Similarly, declines in merger, acquisition and other investment banking activities have resulted in lower fees for the banks. This is a very challenging environment. So far, I have not yet seen any announcements about layoffs in these types of businesses, so I would say there could be another leg down in the health of these business lines.
| Q322 vs Q321 | TFC | USB | PNC |
| Noninterest revenues | -11.1% | -8.3% | -11.4% |
| YTD 22 vs YTD 21 | |||
| Noninterest revenues | -6.8% | -3.6% | -22.0% |
Finally, there are some interesting changes going on with the provisions for loan losses. Last year, each of the companies reported a “benefit” from loan losses, which is favorable to the bottom line. All three companies reported at year-end 2021 an improving economic environment led to the benefits being reported. By the third quarter of this year, the companies have all reported provisions, citing weaker economic conditions this year. This year, management has made an about face and each company is now reporting a provision for loan losses, detrimental to the bottom line.
| Provision (benefit) $m | Q221 | Q321 | Q421 | Q122 | Q222 | Q322 |
| TFC | (434) | (324) | (103) | (95) | 171 | 234 |
| USB | (170) | (163) | (13) | 112 | 311 | 362 |
| PNC | 302 | (530) | (249) | (208) | 36 | 241 |
The table above indicates that USB flipped to a more conservative position before the other two companies. Investors will have to watch this line as the economic environment so far does not appear to be improving as we close out 2022.
On the expense side, I think it is best to look at the overall efficiency ratio, a ratio of noninterest expenses to total net revenues. Additionally, I prefer not to focus on a single quarter as there are many seasonal items and one-time impacts in any given quarter. Therefore, we will look at the YTD periods to come to any conclusions. TFC posted the highest ratio at 0.646, followed by PNC at 0.631 and USB at .610. Each company has merger-related expenses included in these numbers, but even with those included, the trend this year has been a gradual decline in the efficiency ratio. Personnel costs are the largest noninterest expense, and each of the companies have comparable compensation ratios in the 0.37 – 0.39 range.
| YTD 2022 | TFC | USB | PNC |
| Efficiency ratio | 0.646 | 0.610 | 0.631 |
| Compensation ratio | 0.373 | 0.379 | 0.345 |
Not surprisingly, each company reported a decline in net income in the year to date period. However, on an EPS basis, PNC squeaked out a respectable gain in EPS year-over-year, while TFC and USB were not as fortunate. PNC reported a 27% decline in net income, but a 6% increase in EPS.
| YTD 2022 % change | TFC | USB | PNC |
| Net income | -4.3% | -23.9% | -27.5% |
| Diluted EPS | -3.3% | -22.1% | +5.8% |
| Outstanding shares | -0.8% | +0.1% | -3.8% |
On the balance sheet, loan growth remains strong at each company, while deposit growth was mixed. TFC and PNC both reported that deposits were down because of impacts of monetary tightening, higher consumer spending and inflationary pressures. This is an area to watch as we close out 2022 and consumers battle through what will likely be a much more expensive year-end holiday shopping season.
| Q322 vs Q421 % change | TFC | USB | PNC |
| Loans, net | +8.8% | +9.9% | +9.6% |
| Total deposits | -0.1% | +3.3% | -4.2% |
One other thing to note on the balance sheets is the impact of higher interest rates on investment securities. For those investments that have unrealized losses, those losses flow through shareholders’ equity in accumulated other comprehensive income, which has impacted shareholders’ equity fairly significantly. Now, presumably, when the value of these securities increases, equity will bounce back to prior levels. But for now, equity is taking a hit and valuation metrics pertaining thereto could be skewed as well.
| YTD 2022 % change | TFC | USB | PNC |
| Book value / share | -12.2% | -13.6% | -12.9% |
| Book value / common share | -13.5% | -16.3% | -12.9% |
| Book value / tangible common share | -35.0% | -24.9% | -21.4% |
Given the declines on the income statement and the negative sentiment across the economy, investors may be led to believe that the banks’ asset quality metrics are falling apart. On the contrary, that does not seem to be the case at all. Loan quality is still holding up fairly well, and in many cases it’s improving.
| TFC | Q122 | Q222 | Q322 |
| Net charge-offs, % of avg loans | 0.25 | 0.22 | 0.27 |
| Allowance for credit losses (billions) | $4.423 | $4.434 | $4.455 |
| Nonperforming assets, % of total assets | 0.21 | 0.22 | 0.23 |
| USB | Q122 | Q222 | Q322 |
| Net charge-offs, % of avg loans | 0.21 | 0.20 | 0.19 |
| Allowance for credit losses (billions) | $6.105 | $6.255 | $6.455 |
| Nonperforming assets, % of total assets | 0.25 | 0.23 | 0.20 |
| PNC | Q122 | Q222 | Q322 |
| Net charge-offs, % of avg loans | 0.19 | 0.11 | 0.15 |
| Allowance for credit losses (billions) | $5.197 | $5.143 | $5.263 |
| Nonperforming assets, % of total assets | 0.78 | 0.66 | 0.66 |
Borrowers are holding up well, for now. Interest rates across the economy continue to rise and real estate prices are falling in many locations. But from the banks’ perspective, these developments have yet to translate into significant impacts for the banks. I think the banks will begin to see much more severe impacts if and when job losses begin to pick up. So far, though, that has not yet occurred.
Like many stocks, bank stocks have not been immune to the drubbing that has taken place over the last 12 months. At least they are not down as much as tech stocks!
These three regional banks have also been hit really hard over the past year.
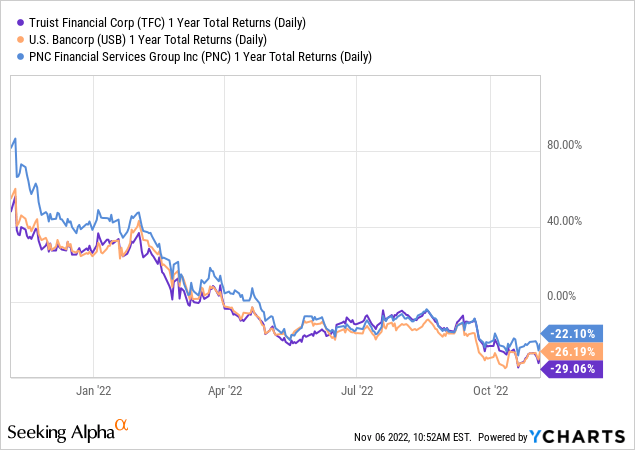
The chart below shows the recent price activity on the three stocks:
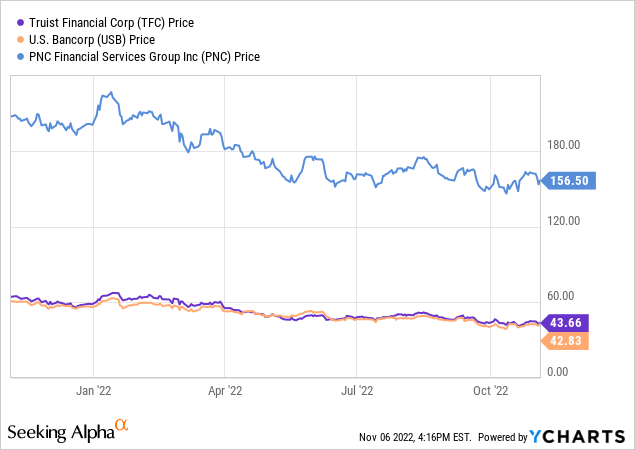
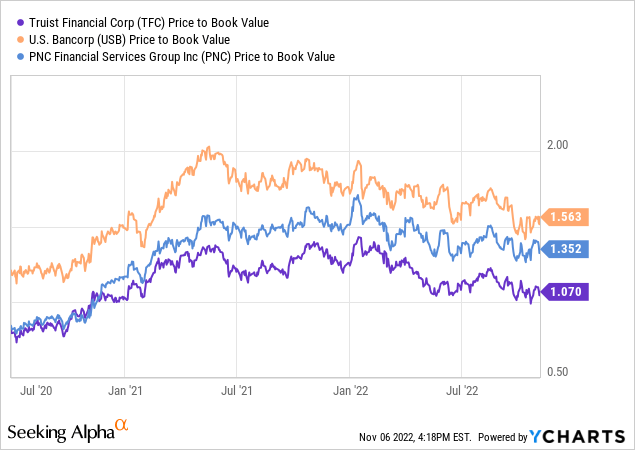
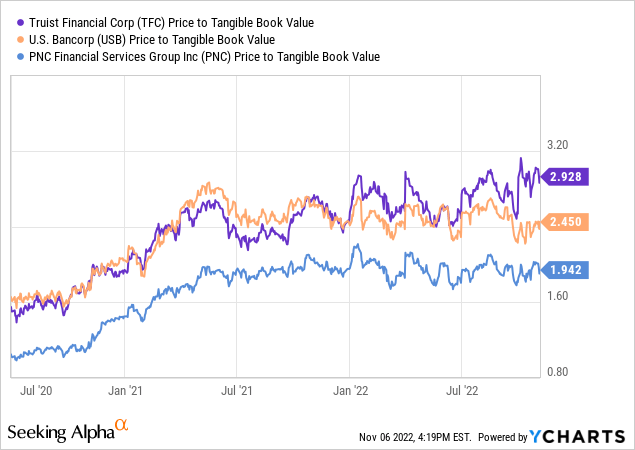
At these levels, the stocks are still trading at relatively high P/B and P/TBV levels. The old adage is to buy a bank when trading below 1.0 for P/B. Only TFC is within striking range of that rule of thumb.
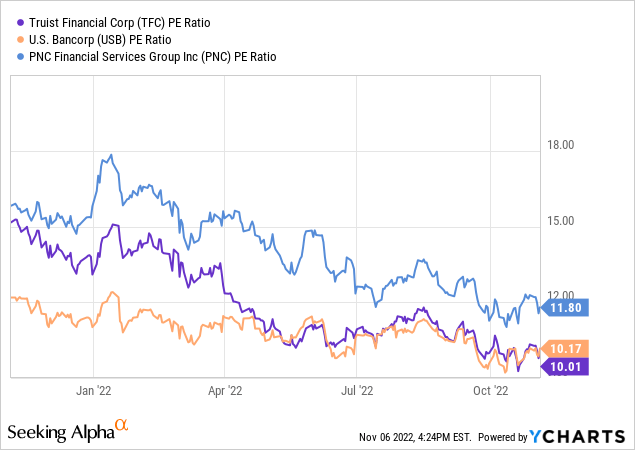
P/E ratios have come down from earlier this year as earnings have fallen off.
Looking at dividends, the companies all pay solid dividends, supported by strong balance sheets and healthy cash flows. For dividend investors, these stocks are all very attractive.
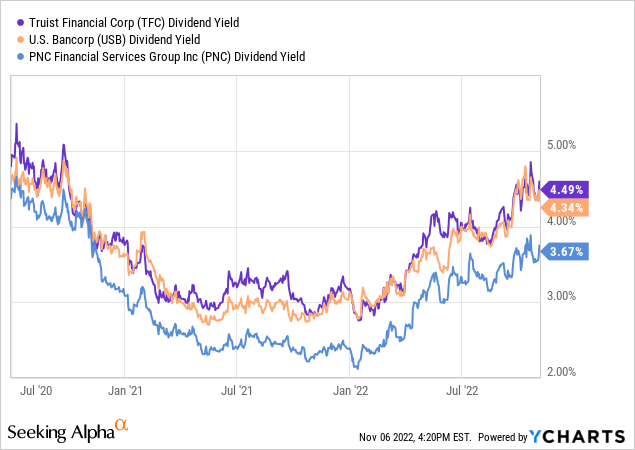
It is interesting to see that current yields are back to where they were during the middle of the pandemic lockdown in 2020. Perhaps it is good time to start considering these as investments again.
Despite the stocks being down 20% to 30% over the past year, I would not say that they are fire-sale cheap. They are trading at relatively high price to book ratios and the P/E ratios are still holding up for stocks that are operating in the worst economic environment since at least the financial crisis 15 years ago. Furthermore, the era of cheap money is over, and it is going to take months if not years for consumers and banks to adjust to higher interest rates.
Taking all of this into account and using different valuation techniques, I am going to rank the relative value of these 3 stocks. We are splitting hairs here. All are world-class organizations, with excellent operating histories and very favorable reputations within their particular markets. Since they are so close in terms of operating quality, it comes down to valuation.
| TFC | USB | PNC | |
| Current price | $43.66 | $42.83 | $156.50 |
| Estimated fair value | $47 – $48 | $45 – $46 | $146 – $147 |
| Estimated return to fair value | +9% | +6% | -6% |
From a valuation perspective, it looks like TFC might provide the best return at these levels. The stock has been beaten up more than the others, so perhaps most of the worst is behind them. PNC is an excellent company, but the stock might just be too expensive right now, particularly in this type of environment. Investors want some margin of error in case there is another leg down in the market.
As mentioned previously, investors really can’t go wrong with any of these companies. When the economy gets to a more normalized state, any of these will be good in an investor’s portfolio. For those looking for dividend income, these three are excellent choices, all with a history of increasing dividends. The economy is especially worrisome right now. Inflation is not yet under control and the Fed appears to be looking at higher rates for longer than what was generally expected nine months ago. For investors with room in their portfolio for some banking names, it may be beneficial to check these out.
Be the first to comment