

Thinkhubstudio
Notes to 30 November 2022
Our mission is for people to be surpassingly effective but not outrun machine-learning/AI systems in financial markets. The approach is to exploit the flaws in and users of statistical or mathematical models (e.g. Fermat and Pascal, Bayes), and instead use decision trees, as well as, grow our own collection of input-driven, fundamental predictive systems. More broadly, we aim to preserve and add competitive advantages throughout the investment process – from analysis, security selection, sizing, execution, to risk management.
All of this is utilised to generate investment returns aimed at being substantially in excess of those derived from mainstream equity strategies. When it comes to our performance focus, we believe we have plenty of competition but no peers. We are not in the business of educating but that of managing capital for those who picked us and follow the progress of their asset values.
In an era when most organisations are built with exits in mind, thereby squeezing or sweeping in as many customers as possible before ejecting, we admire organisations that have survived for over three generations and operate similarly in that we are gladly stuck with this business for the long haul without the ability to sell. We manage only one equity strategy.
Gross Investment Returns
|
Calendar YTD |
Avg. Cash Weighting |
Fiscal(1) YTD |
Avg. Cash Weighting |
|
|
2018(2) |
23.1% |
35.4% |
21.1% |
30.9% |
|
2019 |
33.0% |
25.5% |
22.4% |
35.8% |
|
2020 |
43.5% |
20.5% |
26.3% |
20.8% |
|
2021 |
5.9% |
18.6% |
45.4% |
20.6% |
|
2022 |
-18.2% |
4.0% |
-36.0% |
9.0% |
|
2023 |
n.a. |
n.a. |
16.7% |
3.0% |
|
Total Return Since Inception |
103.4% |
20.6% |
||
|
Compound Annual Return |
16.4% |
|
1.Fiscal year runs from 1 July to 30 June in Australia 2.Since inception on 27 March 2018 in the AUD reference account 3.Investment returns are before fees, expenses, and taxes |
Features & portfolio analytics
|
Features |
Portfolio Analytics |
||
|
Structure |
Managed Account |
Sharpe ratio |
0.6 |
|
Administrator |
Interactive Brokers |
Sortino ratio |
1.2 |
|
Custodian / Prime Broker |
Interactive Brokers |
Annualised standard deviation |
23.2% |
|
Min. initial investment |
$1,250,000 |
Annualised downside deviation |
11.8% |
|
Min. additional investment |
Any amount at any time |
Largest monthly gain |
19.8% |
|
Qualifying criteria |
Wholesale or Qualifying |
Largest monthly loss |
-13.6% |
|
Management fee p.a. |
0.5% |
Largest drawdown |
-36.0% |
|
Performance allocation |
22-24% |
Winning month ratio |
0.60 |
|
Withdrawals |
Any amount at any time, with twenty Business Days’ notice |
Avg. cash weighting since inception |
20.6% |
|
Total return since inception |
103.4% |
||
|
Distribution |
Same as withdrawals |
Annualised return since inception |
16.4% |
| 1.Sharpe and Sortino ratios assume the Australian cash rate as the applicable risk-free rate2.Net asset values are provided by Interactive Brokers. Performance figures are before fees, expenses, and taxes |
Portfolio
To begin this post by writing that the market or economic environment have both positive and negative forces, and that equity markets can go up or down, would sound uncourageous. Alternatively, to not highlight all the topical issues facing investors, will probably come across as missing the point.
The reality is (and has always been) that nothing in markets is one sided, and if so, only occasionally. Yes – including inflation and interest rates.
For those who adhere to data, recent incoming prints are unignorable – especially in the context of broader frameworks and policy objectives. In the USA, you are seeing the price of goods come down. New rents on new leases are declining, but longer/older-dated leases are being repriced higher – which on a net basis will still exert downward pressure in indices in the Housing Services category of CPI. Average hourly earnings are also declining, and the Employment Compensation Index (ECI) has stepped down noticeably – both of which influence wages in the core services category.
These are not predictions, but incoming data.
And if that is not enough, the recent announcement to cap the price of Russian oil at US$60 per barrel of crude oil will only reinforce the trend. In futures pricing 101, there is a No Arbitrage Principle. That is, arbitrages should not exist, as players will engage in the same trade until the risk-free profit opportunity disappears.
What this means is that if the price of oil is higher than US$60 per barrel, players can buy Russian oil at $60 and sell at the higher market price, thereby pocketing the risk-free profit. As you can imagine, players will flock to this trade until the profit disappears. So, the price of non-Russian oil will fall to around US$60 per barrel +/- financing costs, holding costs, and other outgoings/incomings for structuring the trade.
If the price of oil is lower than US$60 per barrel, it has been reported that the mechanism will lower the cap for Russian oil to below US$60 per barrel at a level that is a single-digit percentage discount to the market price.
You can almost hear the chuckle from the buyers of oil (not oil stocks!). Further, the cap for refined petroleum products will commence around early February 2023.
What all this means is that the market is set up in a certain way, which if spelled out, would sound so odd and dissonant to prevailing views, that it can only be misinterpreted.
On a stock-specific or industry level, you should feel tremendously excited about the recent release of ChatGPT – which has gone viral on the internet. Bear in mind that this is just one of many Ai projects.
If you put the 2022 version of ChatGPT in the context of where Siri was in 2018, you might feel terrified. As an individual, I do. Ai is a phenomenon that is not around the corner, but at the corner.
The portfolio, however, is poised to benefit enormously from this. There is little doubt Ai will, at best, complement some of the workforce and drive huge productivity. But in reality, it will eliminate vast amounts of the workforce.
Think of Ai like the human brain. If the brain is constrained, it could make sense to buy the method that utilises the brain best. But in Ai, you want to buy the brain, not the method that utilises the brain at only one point in time.
The reason why is because unlike the human brain (which is limited, has a peak, deteriorates, and needs to rest), the ‘brain’ in Ai is continuously getting faster and larger, and can be switched on 24/7 365 days a year. Knowledge will become commoditised. Superior algorithms or training models will be emulated in shorter and shorter time frames (previously years, now months, and eventually minutes). Whatever discovery, advancement, or breakthrough one company makes today, it will become obsolete and outdated.
To this end, we expect to hold some of our positions for a long period of time, irrespective of short-term variances, noise, and quarterly unit demand projections. The reason why is because when that train – which is now at the corner – flies past the masses, human beings and capital will have no choice but to clamour to be users of these platform and products, as a matter of survival. The cashflows which are being produced by these companies are already large and will compound in larger amounts into the future.
Hopefully, as more economic and company data is printed each month, the portfolio will surpass its 2021 level. In the meantime, I hope everyone is well and has a good break in the festive period.
Portfolio Positioning
At month end, the portfolio held 9 stocks – 9 listed in USA.
At month end, the portfolio had a gross exposure of 96.2%, consisting of 96.2% long and 0% short; as well as 3.8% in cash.
In terms of liquidity, the weighted average market capitalisation is A$181 billion and the stock with the smallest market capitalisation is circa A$2 billion.
Cumulative Gross Investment Returns
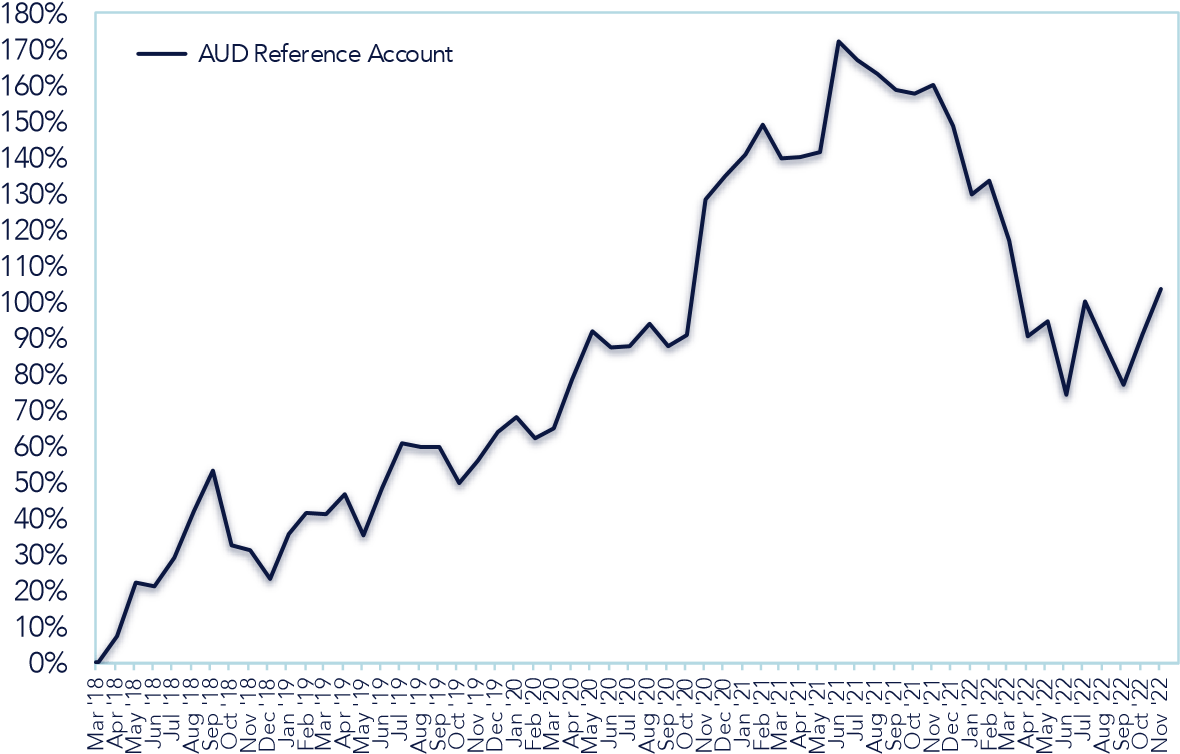
Growth of An Assumed $500,000 Investment in The Reference Account
|
Date |
Gross Returns |
Gross Monthly Returns |
|
27 Mar 18 |
$500,000 |
|
|
Mar 18 |
$500,859 |
+0.17% |
|
Apr 18 |
$536,101 |
+7.04% |
|
May 18 |
$611,001 |
+13.97% |
|
Jun 18 |
$605,669 |
-0.87% |
|
Jul 18 |
$645,902 |
+6.64% |
|
Aug 18 |
$710,053 |
+9.93% |
|
Sep 18 |
$766,429 |
+7.94% |
|
Oct 18 |
$662,130 |
-13.58% |
|
Nov 18 |
$655,769 |
-0.99% |
|
Dec 18 |
$615,634 |
-6.12% |
|
Date |
Gross Returns |
Gross Monthly Returns |
|
Jan 19 |
$677,324 |
+10.02% |
|
Feb 19 |
$707,893 |
+4.51% |
|
Mar 19 |
$705,362 |
-0.36% |
|
Apr 19 |
$733,917 |
+4.05% |
|
May 19 |
$676,106 |
-7.88% |
|
Jun 19 |
$741,201 |
+9.63% |
|
Jul 19 |
$803,346 |
+8.38% |
|
Aug 19 |
$797,733 |
-0.70% |
|
Sep 19 |
$798,650 |
+0.11% |
|
Oct 19 |
$748,230 |
-6.31% |
|
Nov 19 |
$779,172 |
+4.14% |
|
Dec 19 |
$818,501 |
+5.05% |
|
Jan 20 |
$839,480 |
+2.56% |
|
Feb 20 |
$810,870 |
-3.41% |
|
Mar 20 |
$824,619 |
+1.70% |
|
Apr 20 |
$893,734 |
+8.38% |
|
May 20 |
$958,217 |
+7.22% |
|
Jun 20 |
$935,799 |
-2.34% |
|
Jul 20 |
$937,519 |
+0.18% |
|
Aug 20 |
$968,929 |
+3.35% |
|
Sep 20 |
$937,822 |
-3.21% |
|
Oct 20 |
$953,314 |
+1.65% |
|
Nov 20 |
$1,142,256 |
+19.82% |
|
Dec 20 |
$1,174,271 |
+2.80% |
|
Jan 21 |
$1,203,102 |
+2.46% |
|
Feb 21 |
$1,244,352 |
+3.43% |
|
Mar 21 |
$1,197,558 |
-3.76% |
|
Apr 21 |
$1,200,664 |
+0.26% |
|
May 21 |
$1,207,360 |
+0.56% |
|
Jun 21 |
$1,360,798 |
+12.71% |
|
Jul 21 |
$1,334,451 |
-1.94% |
|
Aug 21 |
$1,316,021 |
-1.38% |
|
Sep 21 |
$1,293,864 |
-1.68% |
|
Oct 21 |
$1,288,297 |
-0.43% |
|
Nov 21 |
$1,300,476 |
+0.95% |
|
Dec 21 |
$1,243,326 |
-4.39% |
|
Jan 22 |
$1,148,822 |
-7.60% |
|
Feb 22 |
$1,166,565 |
+1.54% |
|
Mar 22 |
$1,085,247 |
-6.97% |
|
Apr 22 |
$952,339 |
-12.25% |
|
May 22 |
$973,380 |
+2.21% |
|
Jun 22 |
$871,340 |
-10.48% |
|
Jul 22 |
$1,000,517 |
+14.83% |
|
Aug 22 |
$939,974 |
-6.05% |
|
Sep 22 |
$884,736 |
-5.88% |
|
Oct 22 |
$954,084 |
+7.84% |
|
Nov 22 |
$1,016,951 |
+6.59% |
Thank you for reading this Andaz note/update. If you would like to drop us a line, please reach out using the contact form on our website.
Thank you and in touch.
Yours sincerely,
Yizhong Chan
|
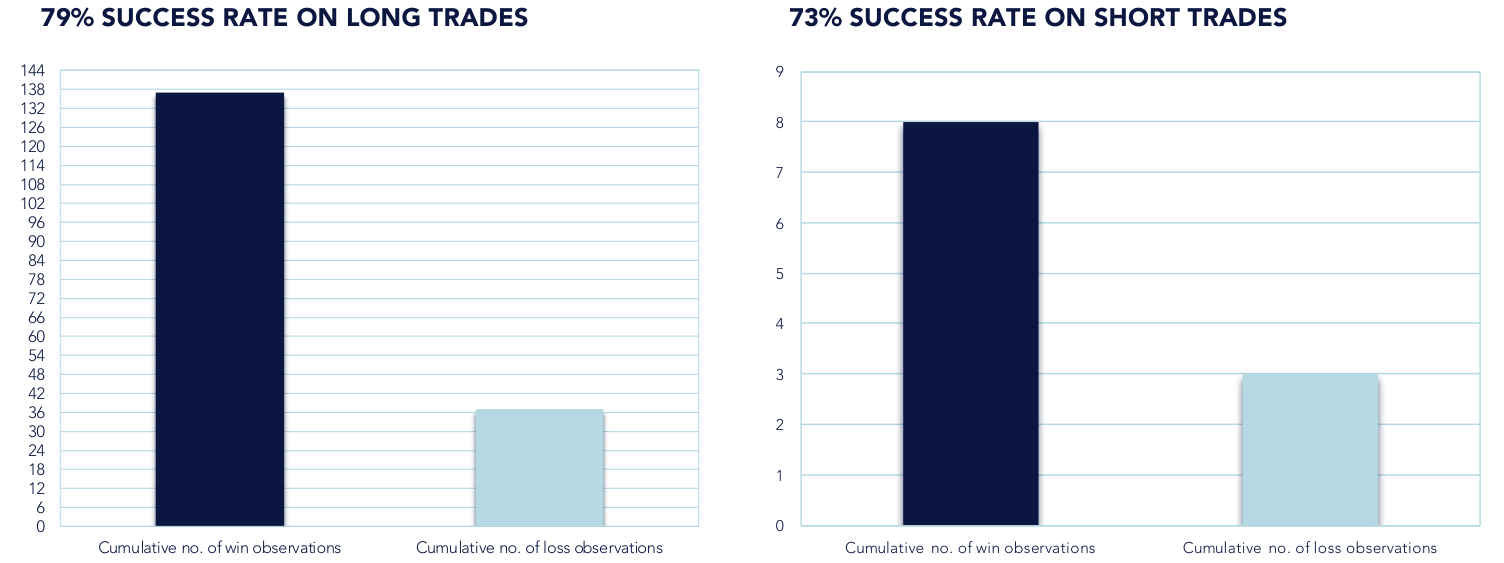
© 2022 Andaz Private Investments Pty Ltd (“Andaz”). The information contained herein is being provided to investors in Andaz products (collectively the “Funds”). This document and the information herein is confidential and not for further dissemination. This report is for distribution only under such circumstances as may be permitted by applicable law. All information contained herein relates to the Andaz AUD product, unless otherwise specified. All NAV figures were taken directly from actual statements generated by Interactive Brokers, and are unaudited. Each client will receive individual statements showing returns from the custodian. Actual results may differ from the data presented due to the timing of each investors’ capital activity, account parameter restrictions, and other such factors. While the performance results of the Funds may have been compared here with the performance of well-known and widely recognised indexes, the indexes have not been selected to represent an appropriate benchmark of the Funds whose holdings, performance, and volatility may differ significantly from the securities that comprise the indexes. The performance data is for sovereign/institutional investors who usually negotiate fees, are subject to varying brokerage commissions, and may not be subject to non-resident dividend withholding taxes. For actual results net of all fees, applicable expenses and taxes, please refer to individual statements provided by the custodian. Past performance is not necessarily indicative of future results. Had the highest fee structure, and all expenses and all taxes been applied, performance results would likely be lower. Cumulative no. of win-loss observations since inception includes security selection, re-entering an exited but previously owned security and decisions to materially re-weight existing positions, but exclude foreign exchange attribution. The information contained herein reflects the opinions and projections of Andaz as of the date of publication, which is subject to change without notice at any time subsequent to the date of issue. Andaz does not represent any opinion, estimate or projection will be realised. The information presented in this document is not intended to be, nor should it be construed as, investment advice. It has not been prepared taking into account any particular investor’s or class of investor’s investment objectives, financial situation, circumstances or needs, and should not be used as the basis for making investment, financial or other decisions. This shall not constitute an offer to sell or the solicitation of an offer to buy any interests in any product managed by Andaz. Such an offer to sell or solicitation of an offer to buy interests may only be made pursuant to definitive subscription documents between Andaz and an investor. The information provided should not be deemed a recommendation to purchase or sell any specific security. Andaz has an economic interest in the price movement of the securities discussed in this document, but is subject to change without notice. While the information in this document has been prepared with all reasonable care, neither Andaz nor its affiliates makes any representation or warranty as to the accuracy or completeness of any statement in this document. To the extent permitted by law, no liability is accepted for any loss or damage as a result of any reliance on this information. This document may contain forward-looking statements regarding our intent, belief or current expectations with respect to market conditions. Readers are cautioned not to place undue reliance on these forward-looking statements. Andaz does not undertake any obligation to revise any such forwardlooking statements to reflect events and circumstances after the date hereof. Andaz does not guarantee the repayment of capital, payment of income or portfolio performance. All investments involve risk including the loss of principal.
|
Editor’s Note: The summary bullets for this article were chosen by Seeking Alpha editors.
Be the first to comment