

G0d4ather/iStock via Getty Images
Conventional wisdom says that an inversion of the Treasury yield curve is a good predictor of a forthcoming recession. Today, the yield curve is more inverted than at any time since the early 1980s, so many are saying that means the chances of a recession are pretty high. The curve is strongly inverted because the bond market figures that a recession will force the Fed to reduce short-term rates in the future, but not immediately – in fact, the market expects at least one more tightening of 50 bps and possibly another within 4-5 months.
I’ve discussed this subject many times here on this blog, and I’ve tried to make the point that while an inverted yield curve has indeed preceded every recession, so have other indicators: e.g., very high real yields, high swap and credit spreads, and rising unemployment claims. None of those other indicators are flashing recession signals right now. Plus, the current Fed tightening cycle is very different this time than at any other time before. The Fed no longer drains liquidity in order to push short-term rates higher, and that means a lot less pressure on the banking system. Liquidity today is in fact still abundant.
I’ve also pointed out that the inflation problem we’re experiencing today is unique: unlike all other tightening cycles (nearly every one of which preceded a recession), the Fed was fighting an inflation that the Fed itself caused (i.e., by being too easy for too long). This time around, the inflation was the result of massive government spending (transfer payments) that came at a time when the economy was in lockdown and risk aversion was very high. People welcomed the cash and let it sit in their bank accounts. But starting early last year the cash wasn’t so welcome or needed, so people started spending at a time when the economy wasn’t ready to meet the demand, and inflation was the result. So the inflation problem this time is more temporary in nature, and thus should be easier to resolve. And in fact, it is being resolved as we speak: witness the strong dollar, falling commodity prices, falling housing and commercial property prices, and the fact that most measures of inflation peaked some months ago.
Add it all up and I think the odds of a recession are lower than the market is priced for, which implies that the Fed is likely to hike rates less than the market expects.
Some charts to illustrate:
Chart #1
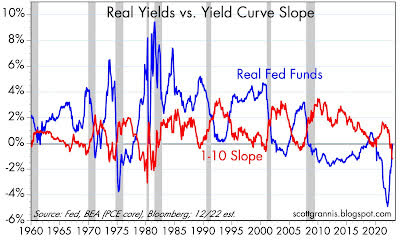
Chart #1 shows the slope of the Treasury yield curve (red line) and the real Fed funds rate (blue line). Note that an inverted curve and high real rates have always preceded recessions. Yes, today the curve is very inverted, but real yields are not particularly high. High real yields crush debtors, but that’s not the case today. Note how low credit spreads are in the next two charts.
Chart #2
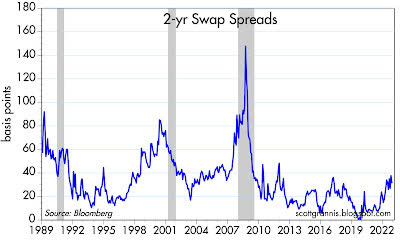
Chart #2 shows the level of 2-yr swap spreads. When low, these spreads suggest that the outlook for the economy and corporate profit is good, and liquidity conditions are plentiful. Spreads today have been this high many times without a recession following.
Chart #3
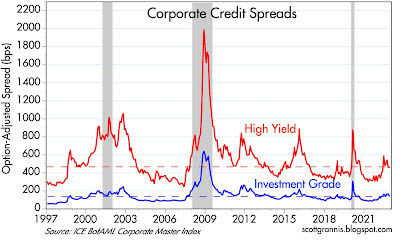
Chart #3 shows credit spreads for investment grade and high-yield corporate bonds. Low spreads suggest the market is relatively confident about the outlook for corporate profits and that in turn implies the outlook for the economy is healthy. Although they are somewhat elevated, they are nowhere near the levels we see prior to or during recessions.
Editor’s Note: The summary bullets for this article were chosen by Seeking Alpha editors.
Be the first to comment