

Jonathan Kitchen
Short-term market outlook
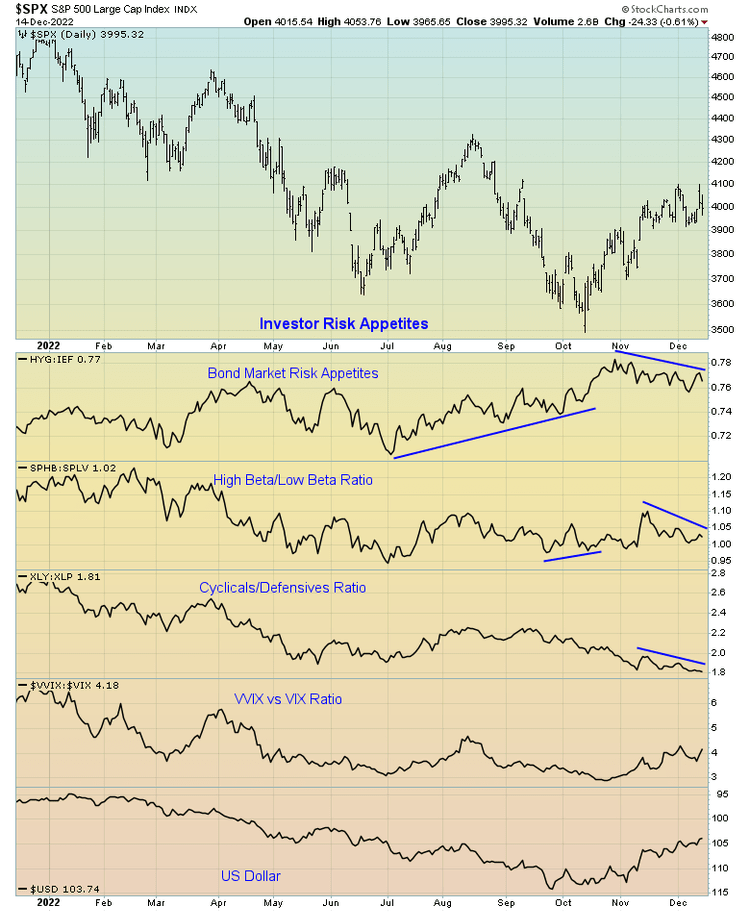
Following this week’s downside surprise in CPI, stocks attempted to rally before selling pressure took hold. Powell’s far from dovish presser certainly didn’t help, with the market once again finding itself below both the 200-day moving average and recent downtrend line. Notably, the attempted move higher coincided with a completed 9-13 DeMark sequential sell signal and bearish divergences in both RSI and momentum (i.e., price vs. the 50-day moving average). For now, the 4,000 area on the S&P 500 looks to be the important overhead resistance point. If price action can manage to break above this level in the near future, then all bets are off.
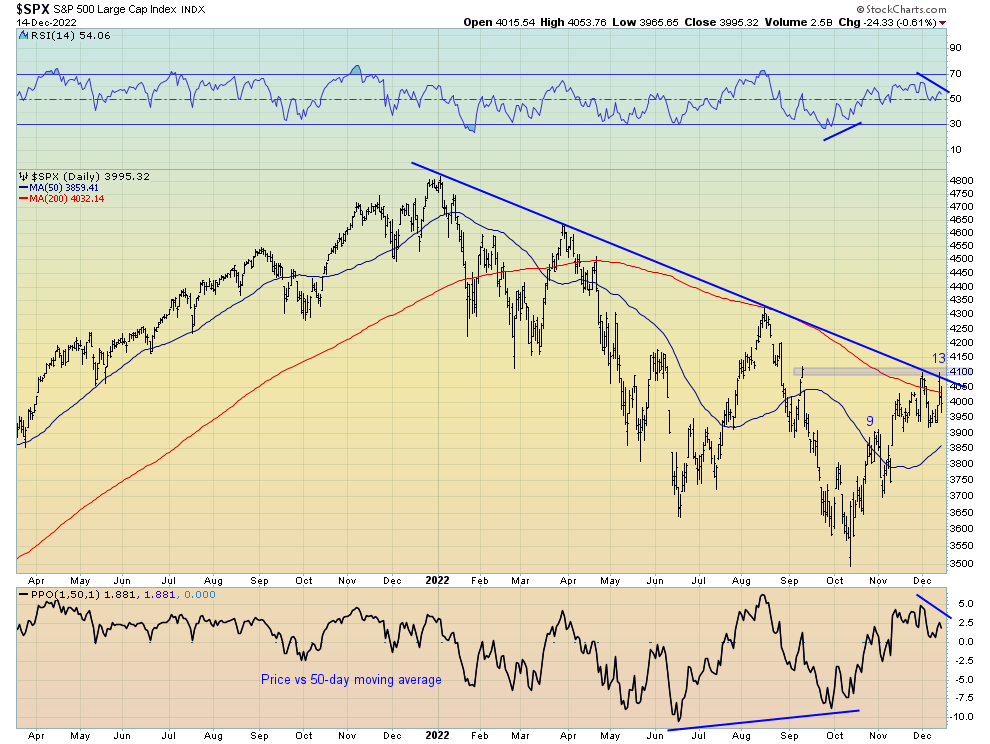
Given the market was unable to follow through with any sustained move to the upside despite the downside surprise in CPI, this leads me to believe the short-term upside is limited. The stock market, much like the bond market, may be beginning to realise slowing growth is now the greater headwind than inflation.
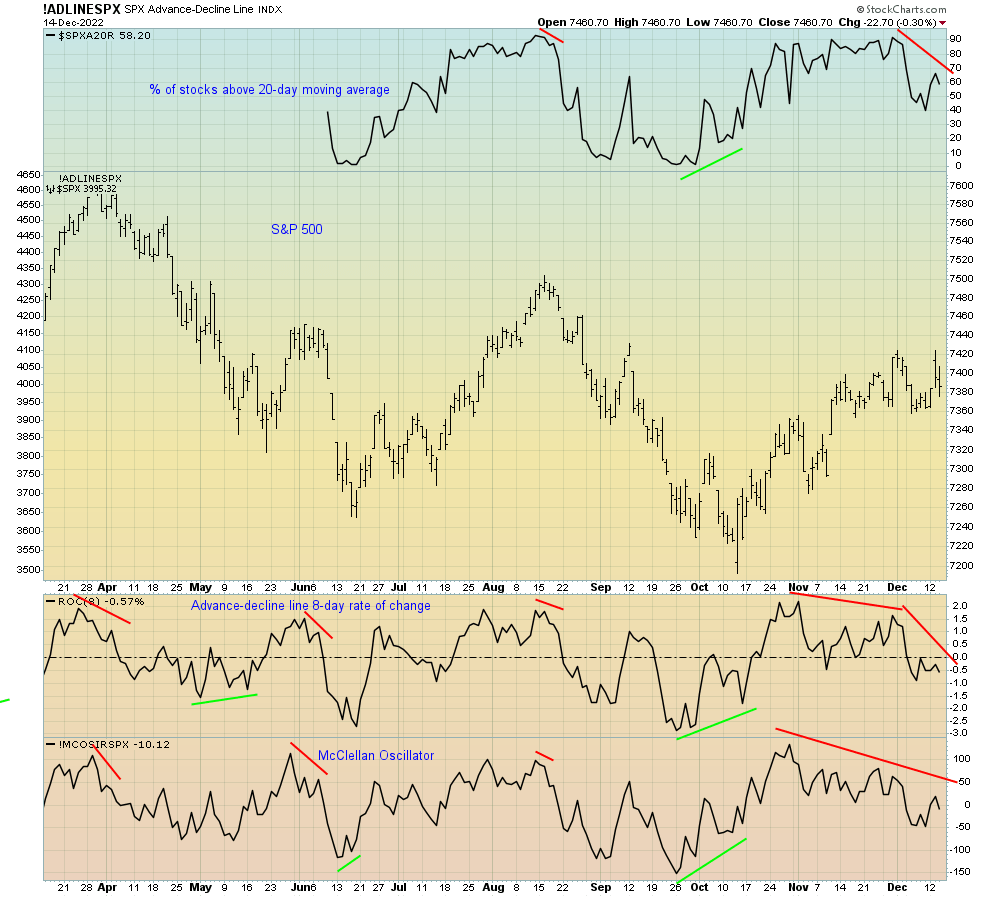
Although the underlying market breadth is on solid footing, which distinguishes this rally from the preceding bear market rallies of 2022, some of the short-term breadth measures I monitor have diverged bearishly this week. Similar divergences in the percentage of stocks above their 20-day moving averages, the eight-day rate-of-change in the advance-decline line and the McClellan Oscillator have generally resulted in short-term losses in the following weeks.
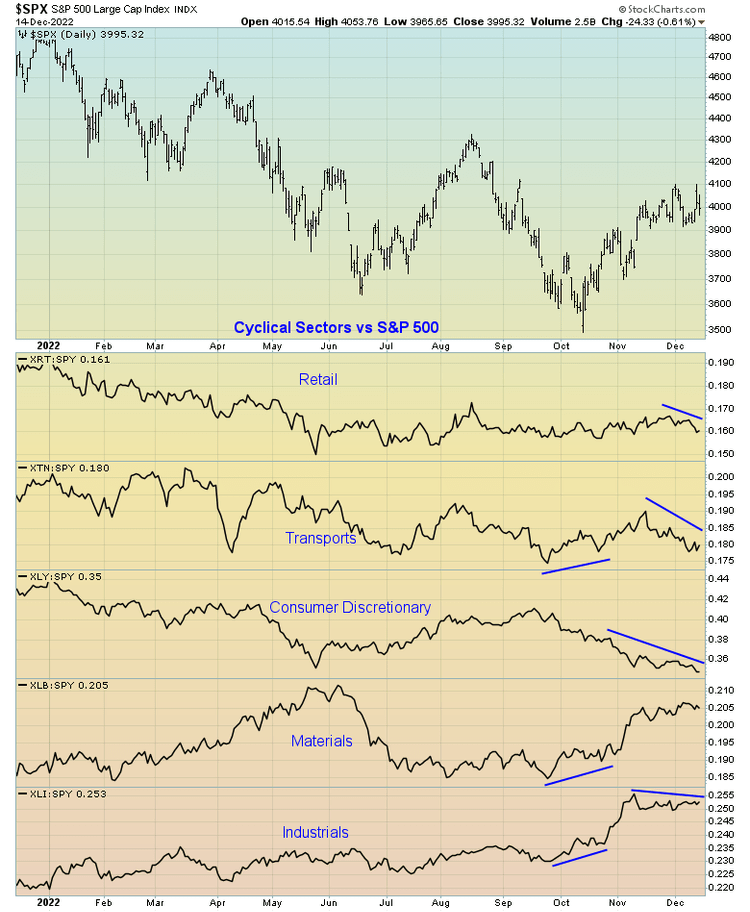
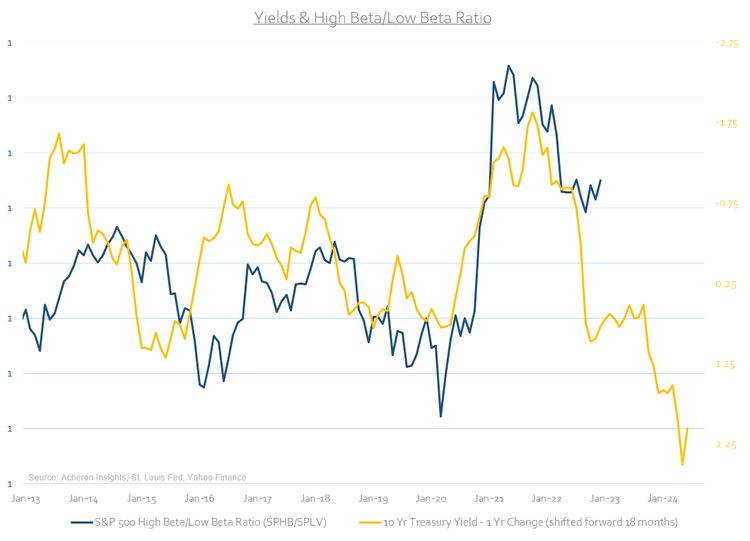
Likewise, several other measures of market internals haven’t been supportive of the recent gains. The relative performance of the cyclically sensitive areas of the market – retail, transports, consumer discretionary and industrial stocks – have not made new highs in line with the broad market. The same can largely be said of investor risk appetites. These include bond market risk appetites, the high-beta/low-beta ratio and the cyclical versus defensives ratio, all of which have not confirmed the new highs.
Such measures of the internal health of the market are some of the best indicators of underlying market strength. Currently, the market seems to be lacking in that area, at least for now.
Unfortunately, seasonality also appears to be an additional headwind facing markets over the coming weeks. Although December is generally a positive month for stocks, this is not so during mid-term election years, and is especially not so during such times when the market was in a bear market, as we undeniably are now. Should these historical trends hold true (which absolutely is not guaranteed), the price action into Christmas and the New Year may not be so jolly.
Source: Topdown Charts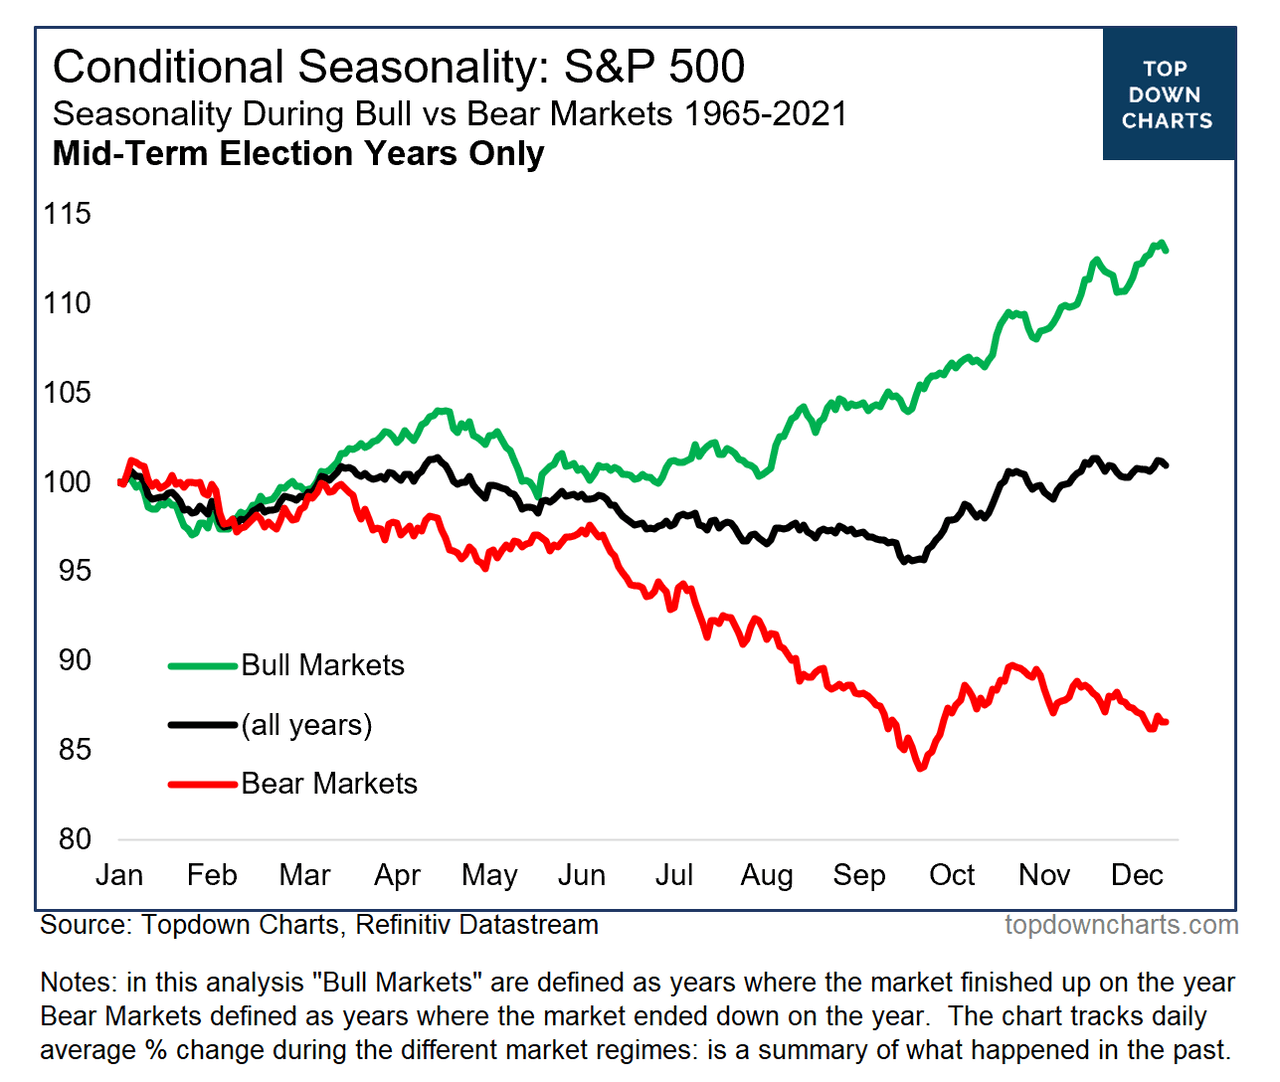
A dashboard and quadrant approach
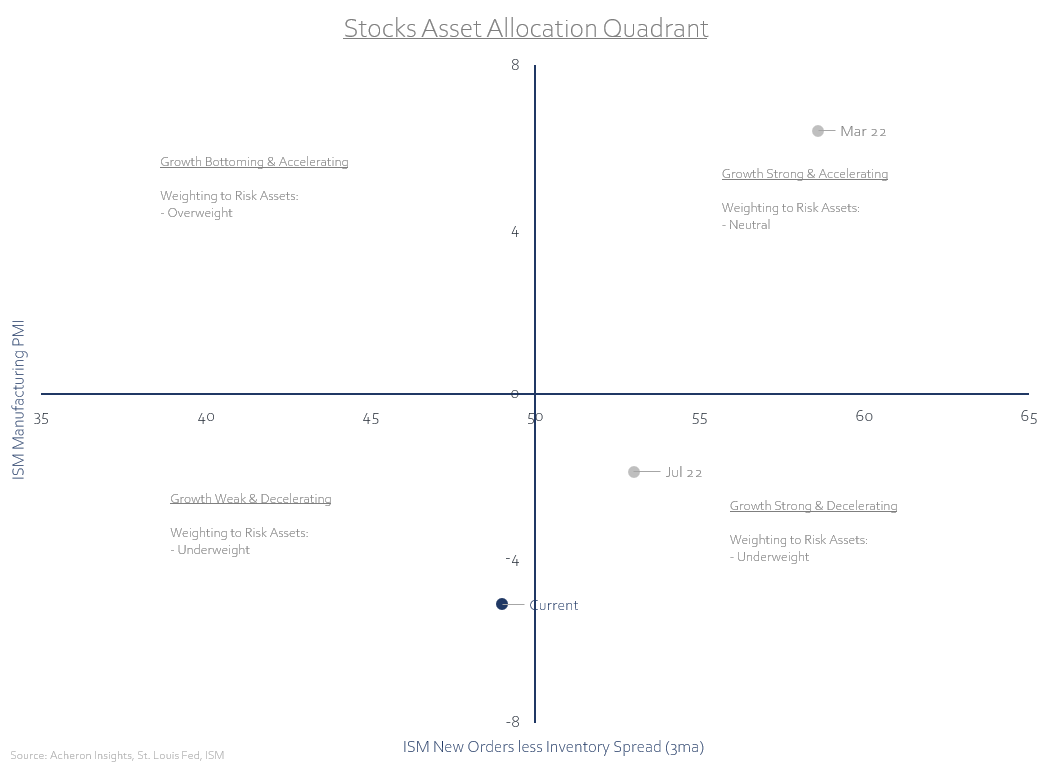
Integral to my investment and asset allocation process is assessing the outlook for the business cycle, as well as other important factors that drive markets such as liquidity, market internals and technicals. This is true of most asset classes to which I follow and invest. One way I am able to visually represent such factors is through a quadrant approach. Using quadrants to guide your asset allocation framework is an incredibly useful tool that serves many investors well, including the biggest hedge fund in the world, Bridgewater.
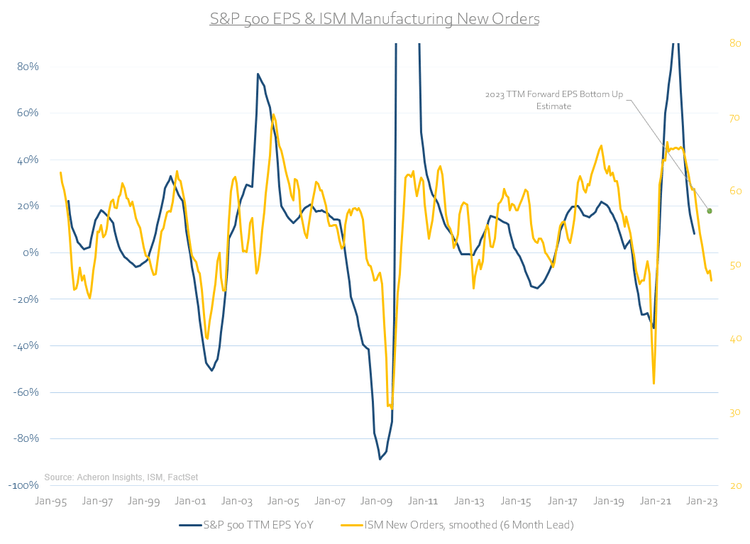
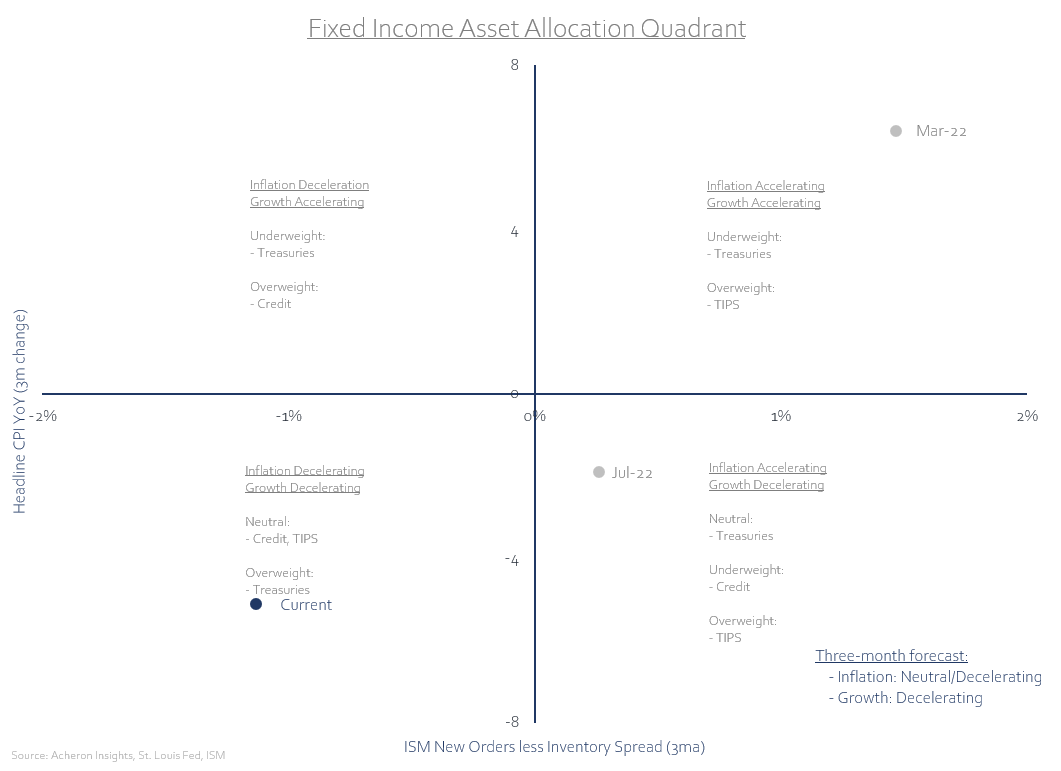
For the stock market, the best six to 12-month returns are generally made when growth has bottomed and is accelerating. Conversely, the worst time to be overweight stocks is when growth is peaking and decelerating. I use a myriad of leading indicators when assessing the outlook for economic growth, as one single indication can never be relied upon, but, for the purposes of simplicity my equity/risk asset allocation quadrant uses the ISM Manufacturing PMI as a proxy of the current state of the business cycle and the ISM New Orders less Inventory spread as a leading indicator for the PMI itself. As we can see below, growth is yet to bottom and, given the leading indicators of growth are yet to accelerate, prudent asset allocation dictates an underweighting to stocks and pro-cyclical risk assets seem the logical choice.
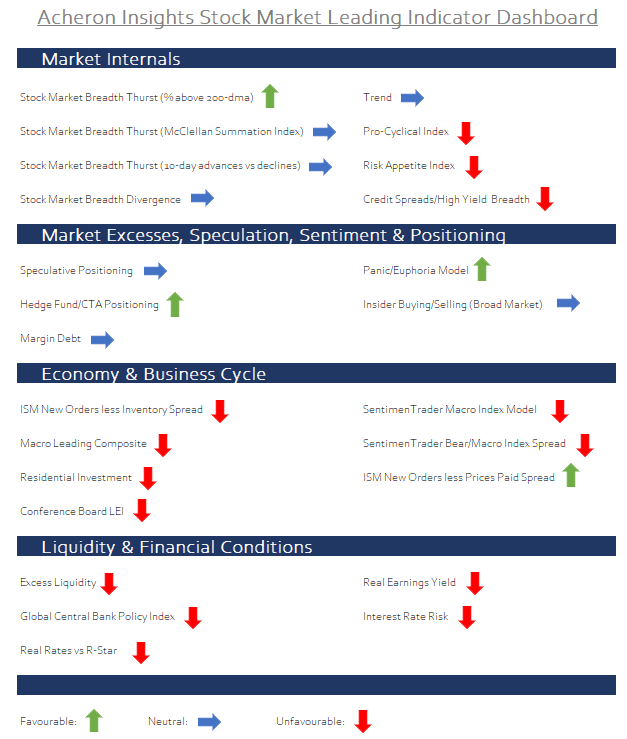
As an extension to this analysis, what follows is a number of indicators to which I also use to govern my asset allocation decisions toward the stock market. These measures and leading indicators are some of which I deem most valuable when assessing the market outlook for the following six to 12 months. When the majority of signals are flashing red and warning sounds are abound, overweight stocks is not the place to be. Conversely, when there is a sea of green, it generally pays to be long risk.
For now, the message is fairly clear, the forward-looking indicators for the business cycle, liquidity and financial conditions suggest an underweight exposure to stocks, while measures of market internals, sentiment and positioning are more neutral. Unless we see a positive inflection in growth and liquidity, any move higher will likely be on the back of investors re-entering the market to chase rallies, likely not sustainable. Overall, a neutral to underweight exposure to highly cyclical areas of the market seems prudent. Importantly, in such environments, company fundamentals will likely matter a whole lot more than they have in recent times.
Leading indicators
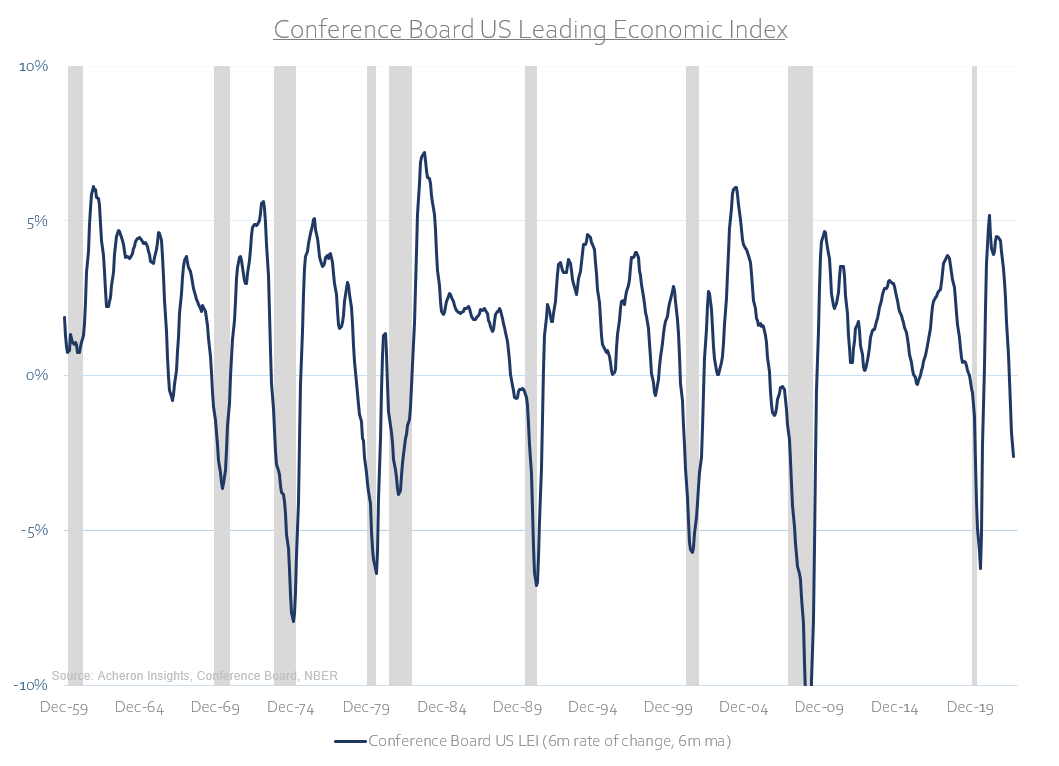
Overall, there are still too many warning flags from several of the leading indicators of market performance, which leaves me skeptical of stocks over the next few quarters. Firstly, the Conference Board’s Leading Economic Index for the US just turned negative of a rate-of-change basis (taking the six-month average of the six-month change). Historically, the stock market has generally struggled during such times, with every negative reading below -2.5% preceding a recession (current reading is -2.6%). Caution is still warranted from a growth perspective.
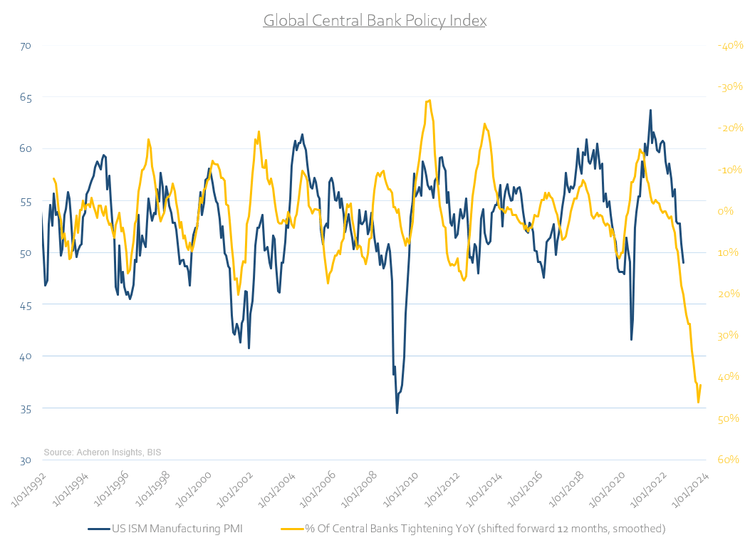
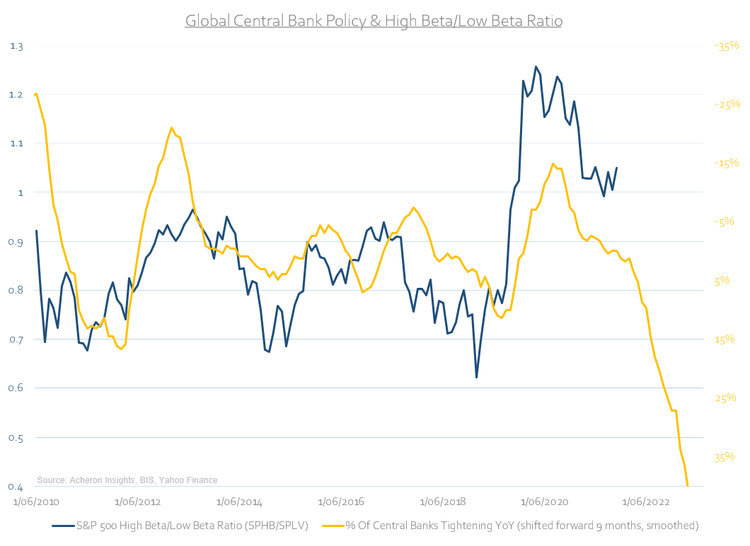
Meanwhile, central banks worldwide continue to raise their respective policy rates on net to the most significant degree since the 1970/80s. Tight financial conditions such as these generally do not favour high-beta risk assets.
Nor do higher rates in general.
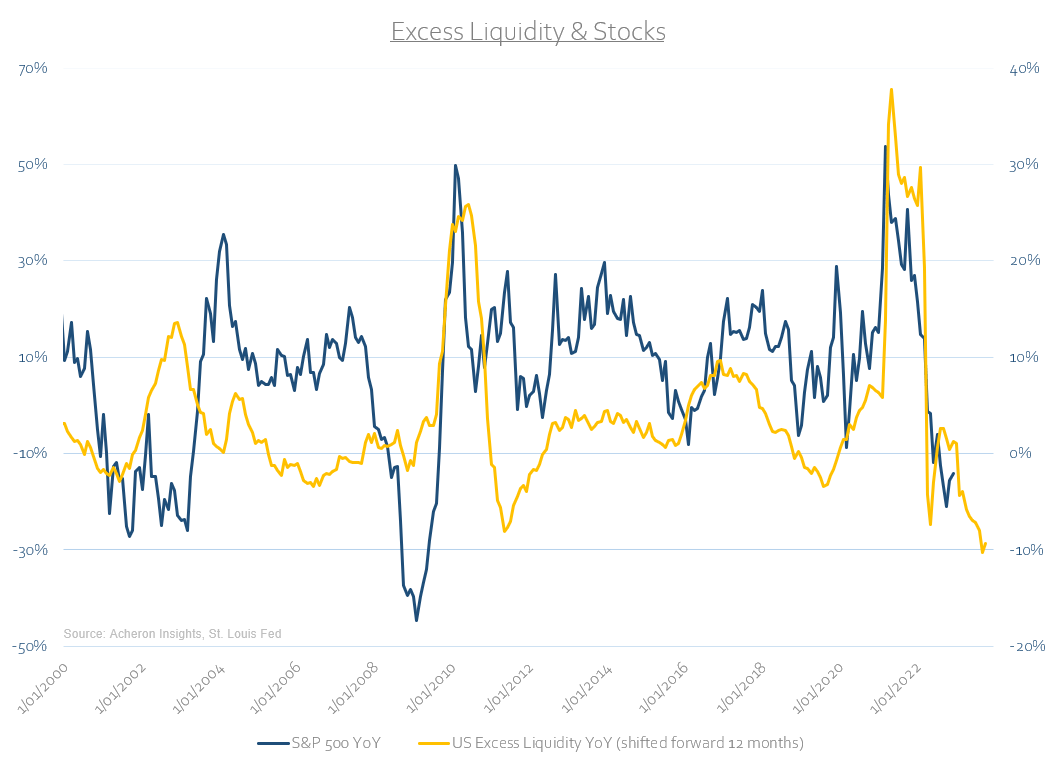
And for that matter, neither does excess liquidity. I still think patience is key for the time being.
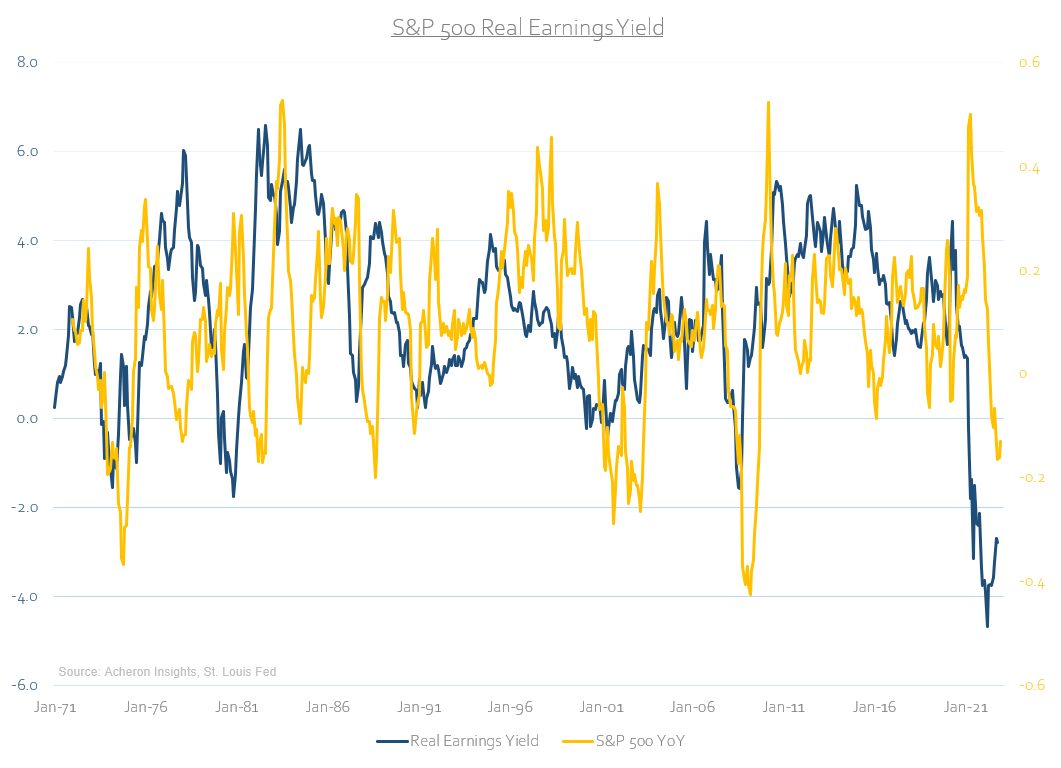
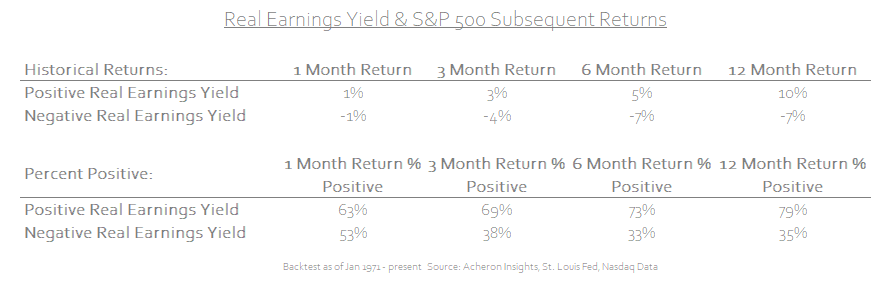
Particularly with the S&P 500’s real earnings yield at its current level, with negative readings not having a high risk/reward ratio for stocks.
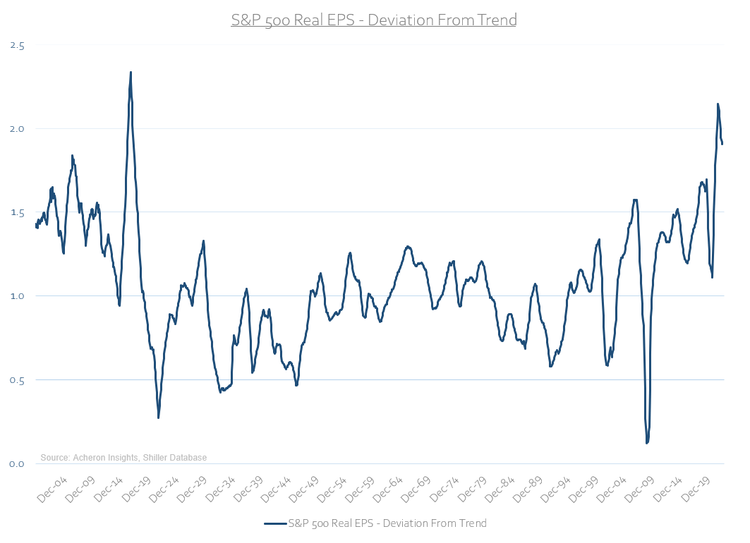
Or with earnings also likely heading lower in the months ahead. Remember, the S&P 500’s real EPS remain nearly as far above their exponential trend than at any point over the past century.
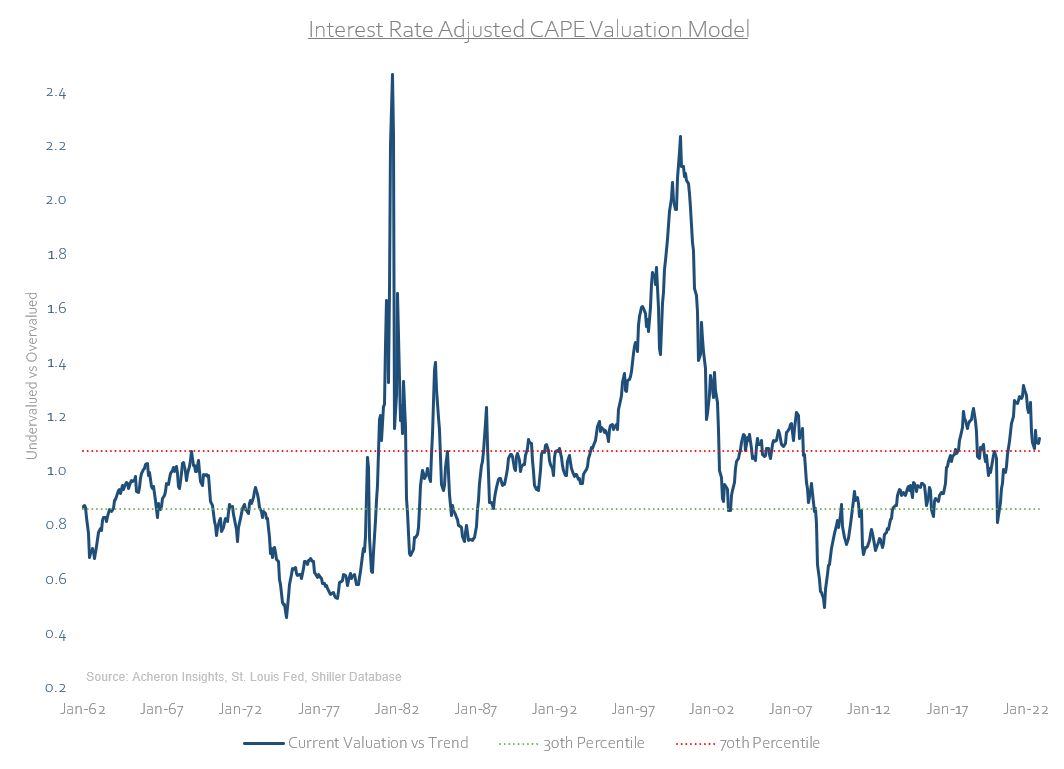
It is also worth mentioning that valuations are too far from any bargain level. Though valuations have very little bearing on short or even medium-term returns, they are an important consideration for long-term investors. If we adjust the CAPE ratio for the level of interest rates going back 60 years, valuations are still above their 70th percentile. The overall market is still not cheap.
What are stocks pricing in?
However, it must be said the market has so far done an excellent job pricing in the slowdown in growth and liquidity this year. This certainly limits the downside risk going forward.
Where’s the opportunity?
Clearly, broad stocks are not the best opportunity here. My base case is we just trend sideways over the next year or so as valuations normalise. There is of course always much value to be found within certain sectors of the market, but, overall stocks don’t seem to be it.
Fortunately, bonds continue to present themselves as a solid risk/reward investment for 2023. I detailed my case for bonds here, and their likely outperformance versus stocks again here. From a business cycle perspective, bonds look the better bet than stocks. My fixed interest quadrant certainly agrees.
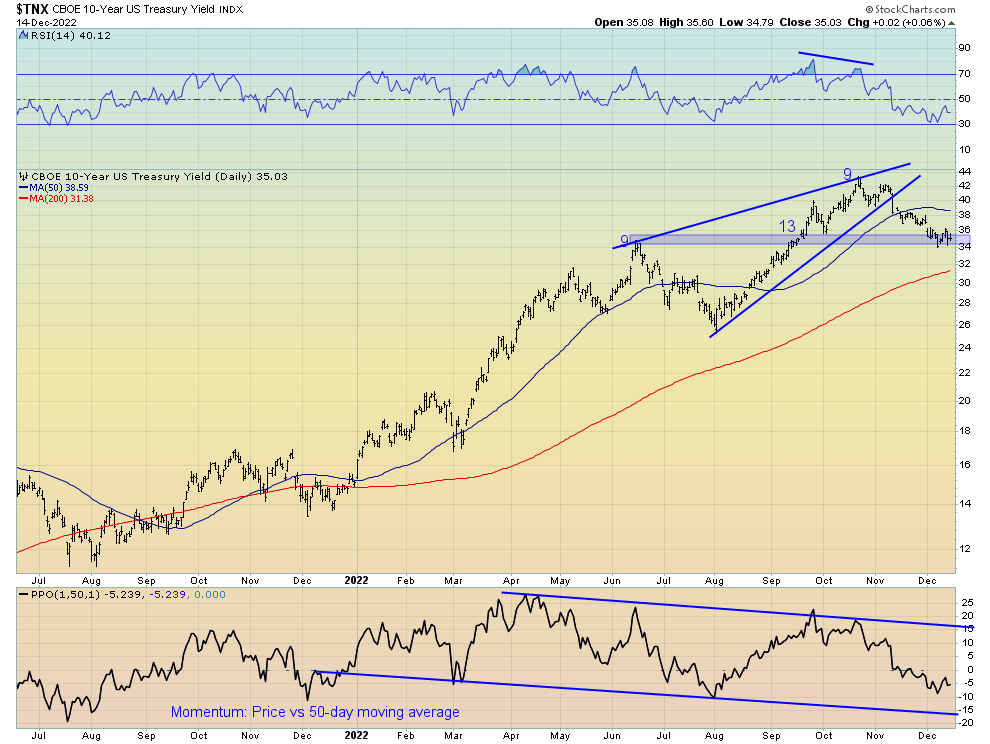
Short term, I’d be hesitant immediately buying bonds. The 10-year Treasury yield has sold off hard and fast and is now at an important level of support, one in which you would expect to see some kind of rally or bounce take place.
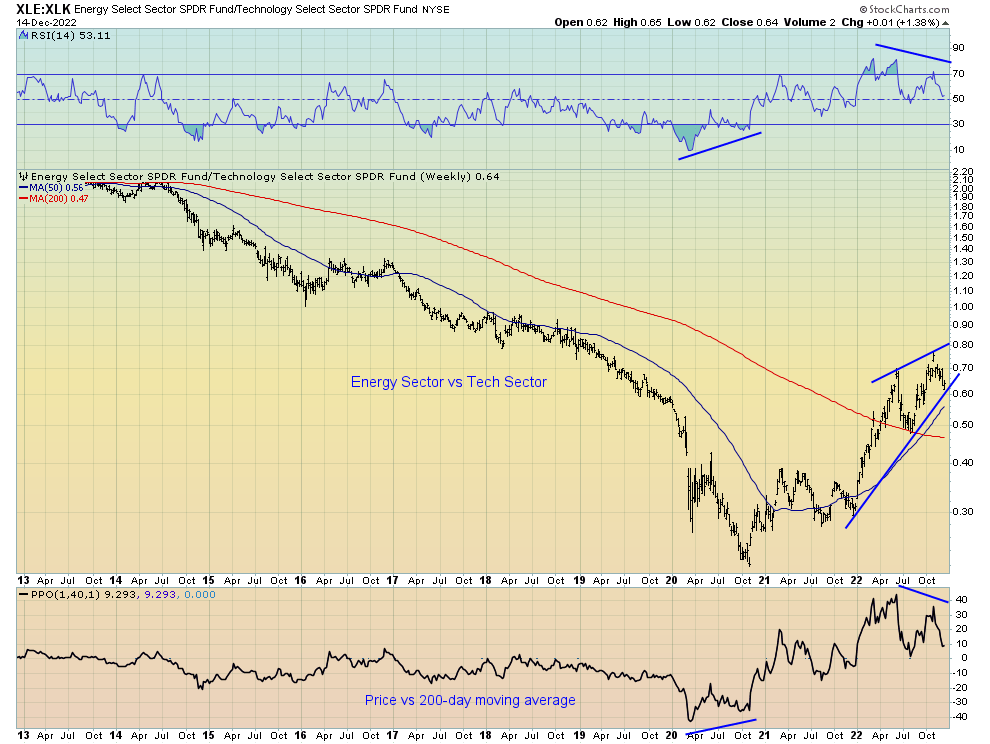
Should duration indeed be the winner over the next year or so, this means we could see a rotation back into long-duration areas of the market for a short period. Though my preference is for stocks related to real assets over financial assets long term, such as energy stocks, such areas of the market are probably due for a bit of rest. Indeed, from a technical perspective, the outperformance of energy versus tech over the past year has become a little extreme and looking exhausted.
Be the first to comment