

eyewave/iStock Editorial via Getty Images
Buffett has held American Express (NYSE:NYSE:AXP) since the early 90s, and it’s been one of his better stock picks ever since, especially considering the dividend yield is now about 20% of his cost basis along with passively increased ownership via buybacks. For investors right now, though, the game is very different.
DividendChannel DividendChannel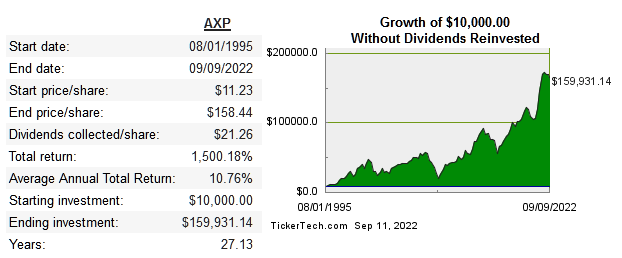
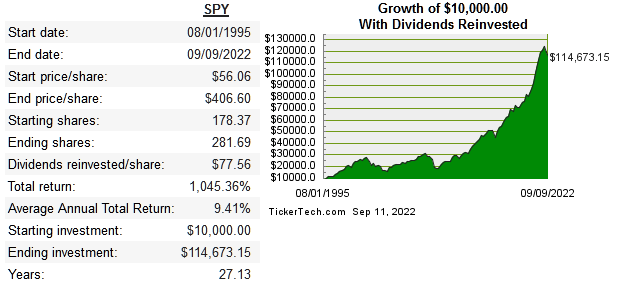
All of the payment giants have been great investments, they have everything one could look for in a long-term compounder. So, even buying all of these stocks in the industry and holding on for many years would have been a home run for your portfolio. What about current investors looking at AXP right now?
For one thing, AXP was the only publicly traded credit card company for many decades. Visa (V), Mastercard (MA), and Discover (DFS) all IPOd fairly recently, in 2008 and 2006, respectively. Since that time, AXP did beat the market slightly but didn’t keep up with competitors.
StockCharts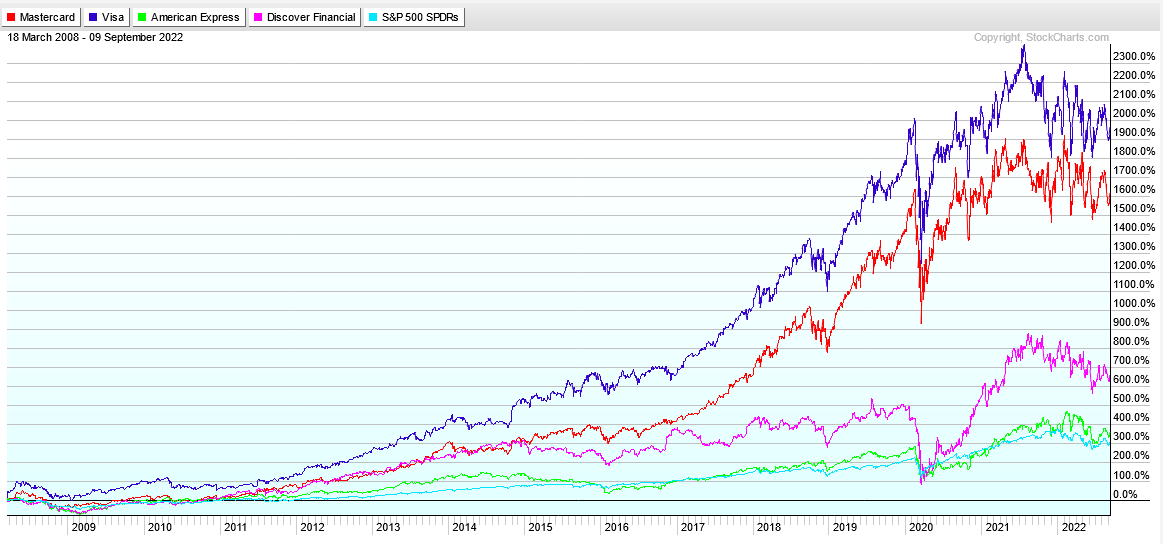
AXP is also a different kind of brand, and although they technically compete with V, MA, and DFS, they also are more niche.
AXP has long held a reputation for being the card for wealthier people, but they’ve made efforts to appeal to a broader audience. Known for being the only credit card that required at least $500 a year fee to own, they offer several zero-fee cards, and like their competitors, they now provide BNPL services as well.
Below are the return metrics for AXP and peers:
|
Company |
Median 10-Year ROE |
Median 10-Year ROIC |
10-Year EPS CAGR |
10-Year FCF/Share CAGR |
Capital Intensity Ratio |
|
AXP |
27% |
8.1% |
10% |
14.9% |
4.3 |
|
V |
21.3% |
29.7% |
15.9% |
19.5% |
3.4 |
|
MA |
69.4% |
43% |
19.5% |
15.5% |
1.9 |
|
DFS |
22.6% |
8.7% |
16.3% |
14.3% |
9.1 |
Capital Allocation
How management allocates capital is extremely important for a company like this. They all face the issue of maintaining higher returns on each incremental dollar of invested capital. This means shareholder yield is an important driver for shareholder returns going forward.
Below, we compare payout ratio, share count, d/e, and cash balance to assess how capital is being allocated:
|
Company |
Median 10-Year Aug Payout Ratio* |
10-Year Share Count Change |
Debt/Equity |
Current Cash(bil) |
|
AXP |
56.7% |
-32% |
1.8 |
26.2 |
|
V |
90% |
-41.% |
0.5 |
17.3 |
|
MA |
104.5% |
-21.6% |
0.9 |
21.6 |
|
DFS |
52.9% |
-43.% |
1.5 |
11.4 |
*Dividends and buybacks/FCF (Source: roic.ai)
We can see that all have meaningfully reduced share count and have plenty of cash on hand. The overall payout ratio shows that the companies with the highest returns on capital end up returning most of FCF, since incremental returns would no doubt be lower. None of these businesses can simply plow money into investments that will drive topline growth continually and significantly. Reinvestment for companies in these sectors is more complicated than companies such as CMG or COST, which simply want to open more stores to get growth.
Risk
AXP enjoys oligopoly status, so the risk of simply being overtaken and losing massive market share is nil. The biggest risk to AXP is the same one that its competitors face, which is long-term disruption by younger fintech and DeFi companies. The scope of this article is not to project exactly which company will be the most disruptive or what that will precisely look like. The point here is to compare as an investment in AXP to its peers.
Valuation
Judging by the multiples comp below, the market seems to be accurately rewarding V and MA for being highly capital efficient in comparison. I don’t see AXP’s multiples suggesting any real discount.
|
Company |
EV/Sales |
EV/EBITDA |
EV/FCF |
P/B |
Div Yield |
|
AXP |
3 |
9.7 |
10.2 |
5.1 |
1.3% |
|
V |
15.2 |
21.6 |
26.5 |
11.9 |
0.7% |
|
MA |
15.9 |
26.5 |
34.9 |
51.8 |
0.6% |
|
DFS |
2.8 |
3.9 |
5.8 |
2 |
2.3% |
(Source: quickfs.net)
Below is a DCF model for AXP:
Moneychimp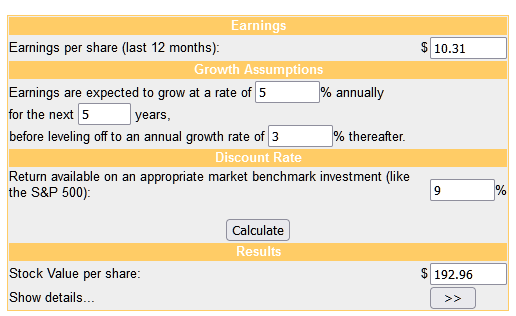
This shows undervaluation compared to the current share price, but this doesn’t tell the whole story. MA and V are still far superior at earning higher returns on capital. This has already been reflected in shareholder returns as shown in the earlier performance chart, so I would rather focus on those two stocks as long-term holdings, even though they both regularly trade at higher multiples than AXP and DFS.
Conclusion
The payments industry may face disruption over time, but long-term shareholders have been rewarded thus far for owning these stocks. AXP is more prone to cyclical moves since it will perform its best when the US economy is its best. They won’t lose their position to competitors anytime soon, but it simply doesn’t have the strong capital efficiency like MA and V to outperform them in the long run. MA and V deserve higher multiples due to this, so AXP is not discounted as far as pricing. My DCF does show undervaluation, but long-term shareholder returns from here will still likely be better with MA and V, as they were in the past. We all know the past results don’t guarantee a repeat in the future, but AXP’s returns on capital haven’t been above average in a while, whereas their competitors defy the average and take better advantage of their oligopoly status which provides a very wide mode as far as new entrants in this specific industry.
Be the first to comment