

Scott Olson/Getty Images News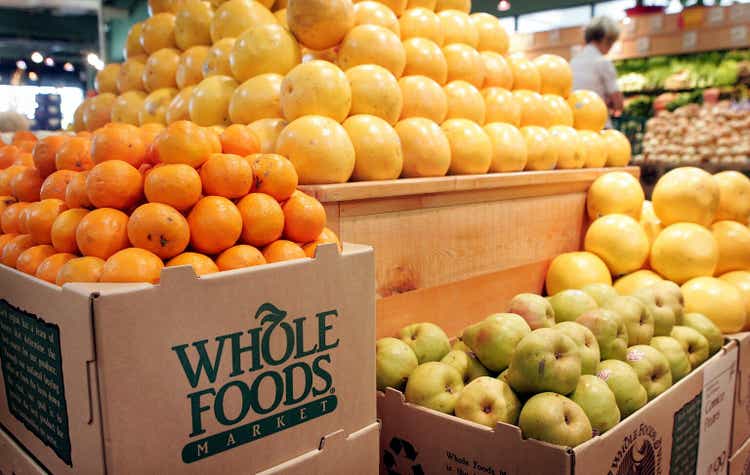
Thesis
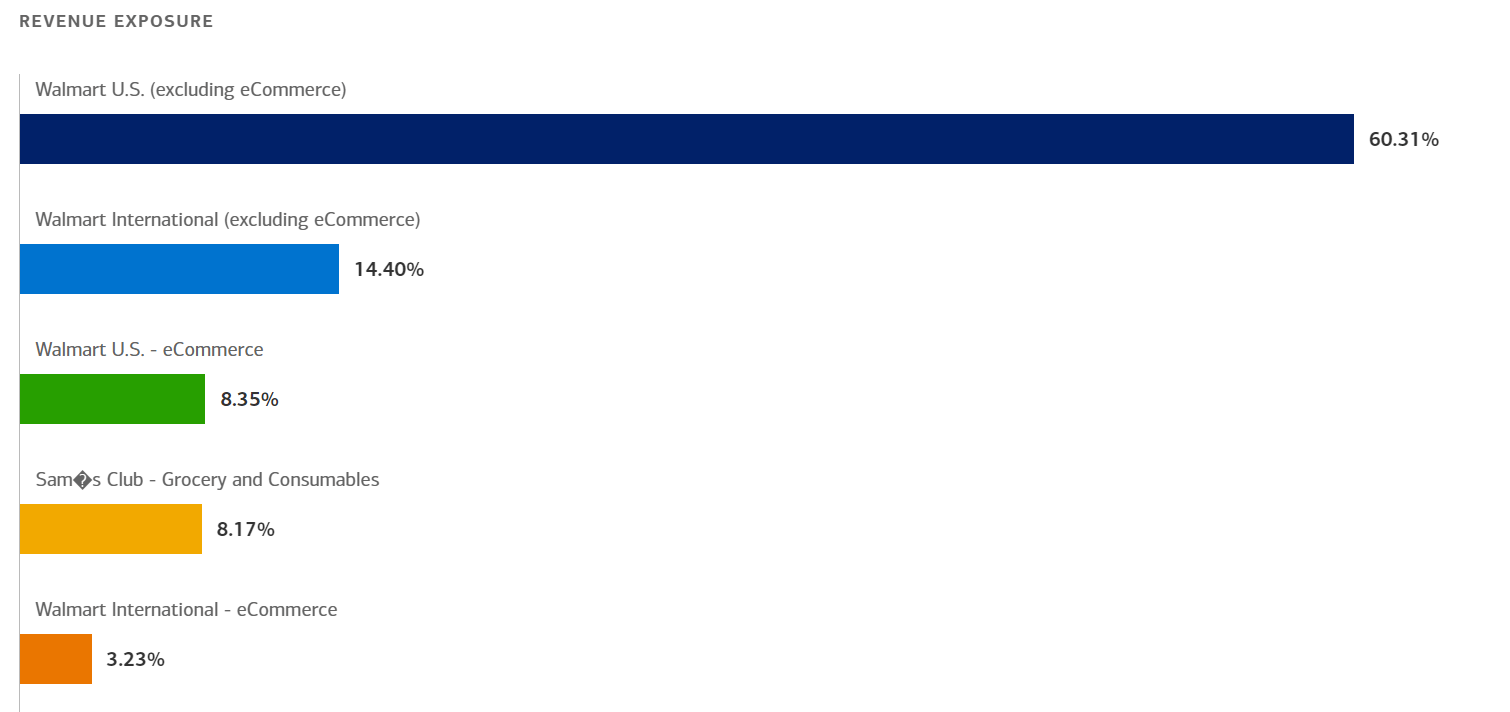
First, I am fully aware that Amazon.com, Inc. (NASDAQ:AMZN) and Walmart Inc. (NYSE:WMT) are not identical and there are crucial differences. Details of these differences are explained in my earlier article. As seen from the two charts below, AMZN’s second- and third-largest revenue sources are third-party seller services (22%) and AWS (13.2%). And WMT does not directly overlap with either.
After all, no two businesses are exactly identical. However, a key to investment analysis lies in comparing and contrasting similar, but not identical, businesses. And I feel there are more similarities than differences between AMZN and WMT. First, the bulk of AMZN revenues come from Online Stores (more than 47%), which makes it very comparable to WMT. Behind online stores are a vast network of warehouses, suppliers, distribution centers, et al, just like WMT. Second, no big corporation stays in its own corner these days. As competition intensifies, they tend to encroach on each other’s turf more and more. WMT has been actively developing its eCommerce business. Its eCommerce now contributes 8.35% of its total revenues in the U.S. and 3.23% internationally, a still minor but nonnegligible part. While AMZN has been actively developing its offline storefronts. And the acquisition of Whole Foods in August 2017 was the largest acquisition in its history, which was also perceived as the most important for Amazon to expand its offline business.
Source: Merrill Edge. AMZN revenue exposure Source: Merrill Edge. AMZN revenue exposure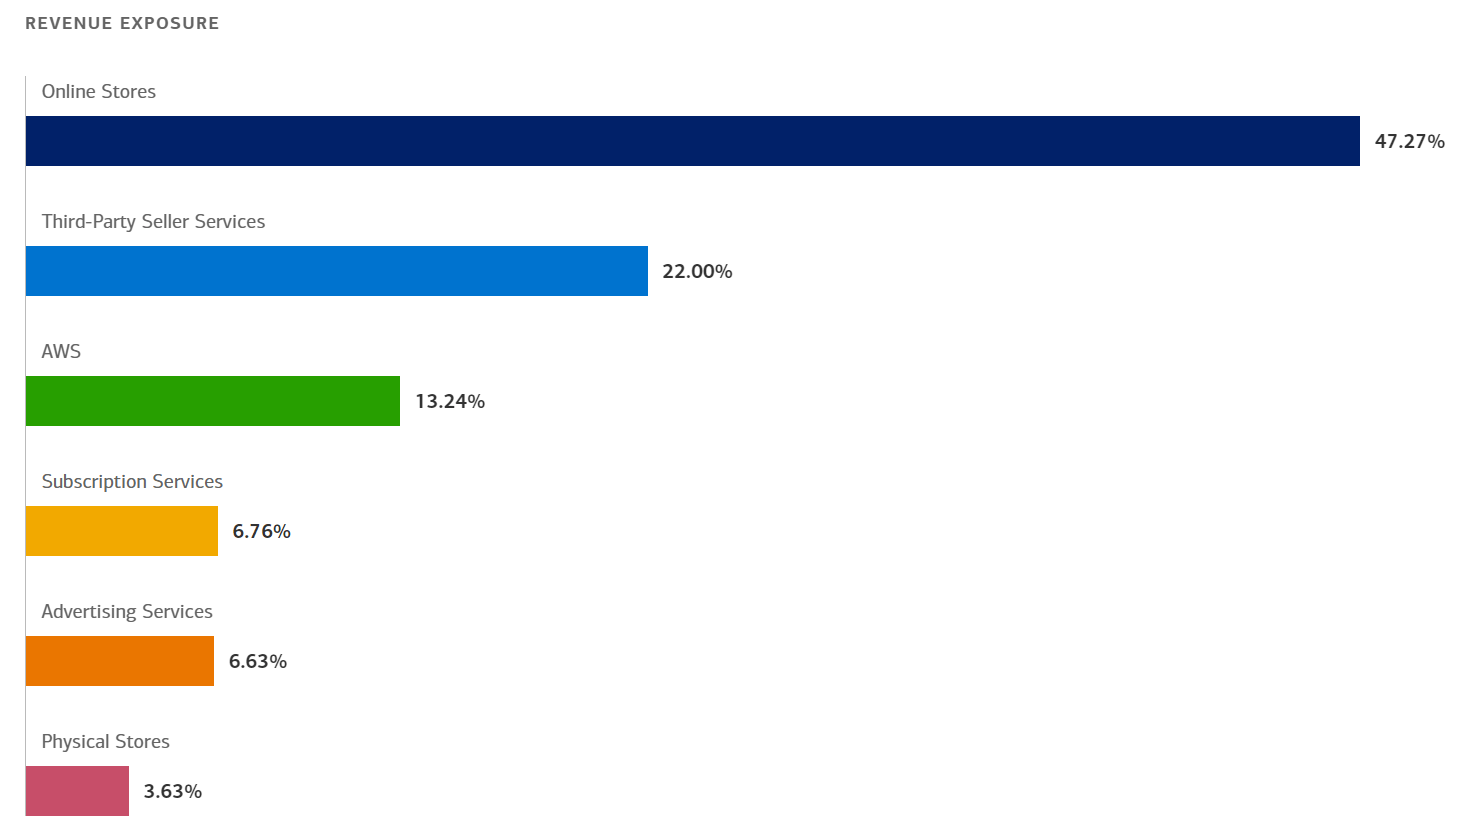
And this leads me to the thesis for today. By reviewing the journey of the Whole Foods integration over the past 5 years, my conclusion is that Amazon’s offline attempt isn’t as successful as Walmart’s online attempt. In the end, moving physical stuff turns out to be still harder than moving bits and bytes. At the same time, Amazon’s negative free cash flow (“FCF”) persists and is very likely to deteriorate due to record inflation and high fuel costs. Combined with its intensive capital requirement and current valuation, such a deterioration could choke capital allocation flexibility and trigger an even larger price correction.
In contrast, I see WMT in a much better position to weather the uncertainties ahead. It features an inflation-resistant sales mix, is better shielded from fuel cost (it’s a top gasoline retailer itself), and enjoys a stably positive cash flow and also lower capital requirement at the same time. At its current valuation, even a modest growth rate can deliver solid shareholder returns of nearly 10%, as to be detailed next.
The Whole Foods hype and current status
The market had good reasons to be excited by the Whole Foods acquisition. It offered good synergistic opportunities and a testbed for AMZN to try offline strategies. A few specific examples:
- Amazon had its own fresh food business before the acquisition already, Amazon Fresh. And the acquisition seemed to be a good next step in expansion.
- The Whole Foods-Amazon partnership could enable more technological innovations too. Indeed, in the past five years, Amazon has continuously tried its new technologies with Whole Foods stores to bring new offline shopping experiences to consumers These technologies included Amazon Go, Amazon Fresh, Just Walk out, and Amazon One.
However, the results are at best tepid in my view. Amazon Fresh and Whole Foods did not consolidate afterward, and each still maintained its own warehousing and delivery facilities because they have different customer basis. According to a Placer.ai traffic survey in March 2022, Whole Foods’ online traffic is now at the same level as it was before the 2017 acquisition. In May, Whole Foods also announced the closure of six underperforming stores for the first time since 2017. Whole Foods’ market share in U.S. fresh food sales is now just 1 percent, according to market research firm Numerator. By comparison, WMT has a 19 percent U.S. market share, followed by Kroger’s 9 percent.
Looking forward, I am seeing more headwinds for AMZN (and WMT too, but unevenly), as to be elaborated on next.
Inflation and fuel costs
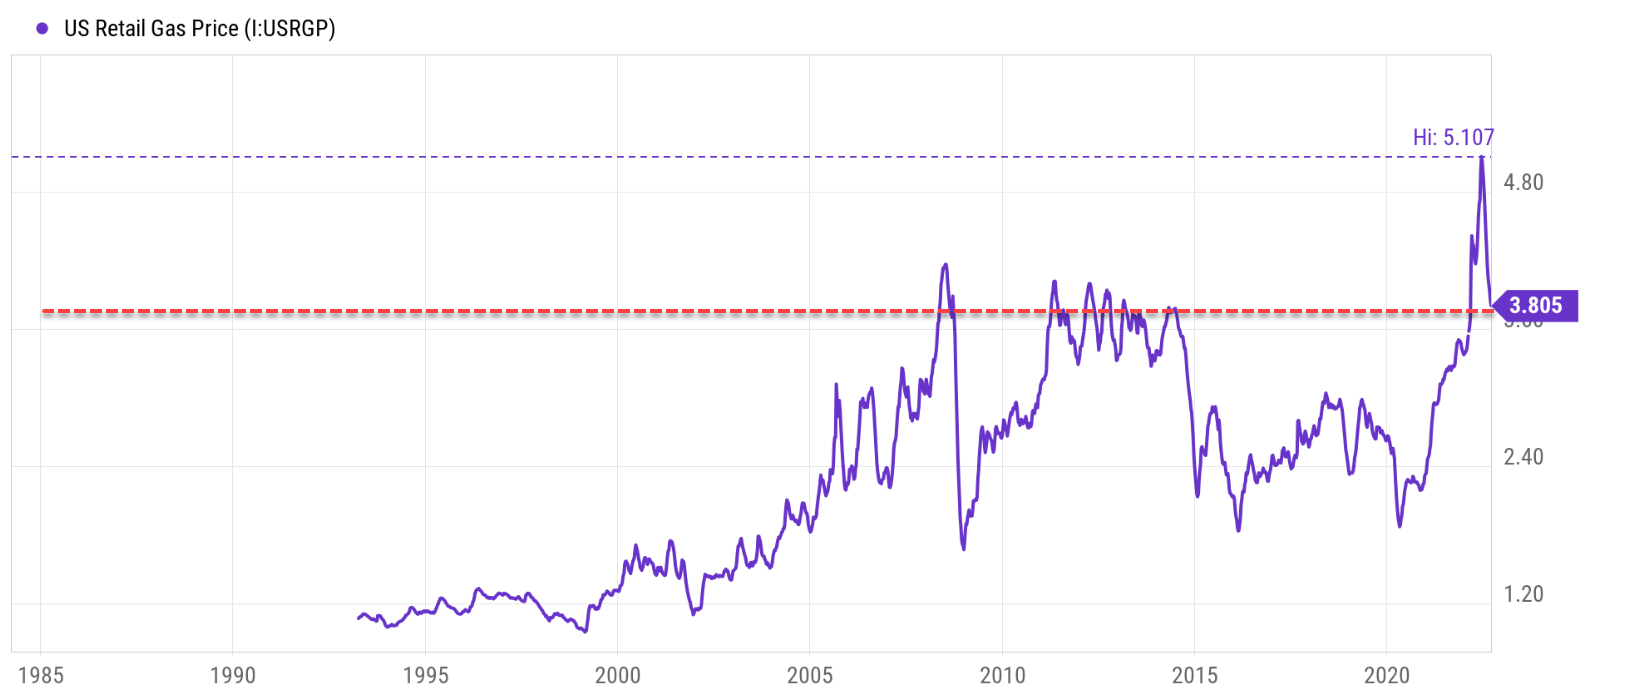
The Bureau of Labor Statistics just released the inflation data for August. CPI rose 0.1% to 8.3% year-on-year, among the highest level in about 4 decades. More importantly, the prices of fuel increased the most (followed by food) as seen from the chart below. These two items are indispensable necessities of life and impact the majority of people the most. According to Ycharts data shown in the second chart below, the national average price per gallon of unleaded gasoline is $3.80 currently, about 25% lower than the recent peak of $5.1, but still among the highest level in the long term.
Source: Bureau of Labor Statistics Source: Seeking Alpha data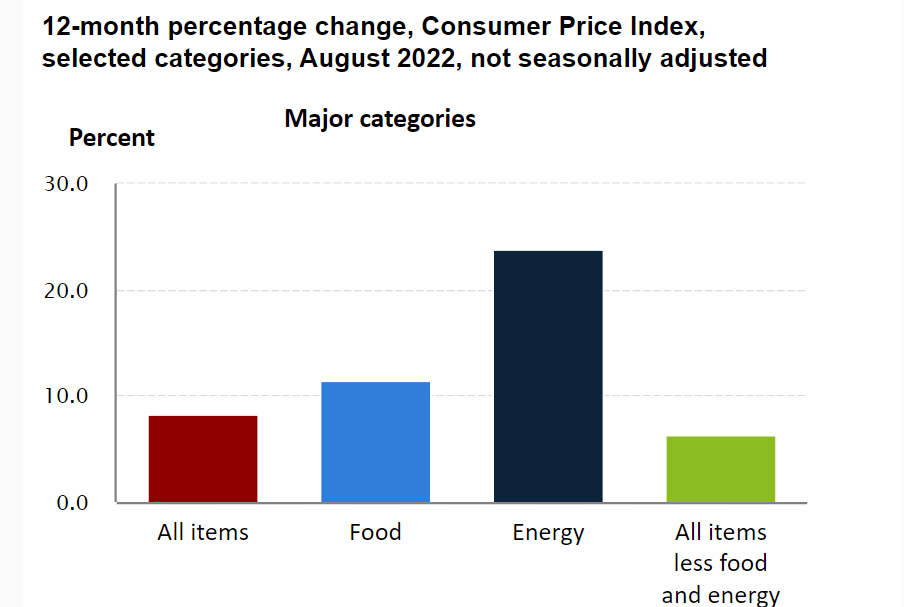
High inflation and fuel cost have been impacting and will continue to impact both AMZN and WMT negatively. They will be hurt twice, not once, actually, as argued in an earlier article:
First, people simply have less money to spend on anything else (such as shopping at WMT or AMZN) when they have to spend more money on life necessities such as fuel and food. Moody’s senior economist Ryan Sweet estimated that, based on the inflation data released by the Bureau of Labor Statistics last week, the average US household spending in May to what would have been spent in 2018 and 2019, the inflation has caused about $460 of extra living expenses per month for an average household. And both WMT and AMZN will suffer a large share such belt-tightening.
Second, both of them are facing higher costs themselves. For example, both rely on extensive distribution and delivery systems to run their businesses, and they will face much higher transportation costs and see margins pressured as a result. Walmart CEO Doug McMillon commented at multiple places during the earnings call on inflation’s toll on both its top and bottom line, citing surges in fuel, container, storage, and other costs. These comments apply to AMZN equally well.
But the pain will be unequally distributed
The key thesis here is that WMT and AMZN will be hurt unequally. And WMT will be hurt less than AMZN.
Firstly, WMT’s sales composition makes it more inflation-resistant than AMZN. In 2022, WMT is still largely a grocery store (and by far the largest one). Its grocery sales accounted for 55.7 percent of its net sales in the U.S. In contrast, AMZN mostly carries discretionary items. AMZN does not disclose its sales composition by category. However, based on its Whole Foods grocery stores, we can gather a reasonably accurate picture. Its Whole Food grocery comprised mainly about 500 physical stores (compared to WMT’s 3,570 supercenters). In recent years, these stores raked in about $4 billion in sales per quarter, or about $50B per year. it is a tiny fraction compared to WMT’s grocery sales, and even tinier compared to AMZN’s ~$600B annual sales (less than 1%).
Statista, Walmart U.S. sales share by product category 2022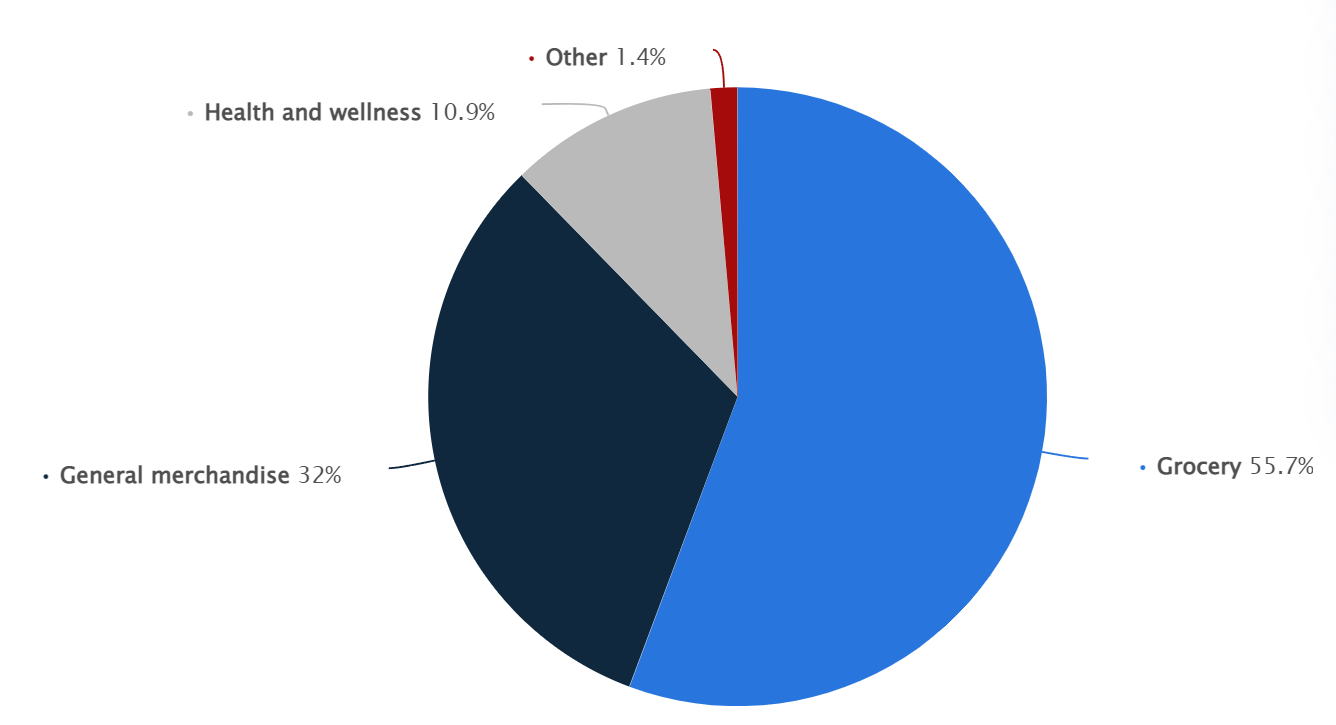
Second, WMT’s transport cost is less sensitive to high fuel prices due to the geographical groupings of its stores. The following Reuters report analyzed these advantages by comparison against Target (TGT), but these arguments are valid when compared to Amazon also. The following quotes are taken from the report (abridged and emphases added by me):
High oil prices … impose extra costs everywhere, but the impact varies wildly by state. Walmart stores are concentrated in states where gas and diesel prices are below the national average, like Texas and Florida, while Target stores skew toward high-cost states like California and New York. The geographical groupings of Walmart and Target stores reflect the distinct strategy of each company for going after a certain type of customer. Walmart has found its success with lower-income customers and those that can drive to its stores, versus Target who wants the affluent customer.
Third, WMT itself is one of the largest gasoline distributors in the country and can benefit from rising gasoline prices. It is a hedge that AMZN does not have. Furthermore, gasoline distribution also creates a higher-order benefit that AMZN dost not have. Higher gas prices better funnel consumers to WMT than AMZN, further exacerbating AMZN’s struggles with its offline segments.
AMZN’s cashflow and CAPEX problem
Another reason that WMT and AMZN will be hurt unequally is that AMZN already has a cash flow problem at hand without the high inflation and extra fuel cost. I see its cash problem to be further exacerbated by inflation and fuel cost.
To be clear, both WMT and AMZN are having their share of difficulties with free cash flow in recent quarters given the macroeconomic headwinds. As you can see from the top panel of the following chart, WMT’s free cash flow per share peaked near $9.06 in 2021 and it since has declined to the current level of $1.95 per share. Amazon showed the same pattern. It’s just the deterioration is much worse. Its free cash declined from a positive level (a modest ~$2.6 per share) to the current NEGATIVE level of $2.9 per share.
Source: Seeking Alpha data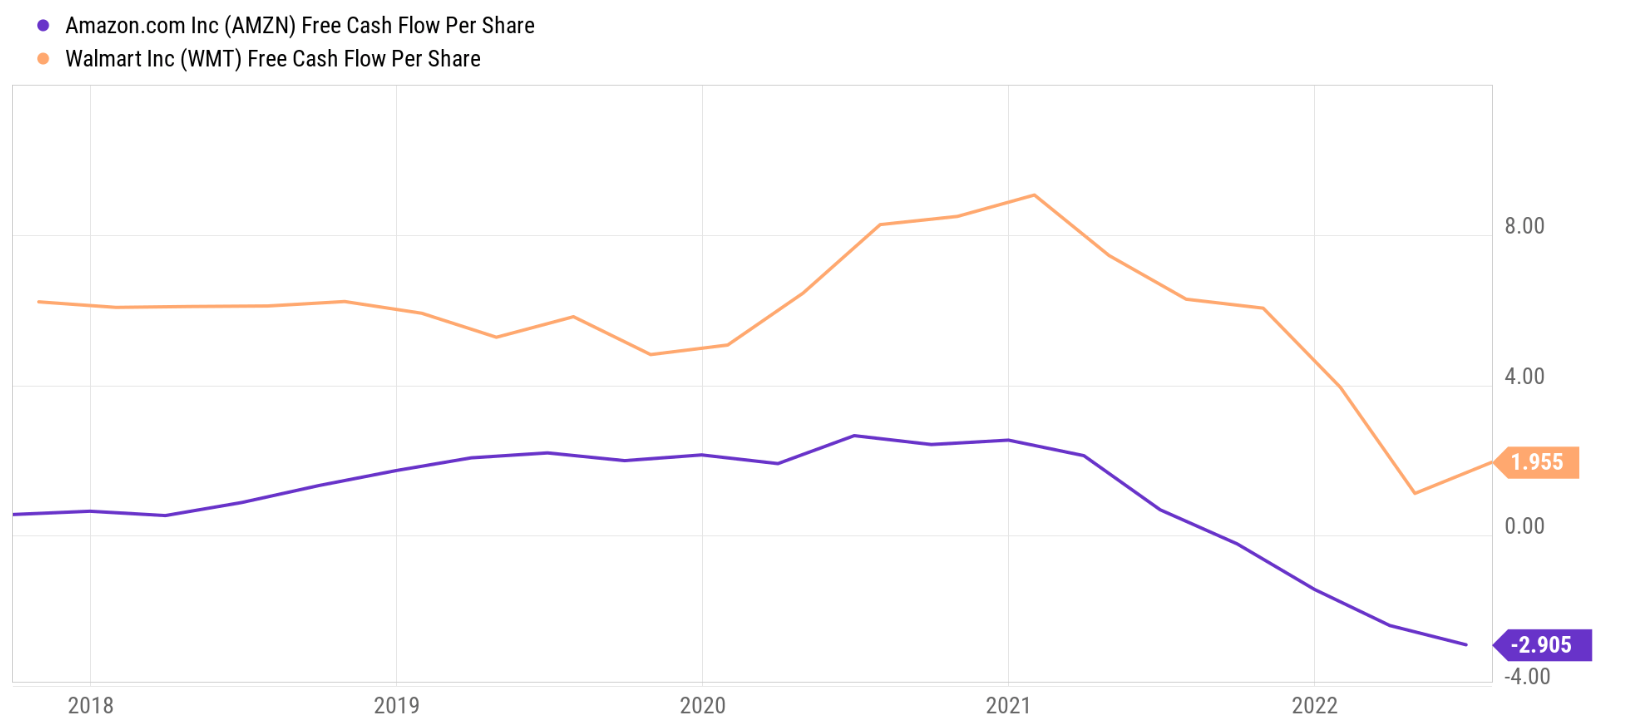
In AMZN’s case, its free cash flow problem is worse than the above picture shows because of its sizable financial lease obligations. Details on the lease obligations are provided in my earlier analysis. As you can see from the following chart, after adjusting for its lease obligations, its cash flow problem is even more concerning than on the surface. It has been a positive $16.8B back in Q1 2021 and turned to cash flow neutral around Q2~Q3 2021. But it kept deteriorating from there. It was negative $22.3B in Q1 2022 and worsened to $26B in the past quarter. A negative FCF of more than $26B is sizable even for a juggernaut like AMZN, especially when its AWS growth requires heavy capital investments as seen in the next chart.
AMZN 2022 Q2 ER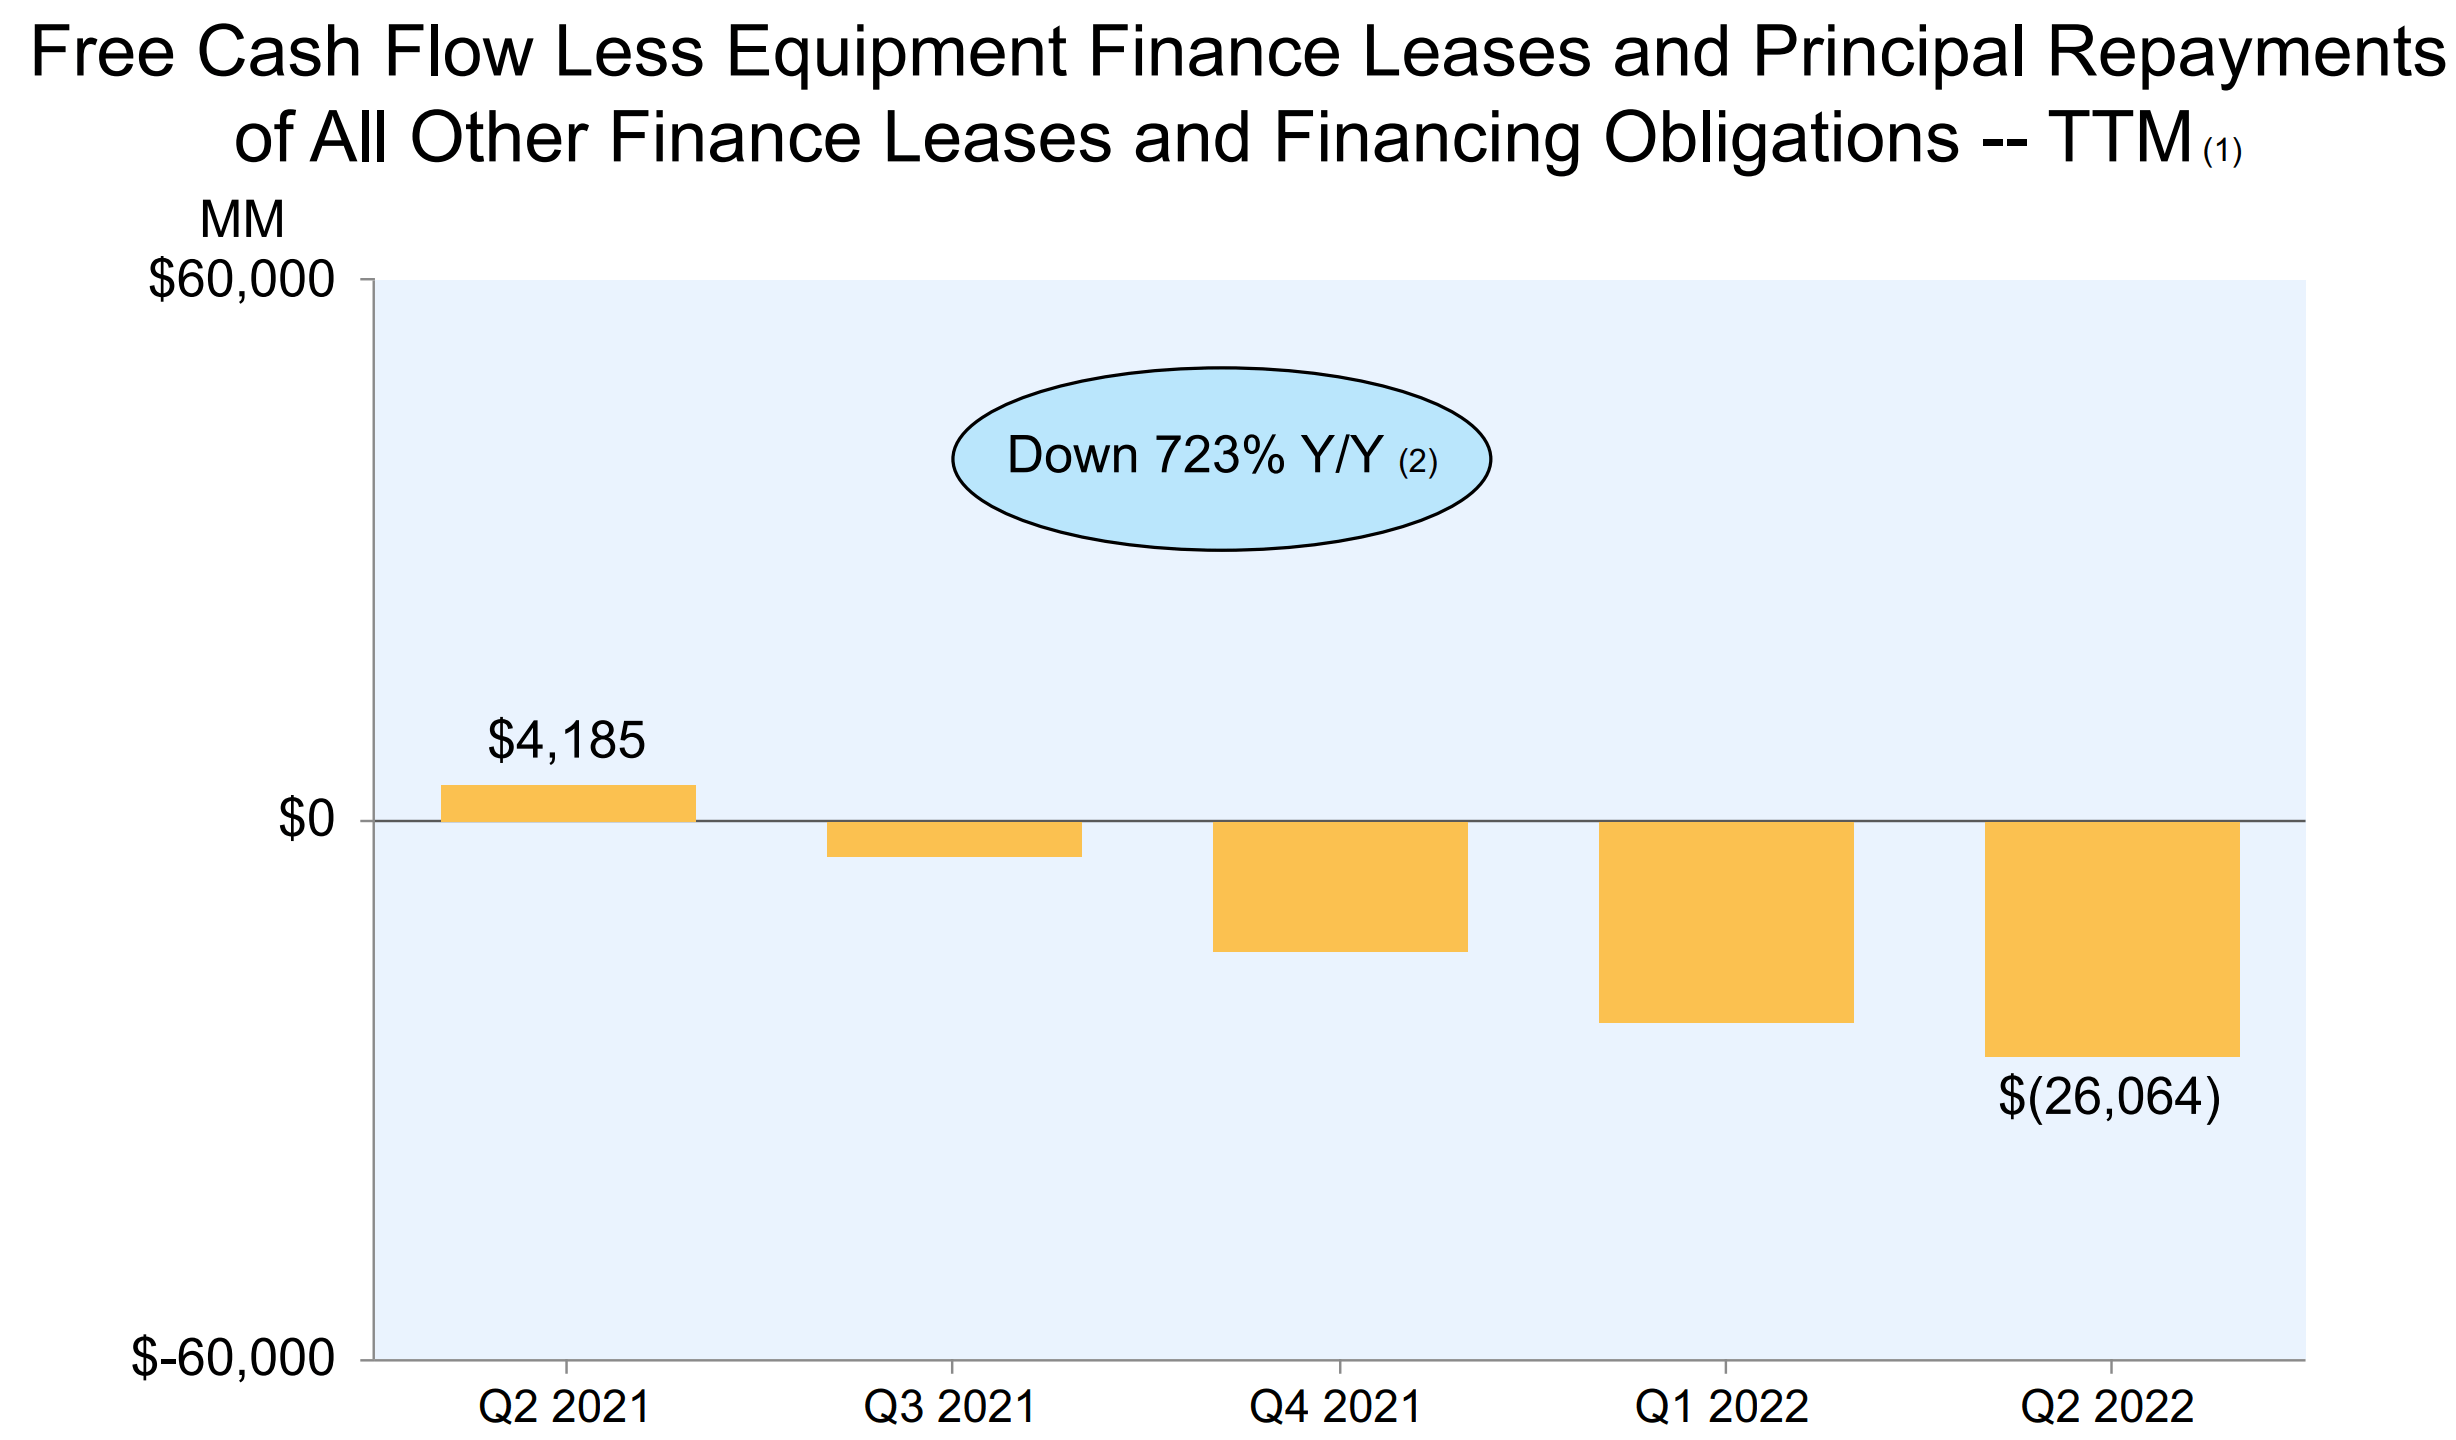
Despite its negative cash flow, AMZN requires much higher capital expenditures than WMT. For example, in the most recent quarter, AMZN spent more than $15.7 billion on CAPEX expenses, in contrast to $3.95 billion from Walmart.
Of course, comparing the numbers in absolute terms only paints a partial picture given the different sizes of the two businesses. So, the next chart compares their total depreciation and amortization as a percentage of the revenues. And here if we use the total depreciation and amortization (“DA”) as an approximation for their maintenance CAPEX expenses, then you can see that AMZN requires a much higher maintenance CAPEX in relative terms too. To wit, the total DA AMZN has fluctuated in the past five years between 3.1% and 8.2% of its total revenue with an average of 6.3%. In contrast, WMT’s DA as a percent of total revenues fluctuated in the past five years between a much narrower range of 1.7% and 2.2% with an average of only 2%, less than 1/3 of AMZN maintenance CAPEX requirements.
Source: Seeking Alpha data
AMZN vs. WMT: Stock Valuation
Due to the negative cash flow problem mentioned above, valuation metrics in terms of bottom lines are not really meaningful for AMZN. As you can see from the following table, its GAAP FW P/E is quoted at about 114.07x, and its price to cash flow is quoted at about 36.81x. Although these metrics are perfectly meaningful for WMT, they show a very reasonable valuation at about 26.99x TTM P/E and 17.44x cash flow. Here, in order to gauge their relative valuation, I will use a topline-oriented metric as illustrated in the next two charts.
Source: Seeking Alpha data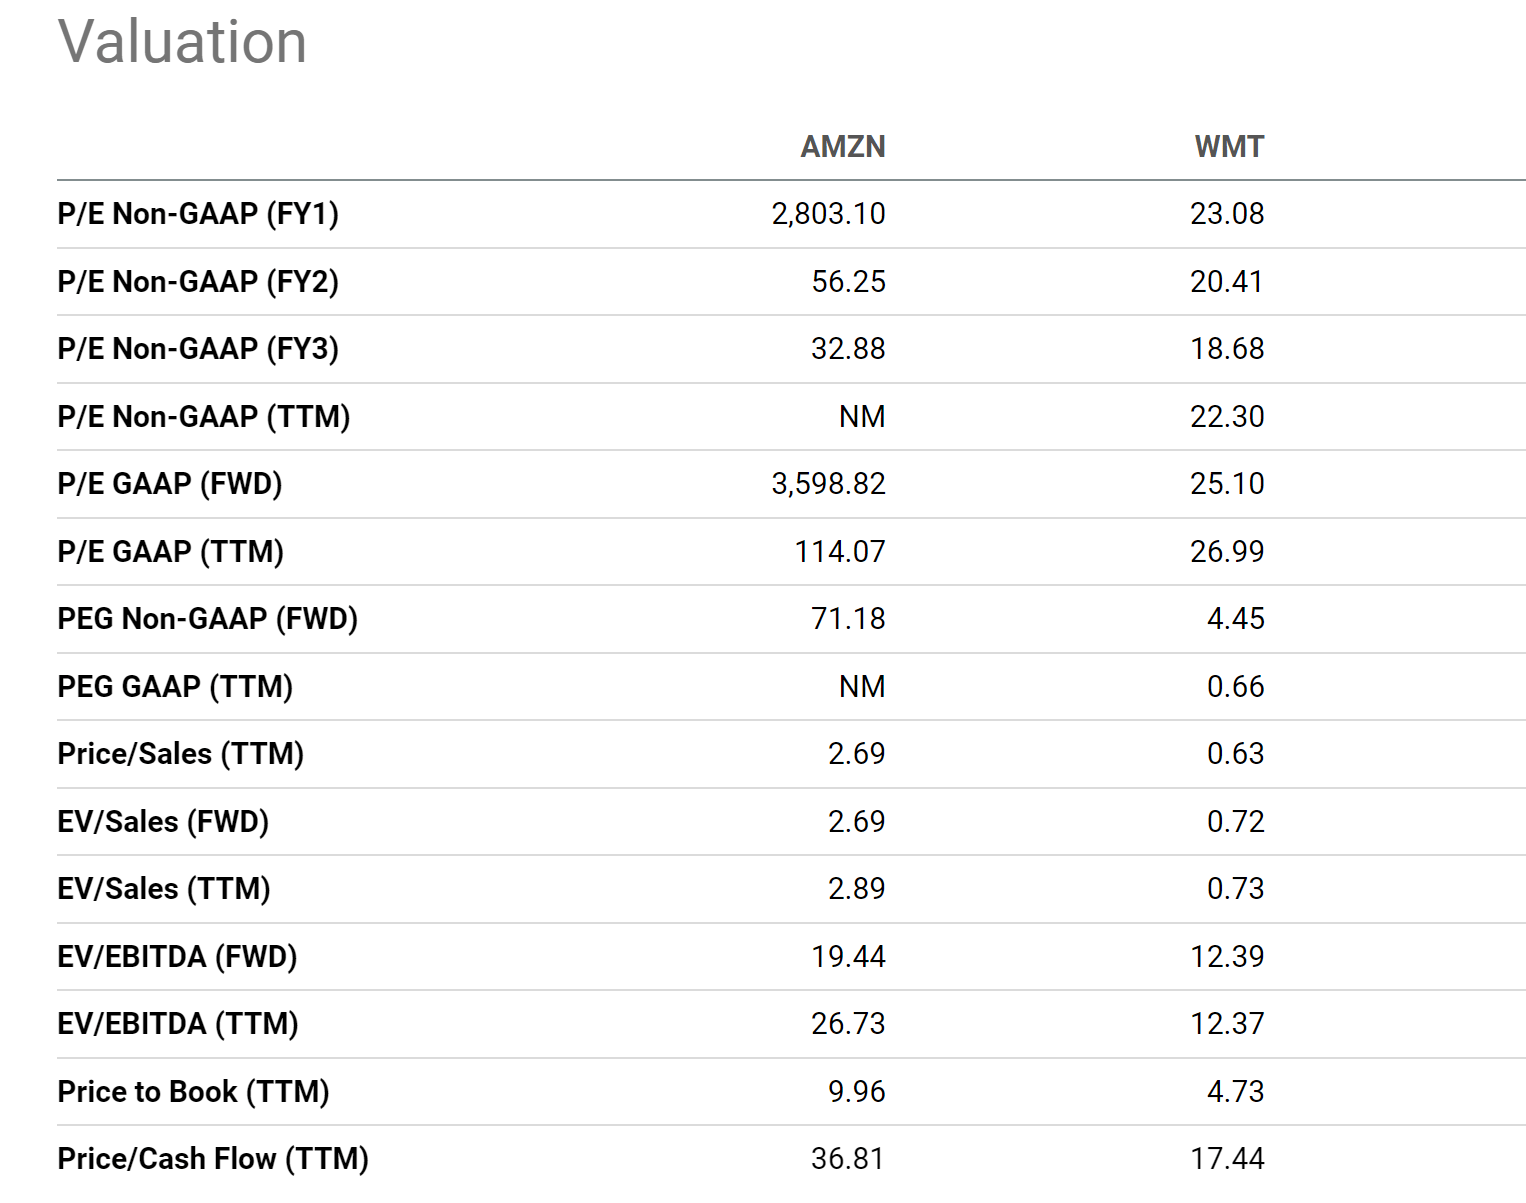
As shown in the next chart, WMT and AMZN are currently valued at a price-to-sales (“PS”) ratio of 0.625x and 2.58x, respectively. Firstly, as you can see, the recent corrections have brought both their valuations to below their historical average, which is a good sign for value investors. However, AMZN’s current PS ratio is still more than 4.1x higher than WMT.
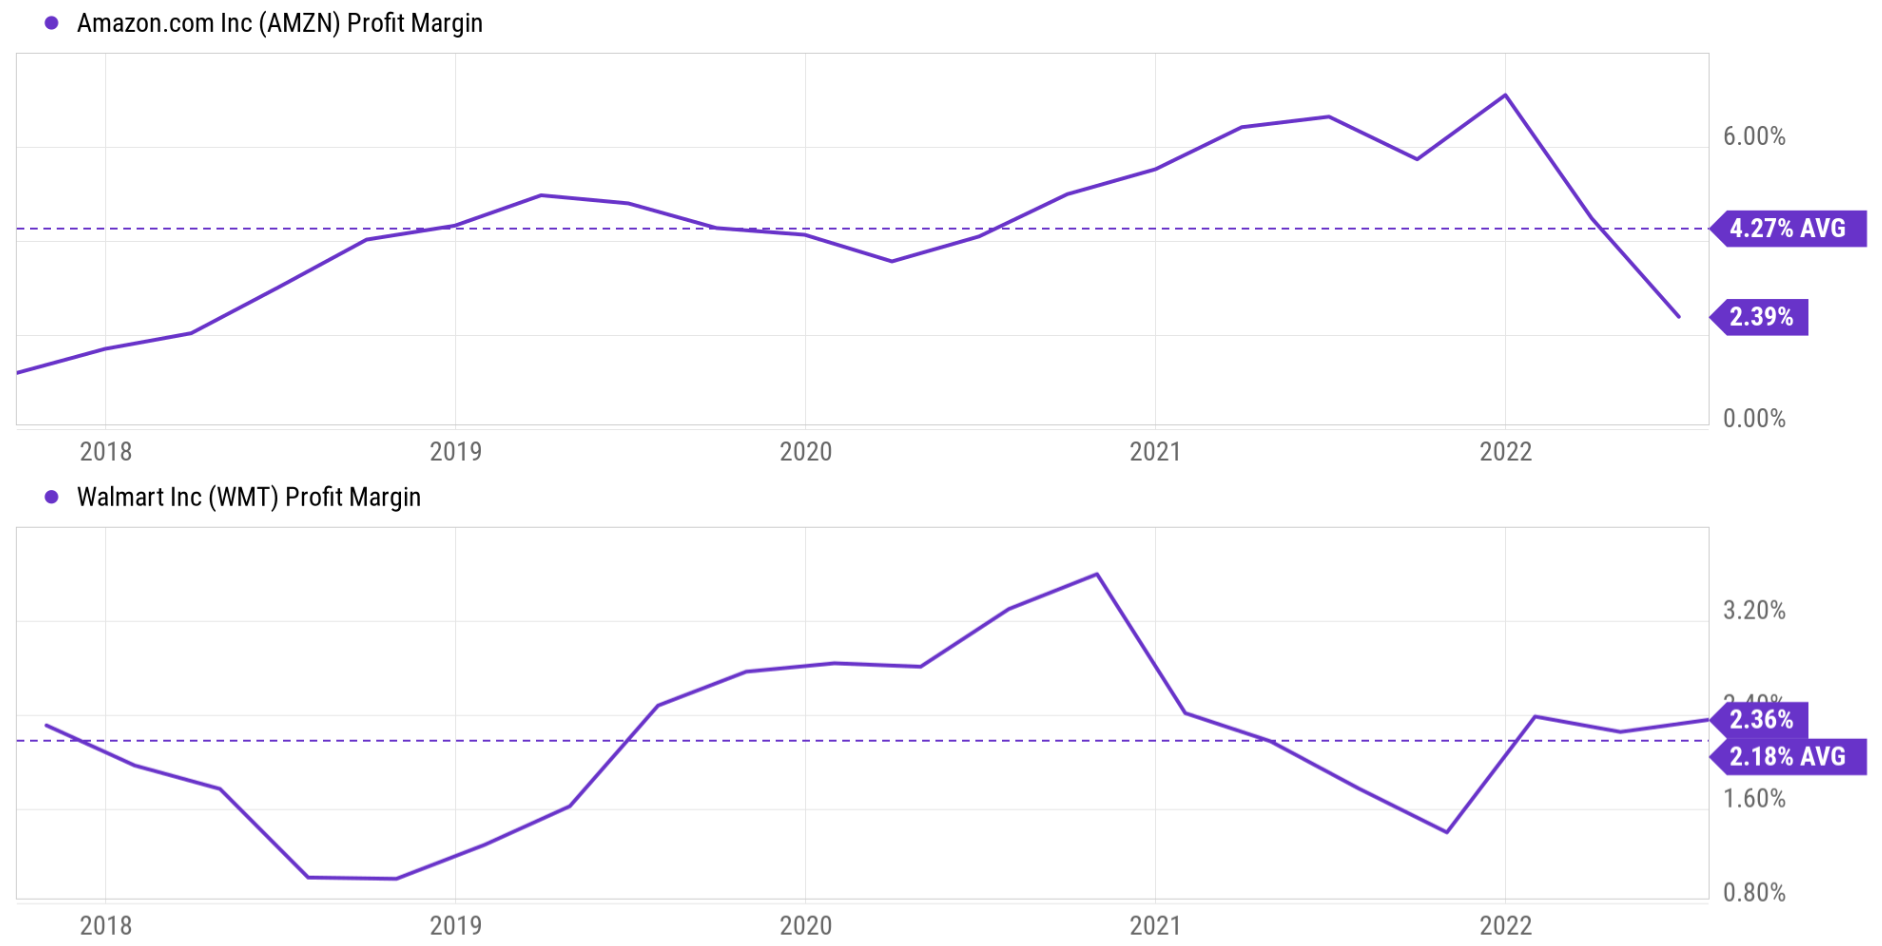
Of course, their PS ratio is exactly comparable given the margin differences. So the second chart compares their average net margins in the past five years. As can be seen, AMZN’s profit margin is indeed higher than WMT’s on average. Therefore, it is perfectly justifiable that its sales deserve a higher valuation. To wit, AMZN’s profit margin has been on average 4.27% over the past 5 years, about 2x higher (1.96x to be exact) than WMT’s 2.18% average.
We are still left with a 2x valuation premium for AMZN over WMT, which I find hard to justify for the risks mentioned above. Especially, given the asymmetric impact of inflation and fuel cost on these two businesses, I foresee WMT’s margin to be hovering around its historical average while AMZN’s profit margin is pressured more severely going forward.
Source: Seeking Alpha data Source: Seeking Alpha data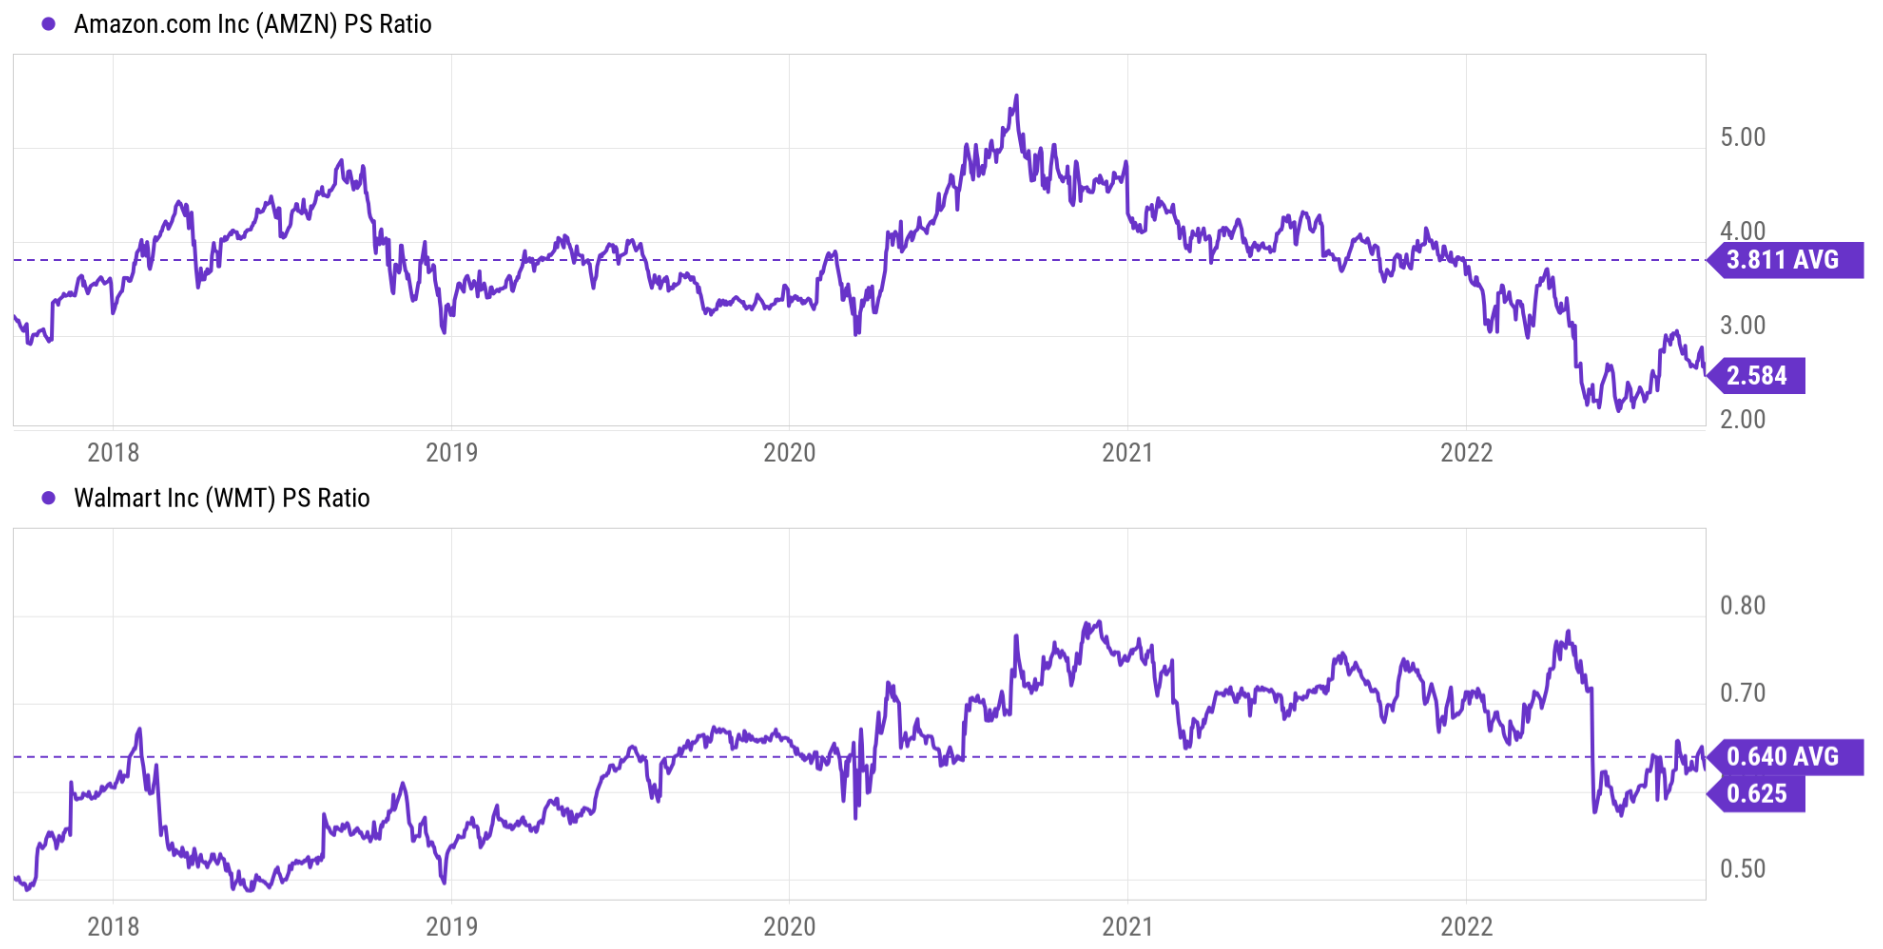
Other risks and final thoughts
Besides the risks mentioned above (inflation, fuel cost, cash flow, and capital requirements), there are a few other risks worth mentioning. The first risk is the timeframe. My thesis here is for the near-term, say next 1 to 2 years. In the longer term, I see both WMT and AMZN as excellent businesses. I just see more trouble for AMZN compared to WMT in the next 1~2 years. For WMT, it faces more competition as a physical store than AMZN as an online store. Its brick-and-mortar stores not only compete with Whole Foods (a minor competitor anyway), but also directly against other large chains both at home and abroad such as Kroger (KR), Costco (COST), and Lidl.
To reiterate, I see headwinds for both AMZN and WMT. Both are having, and will continue to have, their fair share of difficulties as inflation, high fuel prices, and an economic slowdown unfold. However, I see WMT in a much better position to weather these difficulties. I see Amazon’s offline attempt isn’t as successful as Walmart’s online attempt. Furthermore, Amazon’s cash flow problem can choke its capital allocation options, leading to a slower pace not only in its offline expansion but possibly also in its other high-growth segments such as AWS. Under these comparisons, the valuation premium that the marketplaces on AMZN seems absurd to me. And these issues could mute growth and trigger an even larger correction in AMZN stock prices.
In contrast, at WMT’s current valuation (23x FW PE), even a modest growth rate (say 5%) can deliver solid shareholder returns of nearly 10% already (consisting of about 4.4% of owners’ earning yield and 5% growth).
Be the first to comment