


Chadchai Krisadapong/iStock via Getty Images
The Chart of the Day belongs to the healthcare company Cigna (CI). I found the stock by sorting Barchart’s Top Stocks to Own list first by the most frequent number of new highs in the last month, then used the Flipchart feature to review the charts for consistent price appreciation. Since the Trend Spotter signaled a buy on 7/6 the stock gained 3.05%.
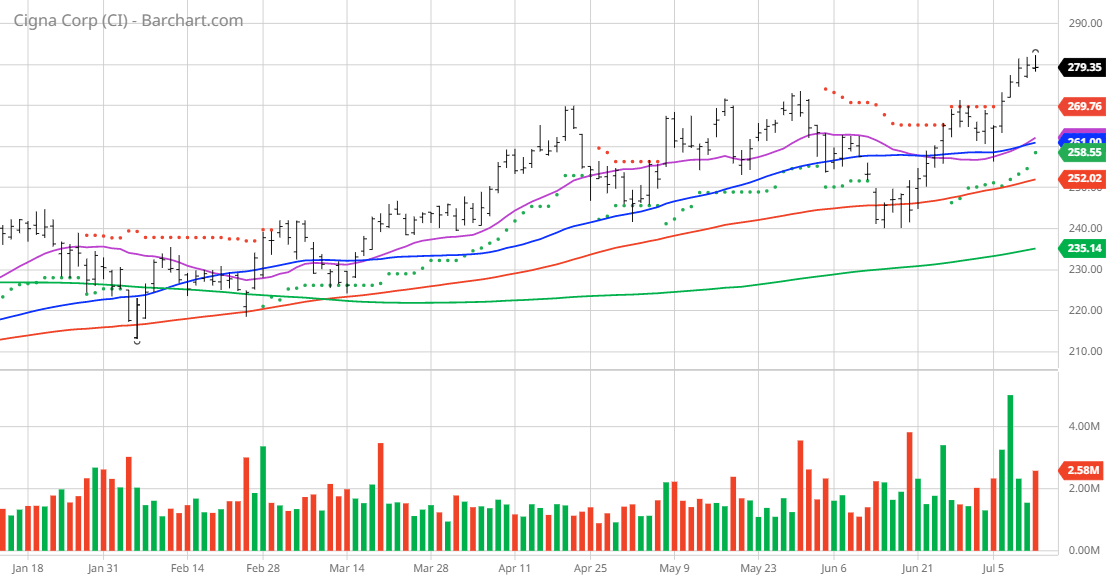
CI vs Daily Moving Averages
Cigna Corporation provides insurance and related products and services in the United States. Its Evernorth segment provides a range of coordinated and point solution health services, including pharmacy, benefits management, care delivery and management, and intelligence solutions to health plans, employers, government organizations, and health care providers. The company’s Cigna Healthcare segment offers medical, pharmacy, behavioral health, dental, vision, health advocacy programs, and other products and services for insured and self-insured customers; Medicare Advantage, Medicare Supplement, and Medicare Part D plans for seniors, as well as individual health insurance plans to on and off the public exchanges; and health care coverage in its international markets, as well as health care benefits for mobile individuals and employees of multinational organizations. The company also offers permanent insurance contracts sold to corporations to provide coverage on the lives of certain employees for financing employer-paid future benefit obligations. It distributes its products and services through insurance brokers and consultants; directly to employers, unions and other groups, or individuals; and private and public exchanges. The company was founded in 1792 and is headquartered in Bloomfield, Connecticut.
Barchart’s Opinion Trading systems are listed below. Please note that the Barchart Opinion indicators are updated live during the session every 20 minutes and can therefore change during the day as the market fluctuates. The indicator numbers shown below therefore may not match what you see live on the Barchart.com website when you read this report.
Barchart Technical Indicators:
- 100% technical buy signals but increasing
- 27.39+ Weighted Alpha
- 18.76% gain in the last year
- Trend Spotter buy signal
- Above its 20, 50 and 100 day moving averages
- 13 new highs and up 10.29% in the last month
- Relative Strength Index 65.63%
- Technical support level at $277.70
- Recently traded at $279.35 with 50-day moving average of $261.00
Fundamental factors:
- Market Cap $88.81 billion
- P/E 12.84
- Dividend yield 1.60%
- Revenue expected to grow 2.60% this year and another 4.80% next year
- Earnings estimated increase 11.00% this year, an additional 11.10% next year and to continue to compound at an annual rate of 11.45% for the next 5 years
Analysts and Investor Sentiment – I don’t buy stocks because everyone else is buying but I do realize that if major firms and investors are dumping a stock it’s hard to make money swimming against the tide:
- Wall Street analysts have 10 strong buy, 5 buy and 9 hold opinions on the stock
- Analysts give an average price target at $296.09 with some analysts predicting as high as $330.00
- The individual investors following the stock on Motley Fool voted 374 to 44 for the stock to beat the market with the more experienced investors voting 86 to 4 for the same result
- 31,710 investors are monitoring the stock on Seeking Alpha
Ratings Summary
Factor Grades
Quant Ranking
Sector
Industry
Ranked Overall
Ranked in Sector
Ranked in Industry
Quant ratings beat the market »
Dividend Grades
Be the first to comment