


ismagilov
Written by Nick Ackerman, co-produced by Stanford Chemist. This article was originally published to members of the CEF/ETF Income Laboratory on September 13th, 2022.
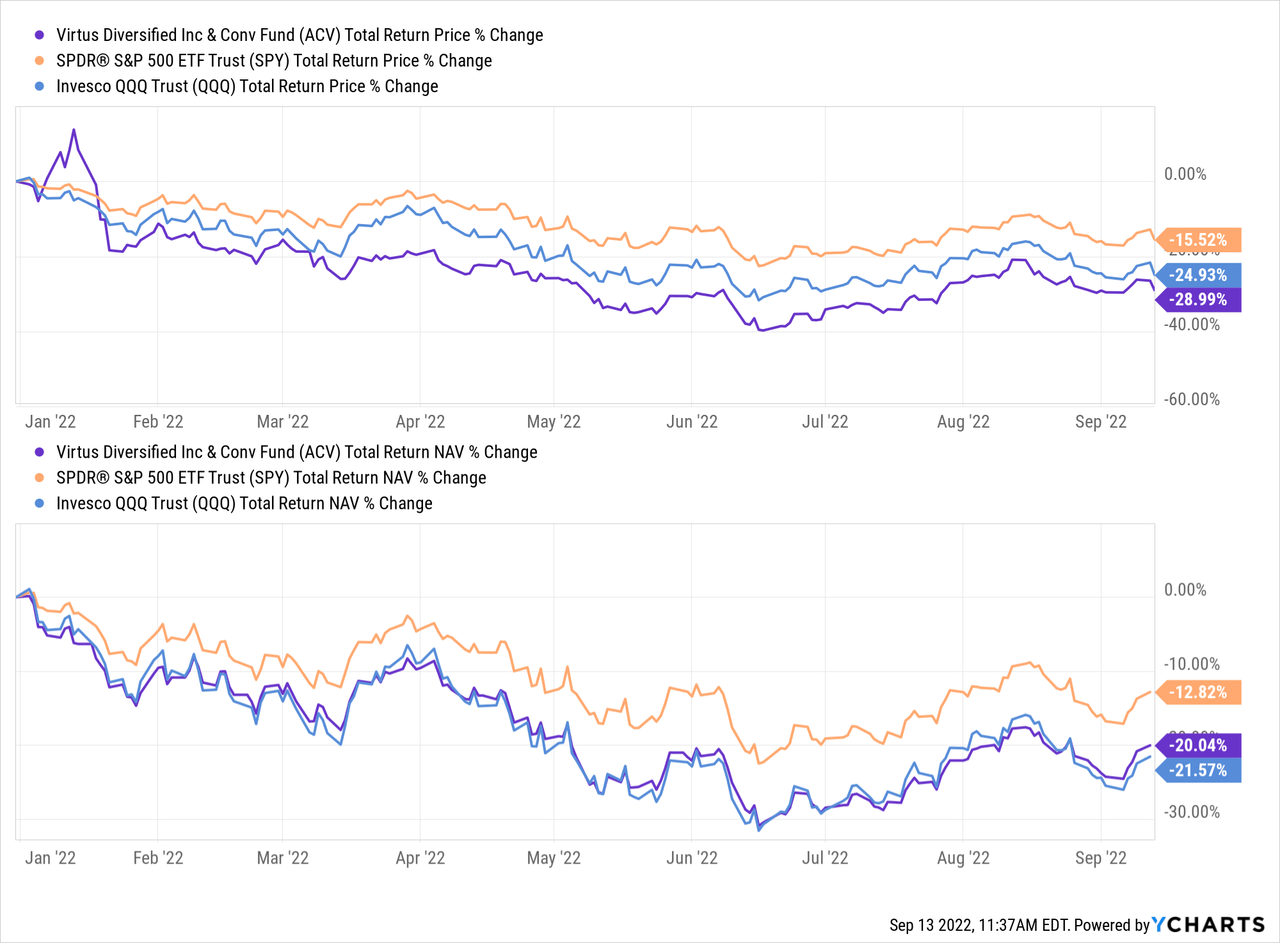
Since the last update on Virtus Diversified Income & Convertible Fund (NYSE:NYSE:ACV), the fund has provided some relatively attractive returns. I had remarked that the fund’s discount had become quite attractive on top of declining prices in the underlying portfolio. That has helped propel the fund higher to provide a return outpacing the S&P 500.
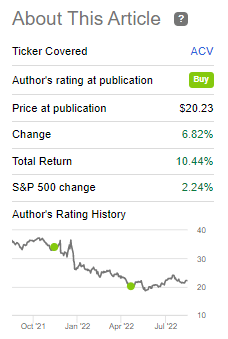
ACV Performance Since Previous Update (Seeking Alpha)
Additionally, since that previous update, the fund’s name has dropped the “Allianz” part due to the subadvisor changing, as we noted previously. Now, we know the fund’s new management team is, well, the same as the old one, but their paychecks will have Voya stamped on top. The new subadvisory agreement will be voted on by shareholders on September 27th, 2022. That being said, Voya is already listed as the investment partner on the fund’s website.
This all stemmed from fraud in an unrelated fund with Allianz, which doesn’t change anything fundamentally for ACV. There is a bit of an exception here; investors tend to have a more sour view of Voya’s other closed-end funds. If enough investors feel that way, then these old Allianz funds could see their discounts widen out based on that alone. That being said, that could simply create its own opportunities as the managers are the same, and these funds’ investment policies haven’t changed.
Today, the fund’s discount isn’t as attractive as it was when we previously looked at it. There had also been quite a run higher in the market at that time, which helped push the fund to provide that outperformance compared to the broader market that we saw in the chart above. I would still be optimistic longer-term, but the shorter-term could remain quite volatile.
The Basics Of ACV Fund
- 1-Year Z-score: -0.10
- Discount: 3.15%
- Distribution Yield: 9.75%
- Expense Ratio: 1.85%
- Leverage: 31.38%
- Managed Assets: $334.59 million
- Structure: Term (liquidation expected around May 22nd, 2030)
ACV’s investment objective is to “provide total return through a combination of current income and capital appreciation while seeking to provide downside protection against capital loss.”
To achieve this objective, they will “strive to dynamically allocate across convertibles, equities, and income-producing securities. The Fund normally invests at least 50% of total managed assets in convertibles and has the latitude to write covered-call options on the stocks held in the equity portion.
The fund’s expense ratio is on the high end. When including leverage expenses, this climbs to 2.55%. Unlike other closed-end funds, most of ACV’s leverage is through fixed-rate preferred and fixed-rate senior secured notes. There is a smaller portion allocated to borrowings that are based on LIBOR. With interest rates increasing, leverage expenses will also go higher due to this variable rate.
Since most of ACV’s leverage is fixed, we shouldn’t consider this too much of a concern. At least how it could be negatively impacted on the higher expenses front. On the other hand, the fund does operate with some high amounts of leverage. That is certainly something to watch when they invest in such a high allocation to the often volatile tech sector.
They haven’t adjusted any amounts of their leverage since our previous update, but the leverage ratio continues to climb. Of course, that is due to the underlying portfolio remaining pressured during the periods reflected.
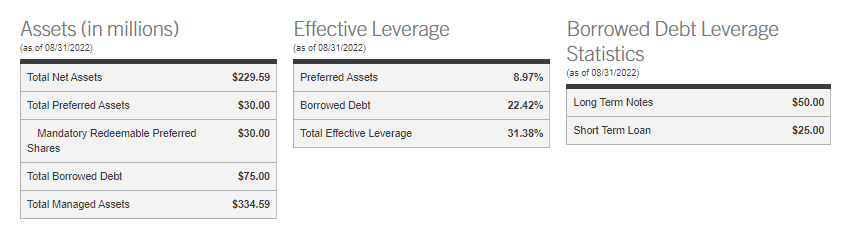
ACV Assets (Virtus)
Performance – Discount Contraction
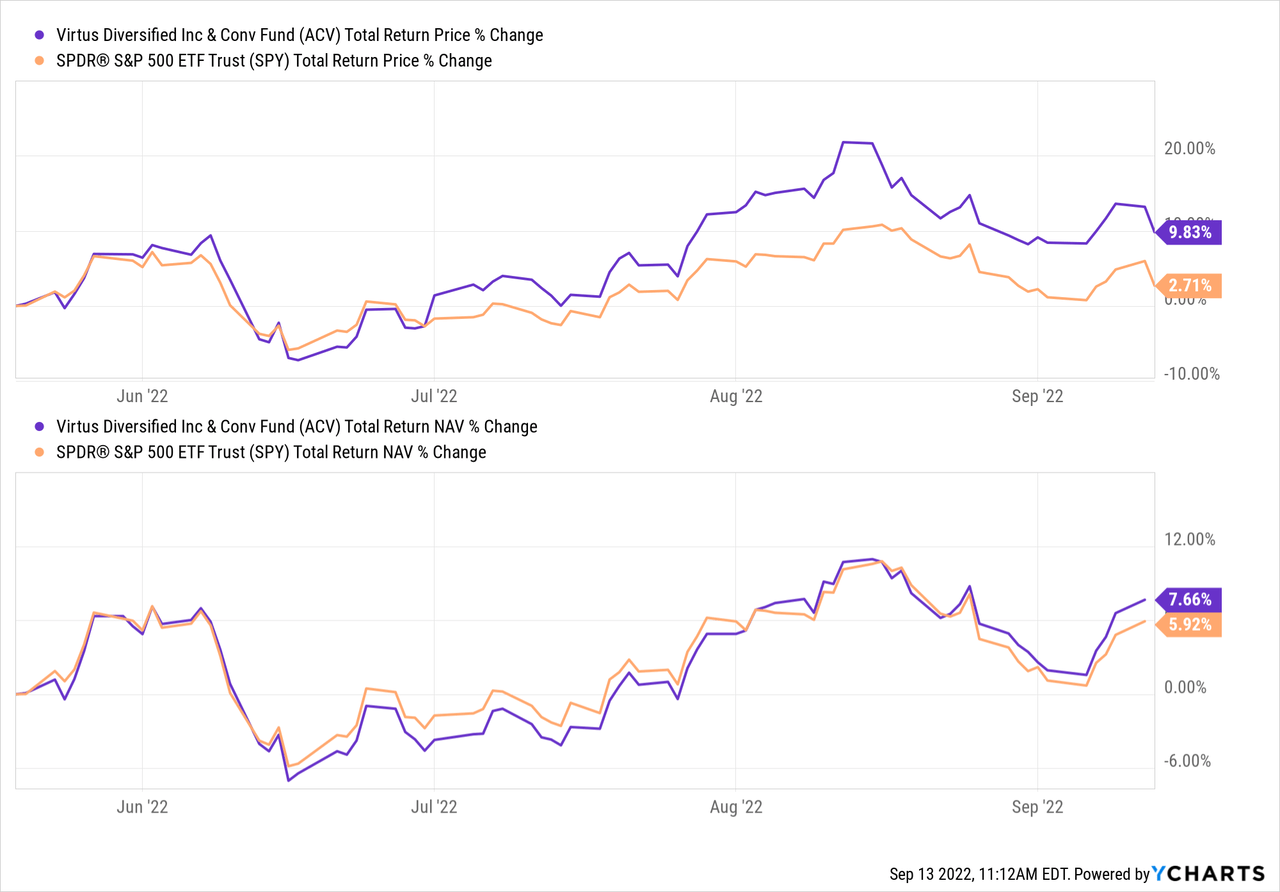
One of the things we will always pound is the discount/premium of closed-end funds. That’s essentially one of the core reasons to invest in or trade around with funds. This fund is simply another highlight of why it is so important. From the previous article until today, ACV’s actual portfolio, as represented by the total NAV return performance, only beat out the SPDR S&P 500 (SPY) marginally. At the same time, it was a hefty outperformance on a total share price return basis.
Ycharts
As a fund that invests heavily in convertibles and is generally a more all-around hybrid fund, the S&P 500 isn’t necessarily a great benchmark. It does provide us a bit of context to what we see more broadly, though.
The primary reason for this was during this time, the fund’s discount had narrowed. It was at a nearly 7.5% discount, which had contracted to just around a 3.15% discount at the time of writing.
ACV’s discount/premium history has been quite volatile, but the average discount since the fund’s inception is lower. It would suggest that. A more patient investor could continue to wait for a better entry from this current level.
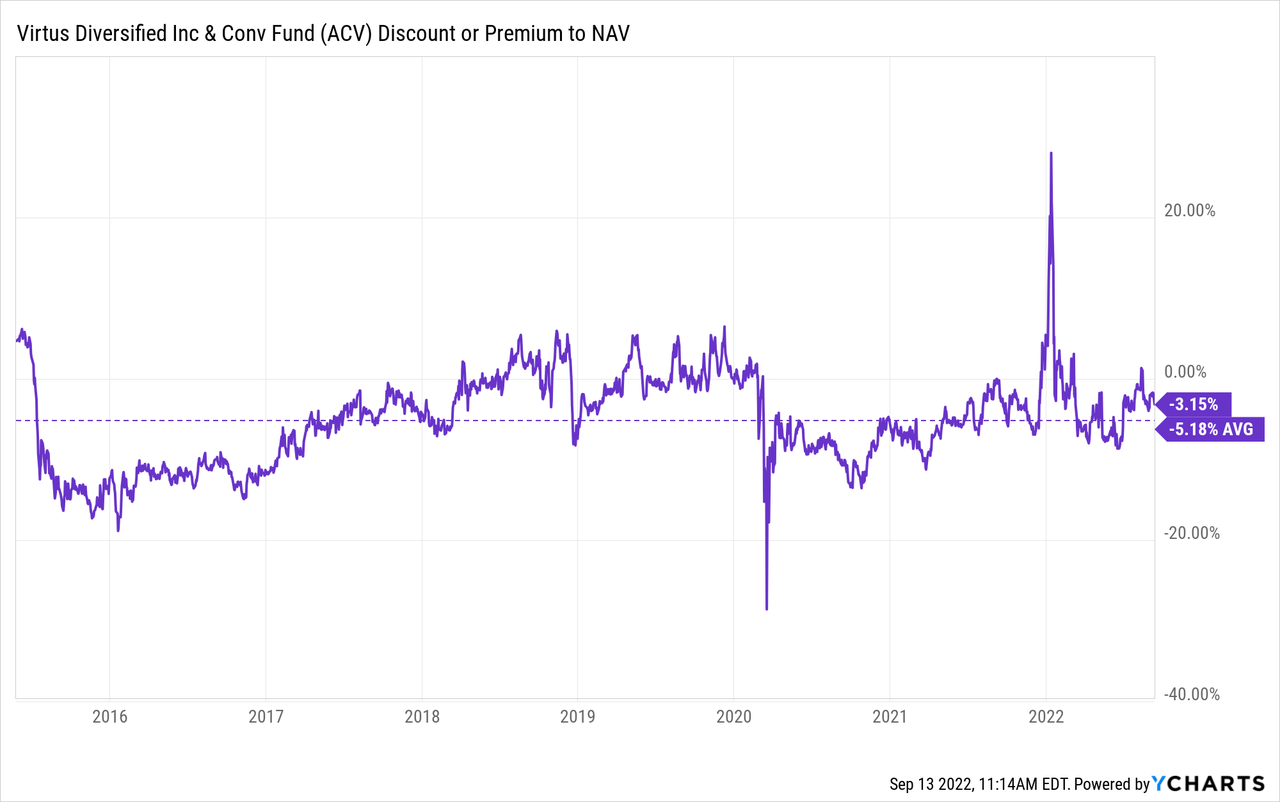
Ycharts
Generally, convertibles should provide a bit more cushion for a fund. However, due to significant run-ups in the heavy tech-weighted fund, this pushed convertible prices to elevated levels. At maturity, if the conversion doesn’t make sense, the fund should receive the face value back. That’s where some of the defensiveness comes in. That will take a longer time to play out. On a YTD basis, ACV’s performance has been more correlated with the Invesco QQQ (QQQ).
Ycharts
Yet, since the fund’s inception, it has come in much closer to the S&P 500 results. Again, these aren’t necessarily direct benchmarks because the fund is a hybrid fund. I’m simply looking at these comparisons to provide some context of how the high convertible exposures have done, relatively speaking.
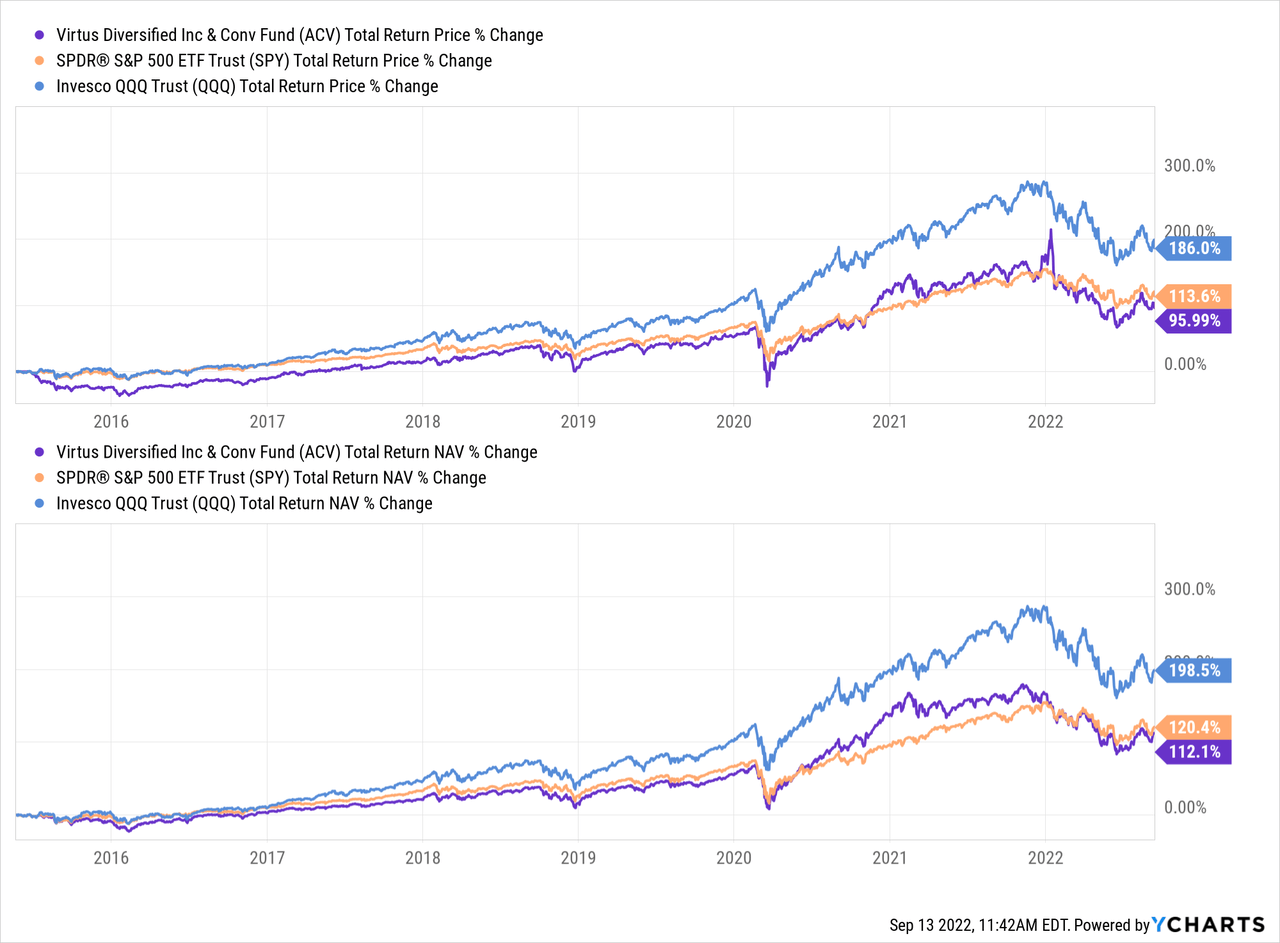
Ycharts
Given the actual declines we are seeing today, ACV is down 3.3% as I’m writing this. This was after a hot inflation number sent the market tumbling; it looks like more volatility is exactly what we are going to get too.
ACV Distribution – In The Danger Zone
ACV’s distribution is paid out monthly and currently works out to an annualized rate of 9.75%. It comes in a tad lower at 9.44% on an NAV basis due to the fund’s discount. They paid out a massive year-end special in 2021 and raised their regular distribution meaningfully.
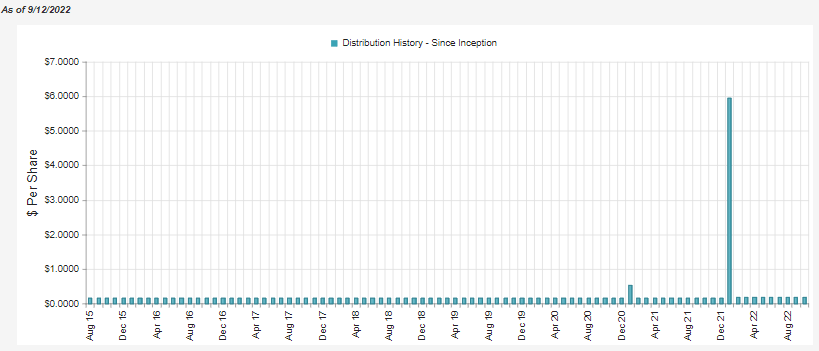
ACV Distribution History (CEFConnect)
That’s all the good news. However, due to the declines in the broader market, this comes under pressure. More particularly, the tech-oriented space that ACV is heavily invested in means the payout is on watch for a trim. However, it is worth mentioning that previously the NAV yield came in at 9.85%. That has come down, but after today’s (9/13/22) market whacking on the hot inflation number, it will likely pop higher again. That would happen once we get the updated NAV at the end of the day.
The simple reason for the fund being in the danger zone for a distribution trim is that the fund will rely on capital gains to fund the distribution. The last annual report – which is admittedly a bit dated at this point – shows that the fund produced no net investment income.
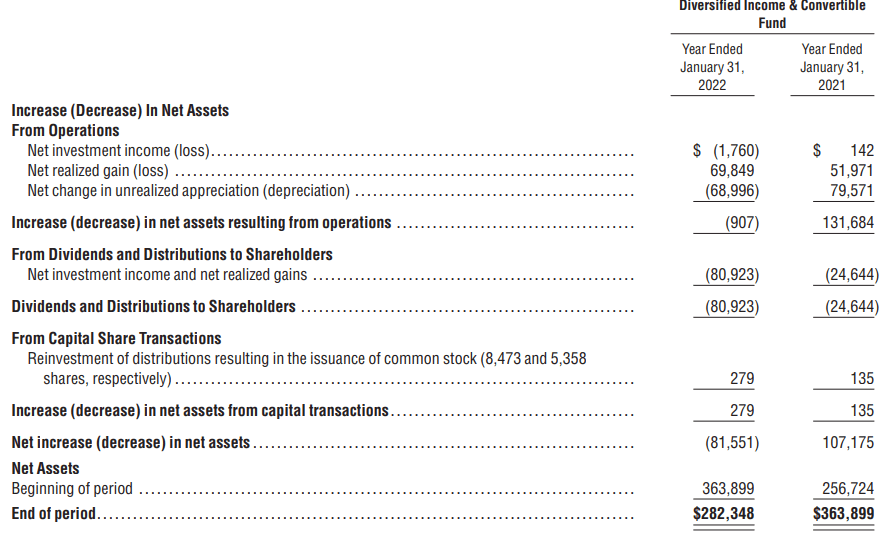
ACV Annual Report (Virtus)
That means after expenses on the fund, there were no dividend or interest payments that would have trickled down for investors. We know that since January 31st, 2022, the fund and the broader market have only come down further. Of course, that means capital gains will become harder and harder to come by, but it isn’t necessarily impossible.
For tax purposes, we see that the prior years had ordinary income and long-term capital gains. There was no return of capital characterized for ACV. However, I wouldn’t be too surprised if we started to see some show up for 2022.
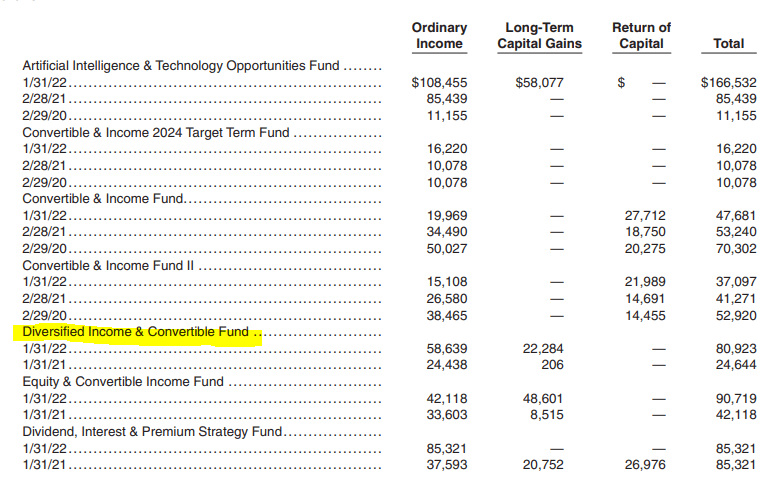
ACV Annual Report (Virtus (highlights from author))
ACV’s Portfolio
ACV runs a high amount of turnover on its portfolio. Last year was a 108% turnover rate. It was even higher at 128% in 2021. That means the portfolio is changing quite regularly. It also isn’t too surprising to see the higher allocations of “ordinary income” identified in the distribution simply because they could be creating more short-term capital gains.
That being said, their portfolio still tends to be quite similar more broadly. As an example, the tech allocation of the fund at the end of June 30th, 2022, had come in at nearly 30%.
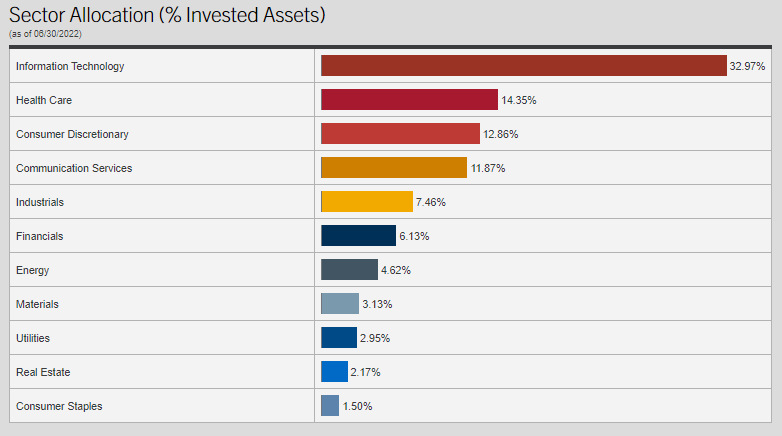
ACV Sector Breakdown (Virtus)
As of March 31st, 2022, the portfolio showed a weighting of 31.41% in tech. So despite the portfolio turning over the assets almost annually, we aren’t seeing massive changes in the underlying allocations. Healthcare was even a similar 14.93% weighting in the prior update. Consumer discretionary did have some adjustment, as it went to the 12.86% weighting above from the 16.20% it had shown previously.
This tendency of relatively insignificant changes is also observed in the fund’s portfolio breakdown of asset type holdings.
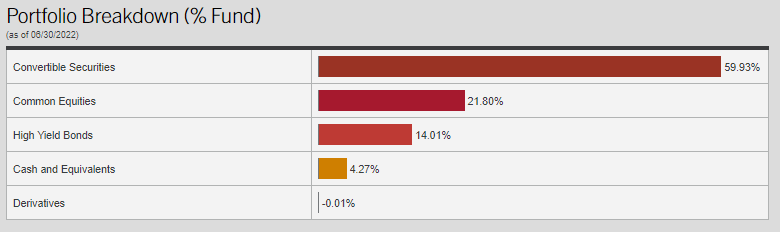
ACV Portfolio Breakdown (Virtus)
Convertibles continue to be the dominant weighting by a significant margin. At the end of March, it was a similar allocation at 58.26%.
When looking at the top ten holdings, no position makes up a massive weighting. That is something we can sometimes see in other funds. Actually, the S&P 500 itself is quite lopsided and undiversified. It might have ~500 holdings, but Apple (AAPL), Microsoft (MSFT) and Amazon (AMZN) make up a meaningful 16.46%.
ACV’s entire top ten make up around 18.68% of the fund, with 330 holdings, according to CEFConnect. So they are less concentrated on the top and more spread out between their holdings.
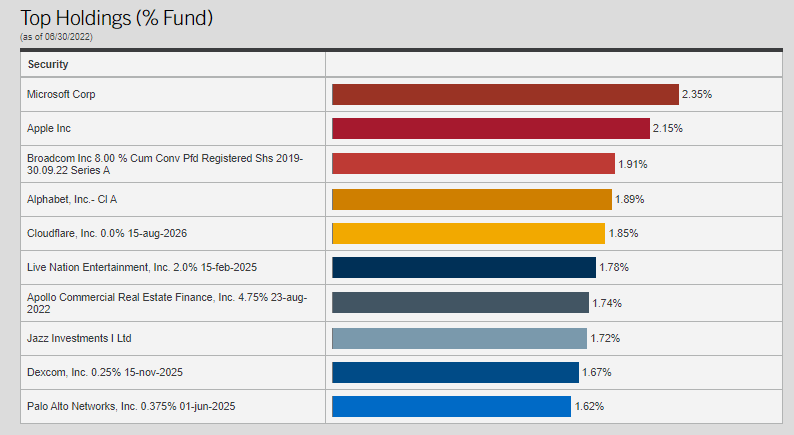
ACV Top Ten (Virtus)
As we noted above, the S&P 500 isn’t an appropriate benchmark, but it can help provide some context. MSFT and AAPL are top holdings of ACV, but after that, these names are quite different.
One thing that is noteworthy is the low rates we see on some of these convertibles. The Palo Alto Networks (PANW) 0.375% convertible is quite a great deal for PANW. They are paying almost nothing for raising that capital that they could put to work. With higher yields coming, convertibles would have to start paying more when they are issued. However, naturally, there are fewer issued when rates are more elevated.
Conclusion
ACV is likely to experience some short-term weakness as the broader markets remain under pressure. With a hot inflation report, the fund is set to tank along with the rest of tech. A hotter inflation report means that the Fed can remain aggressive, and growth becomes less attractive once again. For a longer-term investor, this could still be creating an opportunity. I would personally want to see ACV’s discount widen out a bit further first.
Be the first to comment