

AscentXmedia/E+ via Getty Images
Overview – 2022 year-to-date
On January 3rd, the S&P 500 recorded its last new high and began a 6 month, 1,130 point decline that bottomed out (at least for now) at 3666 on June 16th. The maximum drawdown (peak-to-trough decline) so far is -23.5%.
After two subsequent rally attempts that failed to produce a new high, the market closed on September 16th at 3873. That leaves the S&P 500 index 19.3% below the January 3rd peak, and 5.6% above the June 16 trough.
To date, the market has changed direction eleven times. For the purposes of this article, I define a change of direction as a swing of 5% or more from the prior turning point. Here is a chart that shows each of the eleven swings from the peak on January 3rd until today.
StockCharts; Author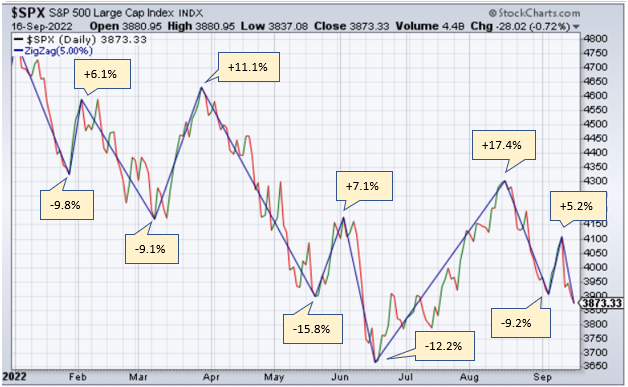
The eleven swings
1. January 3-27. In its first leg down, the market sheds 470 points in 17 trading days. The decline of 9.8% is just shy of the 10% correction line. Inflation was 6.8% and rising; the Fed was talking about tapering bond purchases and hiking rates beginning in March; the 10yr Treasury bond started to move higher; bond prices in general began to drift lower; predictions of a bursting stock market bubble become more common.
2. January 27-February 2. The market produces a four day, 263 point counter-trend rally. The gain for this brief bounce is 6.1%. Talk of oil prices hitting $100 per barrel starts to spread; inflation fears increase; talk of recession begins to edge out expectations for a soft landing.
3. February 2-March 8. The market resumes its decline, dropping 418 points in 23 trading days. The decline of 9.1% takes the market firmly into correction territory. On February 24th Russia invades Ukraine. Aside from the innate horrors of war in humanitarian terms, the world now frets about the economic fallout from a prolonged conflict.
4. March 8-March 29. The market embarks on a three week, 461 point rally. The 11.1% gain takes the market out of correction territory and just 3.4% shy of a new market high. Strong reports on employment, home sales, wages, and retail spending send the market higher, but only temporarily.
5. March 29-May 19. The market has its biggest decline to date, dropping 730 points, or 15.8%, in 36 trading days. It stops just 1.3% above the bear market line before reversing direction again.
6. May 19-June 2. The market has a two week, 276 point counter-trend rally for a gain of 7.1%.
7. June 2-June 16. The market slides into bear territory with a 510 point, 12.2% decline to the current low of 3666. This decline takes just two weeks. By now it is clear to investors and consumers that inflation will not be transitory and the Fed begins to adopt stronger wording to describe their determination to subdue what is now recognized as runaway inflation.
8. June 16-August 16. The market has its strongest rally of the year, climbing 638 points in two months. The gain of 17.4% is impressive but it fails like those that preceded it. A strong employment report and robust consumer spending propel the market higher as the soft landing meme once again surfaces.
9. August 16-September 6. The market suffers a three week, 397 point decline for a 9.2% loss. A hotter-than-expected CPI report was the culprit this time.
10. September 6-September 12. The market has another counter-trend rally, gaining 202 points, or 5.2%. The rally stalls after four trading days.
11. September 12-September 16. The market resumes its decline, falling 237 points, or 5.8%, in four trading days. The bombshell announcement by FedEx that their revenues and earnings would not meet analysts’ expectations, along with a suspension of any forward guidance by the company, roiled markets. The announcement brought fears of a more serious recession than previously thought.
Here is a table showing each of the 11 swings described above.
|
Swing Dates |
Point Change |
Percent Change |
|
1/3/22-1/27/22 |
-470.05 |
-9.8% |
|
1/27/22-2/2/22 |
262.87 |
6.1% |
|
2/2/22-3/8/22 |
-418.68 |
-9.1% |
|
3/8/22-3-29-22 |
460.90 |
11.1% |
|
3/29/22-5/19/22 |
-730.81 |
-15.8% |
|
5/19/22-6/2/22 |
276.03 |
7.1% |
|
6/2/22-6/16/22 |
-510.05 |
-12.2% |
|
6/16/22-8/16/22 |
638.43 |
17.4% |
|
8/16/22-9/6/22 |
-397.01 |
-9.2% |
|
9/6/22-9/12/22 |
202.22 |
5.2% |
|
9/12/22-9/16/22 |
-237.08 |
-5.8% |
Where do we go from here?
The answer depends on which of the two main competing narratives proves to be more prescient. The first is the optimistic narrative. It assumes that 6-12 months from now inflation will be largely vanquished and the Fed will have flipped from tightening to loosening their monetary policy stance. Any recession along the way will be brief and shallow, employment will stay healthy, and earnings expectations will only come down marginally. Under this scenario, the market will soon find a bottom and embark on a new bull run to all-time highs. In order for that to happen, the market will have to rally 24% from where it stands today. Difficult, but certainly plausible.
The pessimistic narrative sees dangers lurking around every corner. Inflation will persistently stay above the Fed’s 2% target, which will cause the Fed to raise rates higher than what is currently expected. The recession will arrive sooner, last longer, and cause more pain than what is priced in now. Earnings estimates will take a hefty haircut, unemployment will rise sharply, and the market will drop another 20%-25% from here. That would put the S&P 500 at 2900-3100. Very pessimistic indeed, but again, plausible.
My own view of where we go from here leans closer to the optimistic than the pessimistic scenario. We may not have seen the ultimate bottom yet, but I think we are getting close. I still have faith in the dip-buyers, who have been bloodied but not driven out of town yet. They have mounted five rallies this year, and I’m confident that they will keep trying until they succeed.
In my scenario, I see a recession starting in early 2023. Unemployment will probably rise as high as 5%, but that would still be below the long term average of 5.75%. Earnings estimates will continue to come down, but I expect them to rebound by mid-2023. The market tends to start moving higher about four months before the end of a recession, so I think that it is reasonable for a long-term investor to start preparing now for better days 6-12 months from now.
Be the first to comment