

undefined undefined/iStock via Getty Images
From the latest Federal Reserve Minutes:
Financial markets were highly volatile over the intermeeting period, with strained liquidity in some markets. The Russian invasion of Ukraine led to periods of particularly elevated volatility and deteriorating investor risk sentiment. Nominal Treasury yields and the expected path of policy rose during the intermeeting period, driven by economic data releases and FOMC communications that were viewed as implying a more rapid removal of monetary policy accommodation than previously expected. Domestic equity indexes declined modestly, while those in Europe fell noticeably. Financing conditions remained accommodative, although borrowing costs increased further.
Strained liquidity is one of several key financial market signs of a recession.
On the plus side, however, financial stress indicators are still fairly benign:
Three financial stress indexes (FRED)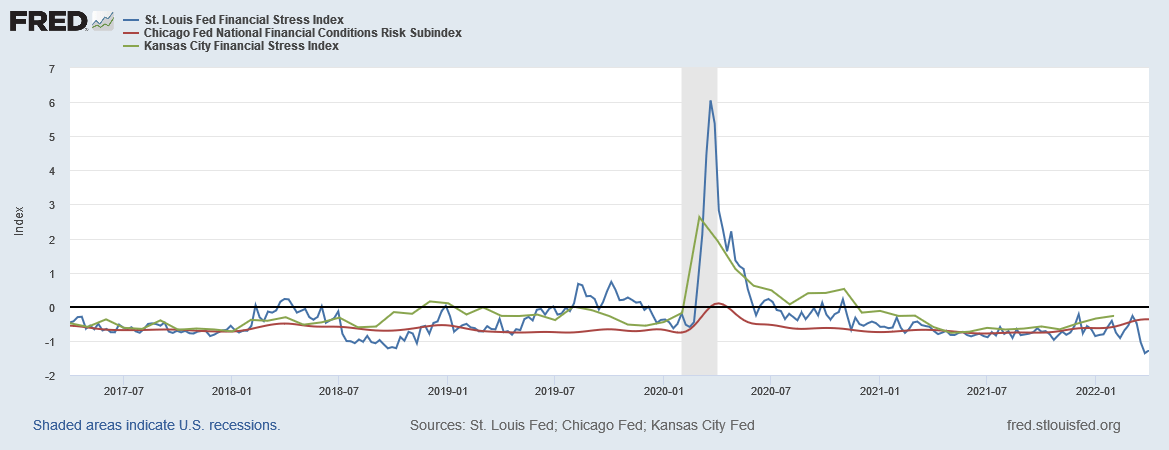
Fed President Bullard believes the Federal Reserve is behind the curve:
In Bullard’s calculations, he used the Dallas Fed trimmed mean value – along with other “generous assumptions” – to give a minimal recommended value for the policy rate under current macroeconomic conditions. Comparing that rate to the actual policy rate provides a measure of the degree to which U.S. monetary policy is “behind the curve,” he explained.
The recommended policy rate from Bullard’s simple Taylor-type policy rule calculation is 3.5%, while the current value of the policy rate is 37.5 basis points. “One concludes that the current policy rate is too low by about 300 basis points, according to this calculation,” Bullard said.
Count him in with Mester and Powell as potentially arguing for at least one 50 basis point rate hike.
A key component stoking inflation has declined in the last two months:
Used car prices, a category that’s been a major contributor to elevated inflation readings, have now fallen for two months in a row, according to the latest data from auction house Manheim. In fact, March 2022 saw the biggest sequential drop since the Covid-spurred crash in April 2020.
However, we’re not seeing it in the CPI data:
Y/Y percentage change in used care prices (FRED)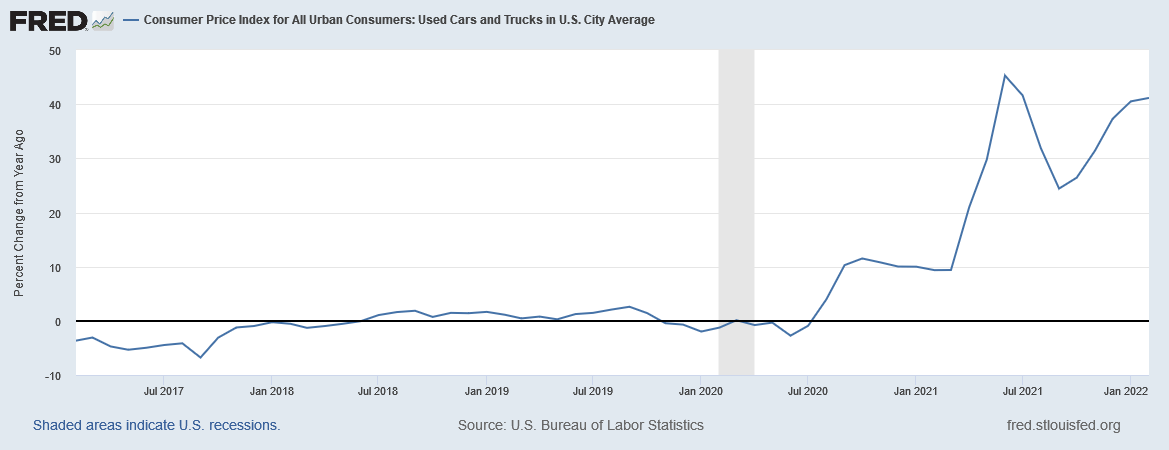
Let’s take a look at today’s charts:
3-month SPY, QQQ, DIA, and IWM (StockCharts)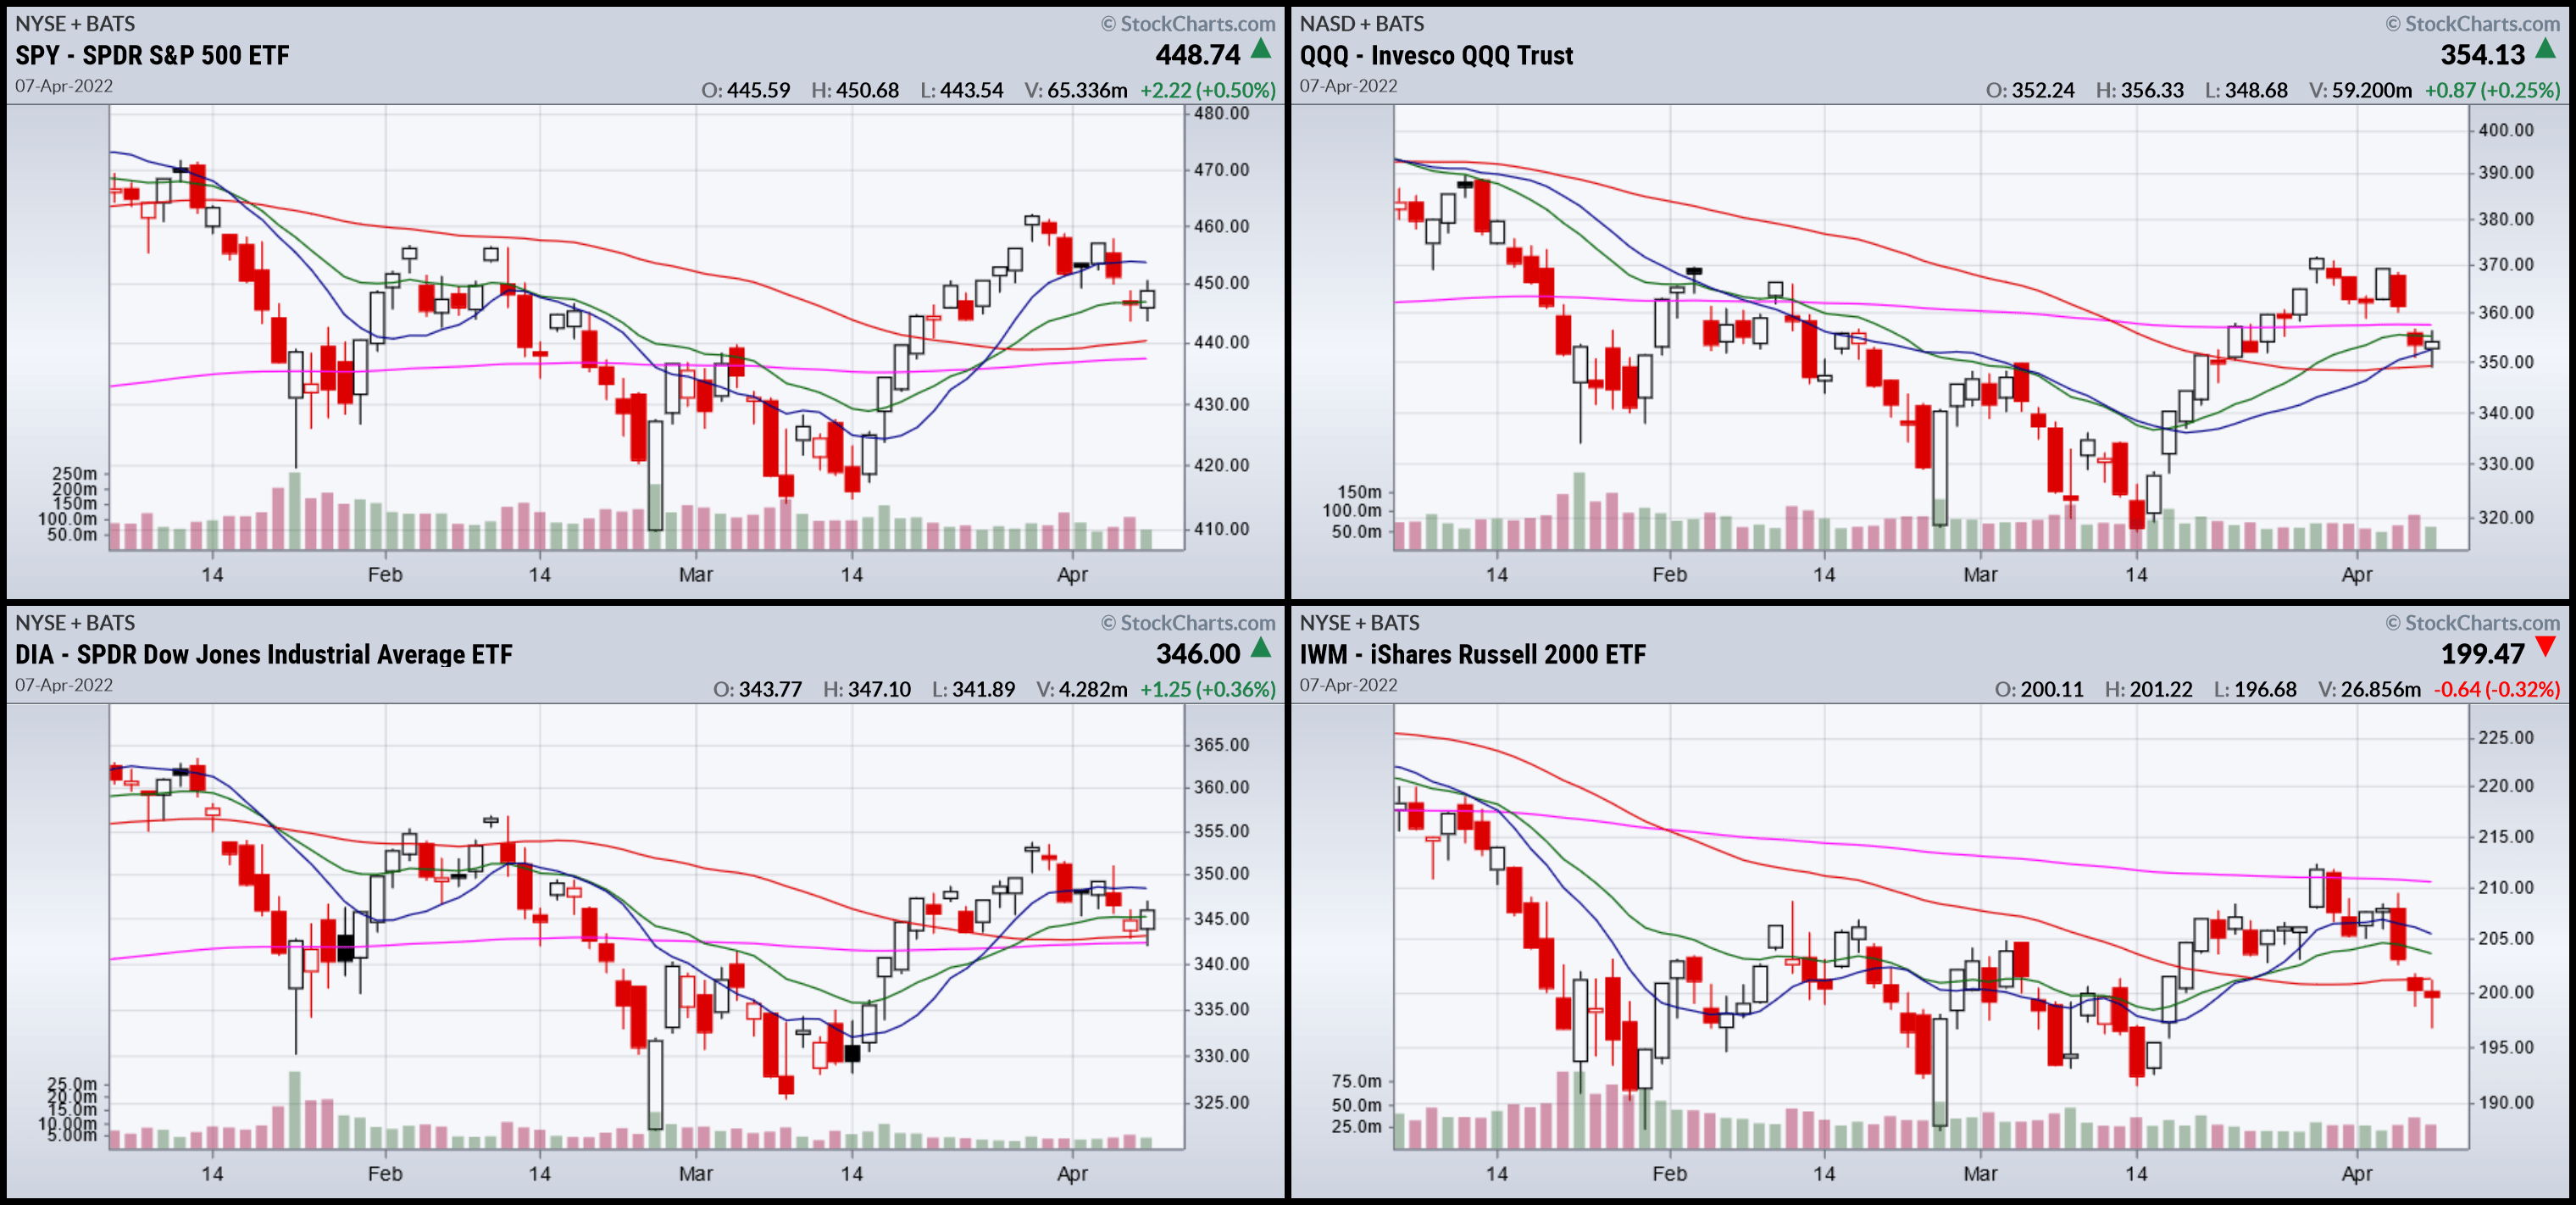
All the indexes are still moving lower from the highs of late March. The SPY is at the 20-day EMA; the DIA is resting on the 50 and 200-day EMA; the QQQ is right at the 20. However, the IWM is right below all its EMAs.
2-Week SPY, QQQ, DIA, and IWM (StockCharts)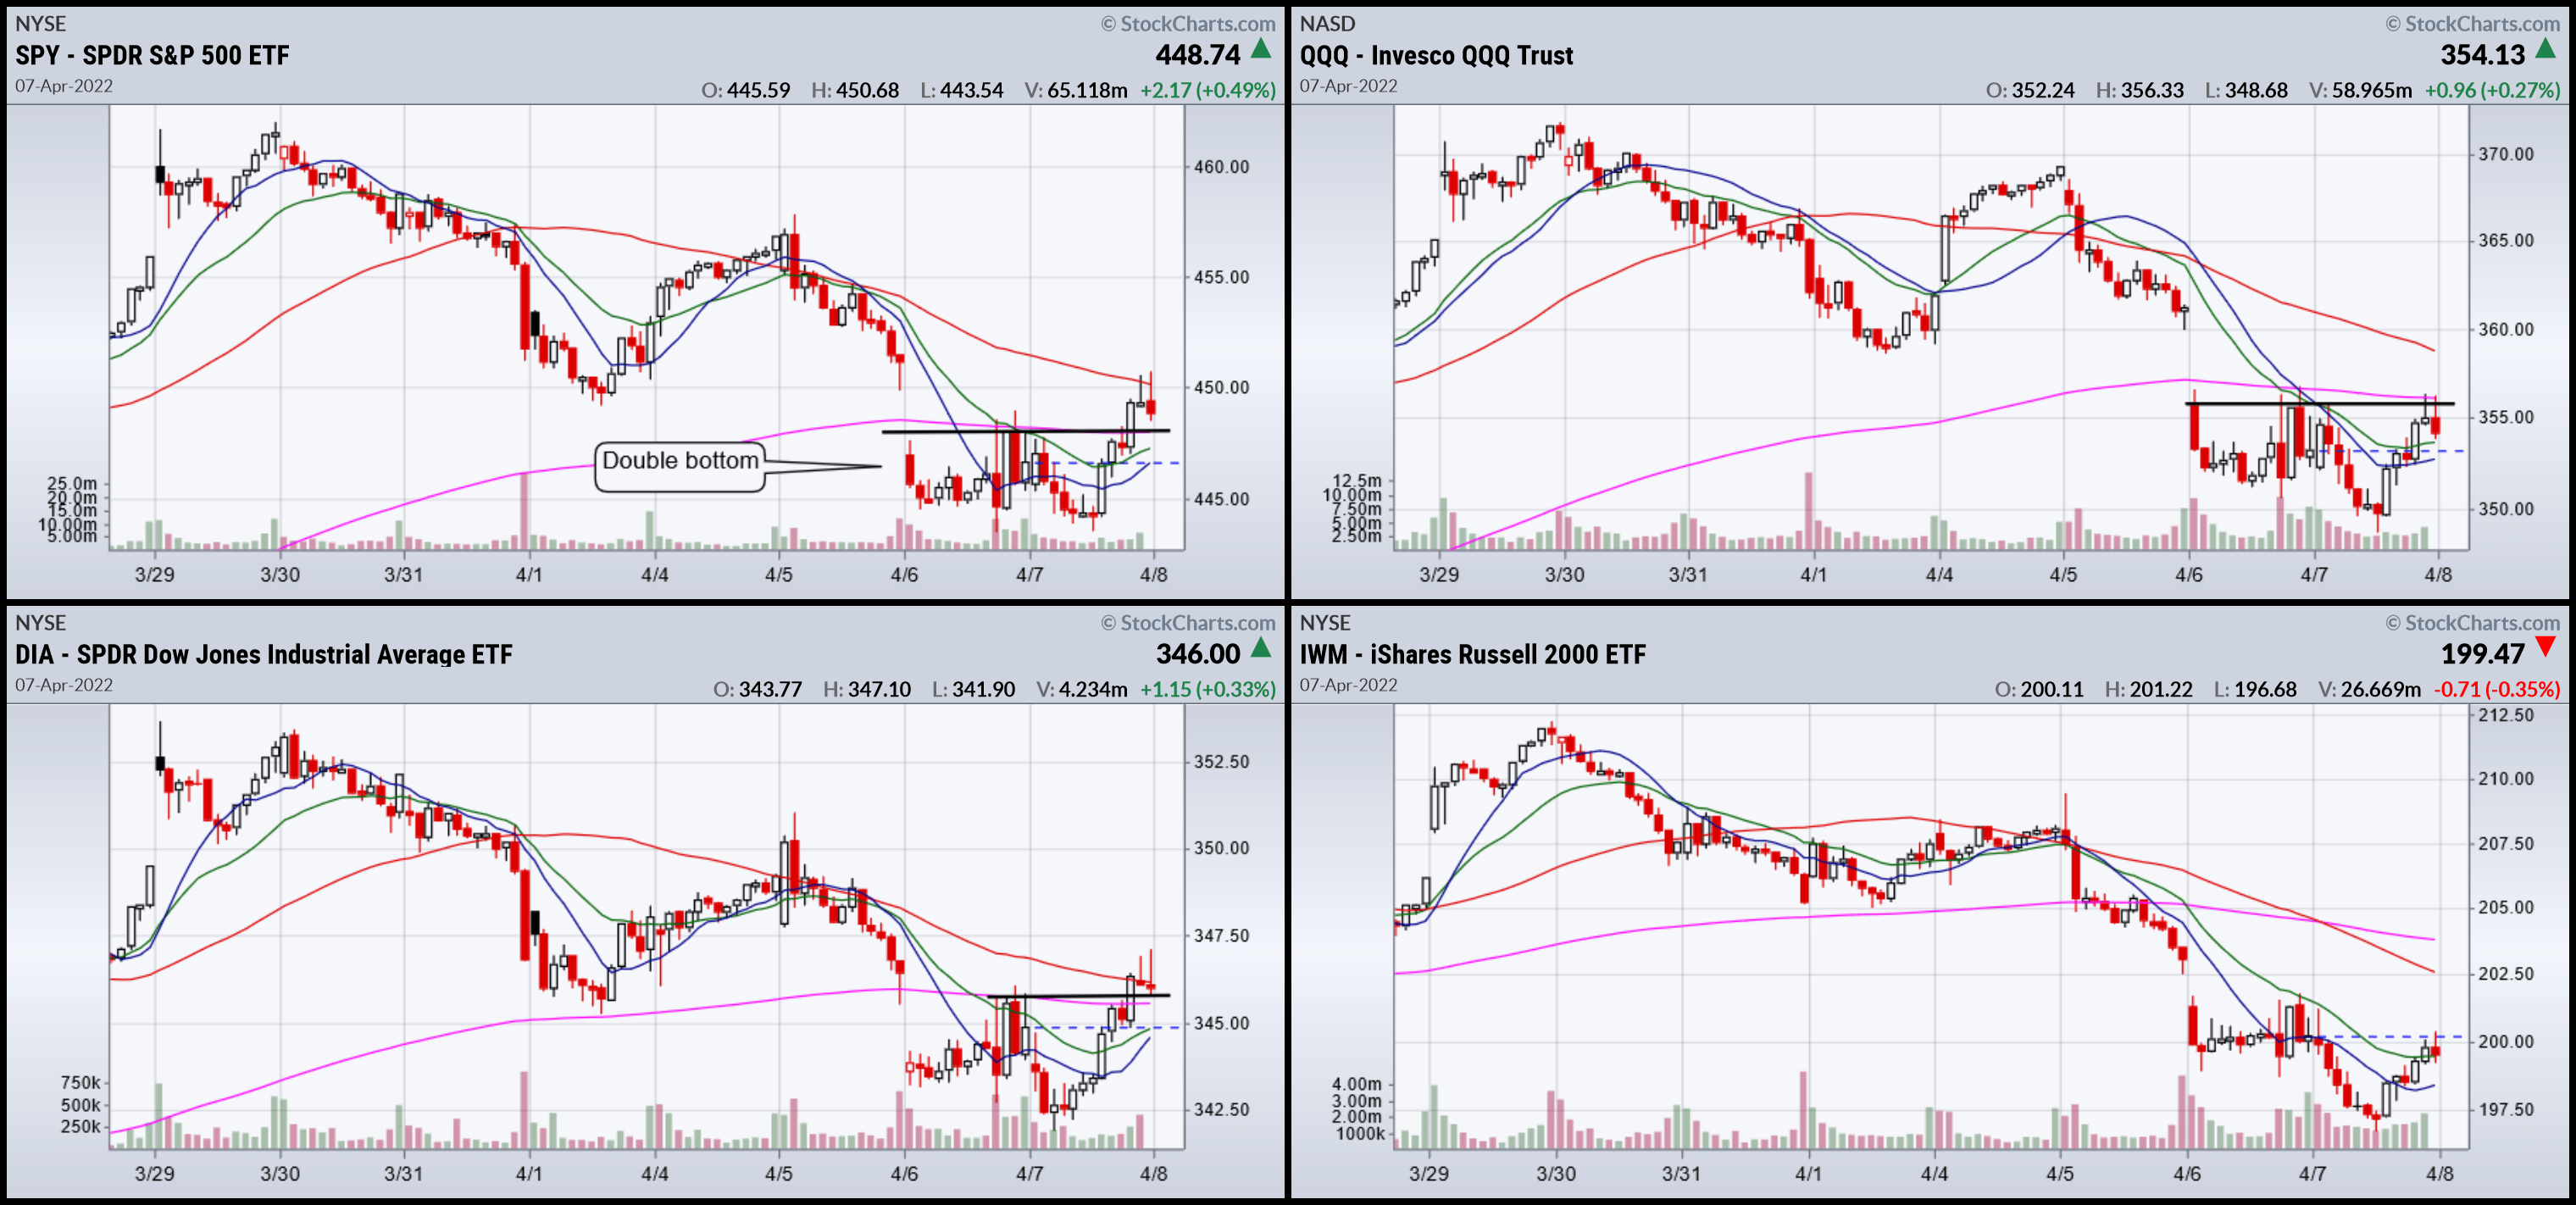
Unfortunately, the only potential bottom is on the SPY chart. There, prices are just over resistance and below the 200-minute EMA.
Tomorrow, let’s hope we see a solid bottom or reversal.
I’ll be back over the weekend with my standard market wrap.
Be the first to comment