

Joe Raedle
Introduction
Over the past couple of weeks, I’ve been writing a series of articles in which I have shared my potential buy prices on several deeply cyclical semiconductor stocks. The overwhelming consensus opinion of readers is that my buy prices are unrealistically low and will never happen. While adidas (OTCQX:ADDYY) (OTCQX:ADDDF) is not a semiconductor stock, it is a deeply cyclical business just like semiconductors are, and it’s a stock that I recently purchased using the same Deep Cyclical strategy I’ve been sharing with readers. In this article, I’m going to take readers through my process and the thinking behind my recent purchase of adidas’s ADR.
adidas’s Historical Earnings Cyclicality
The first thing I check for every stock I analyze is to see what its historical earnings cyclicality looks like. The reason I do this is because I want to know if this is a stock that fits the profile of a stock I would consider investing in, and also I want to know which strategy and techniques are the most appropriate to analyze the stock in question.
FAST Graphs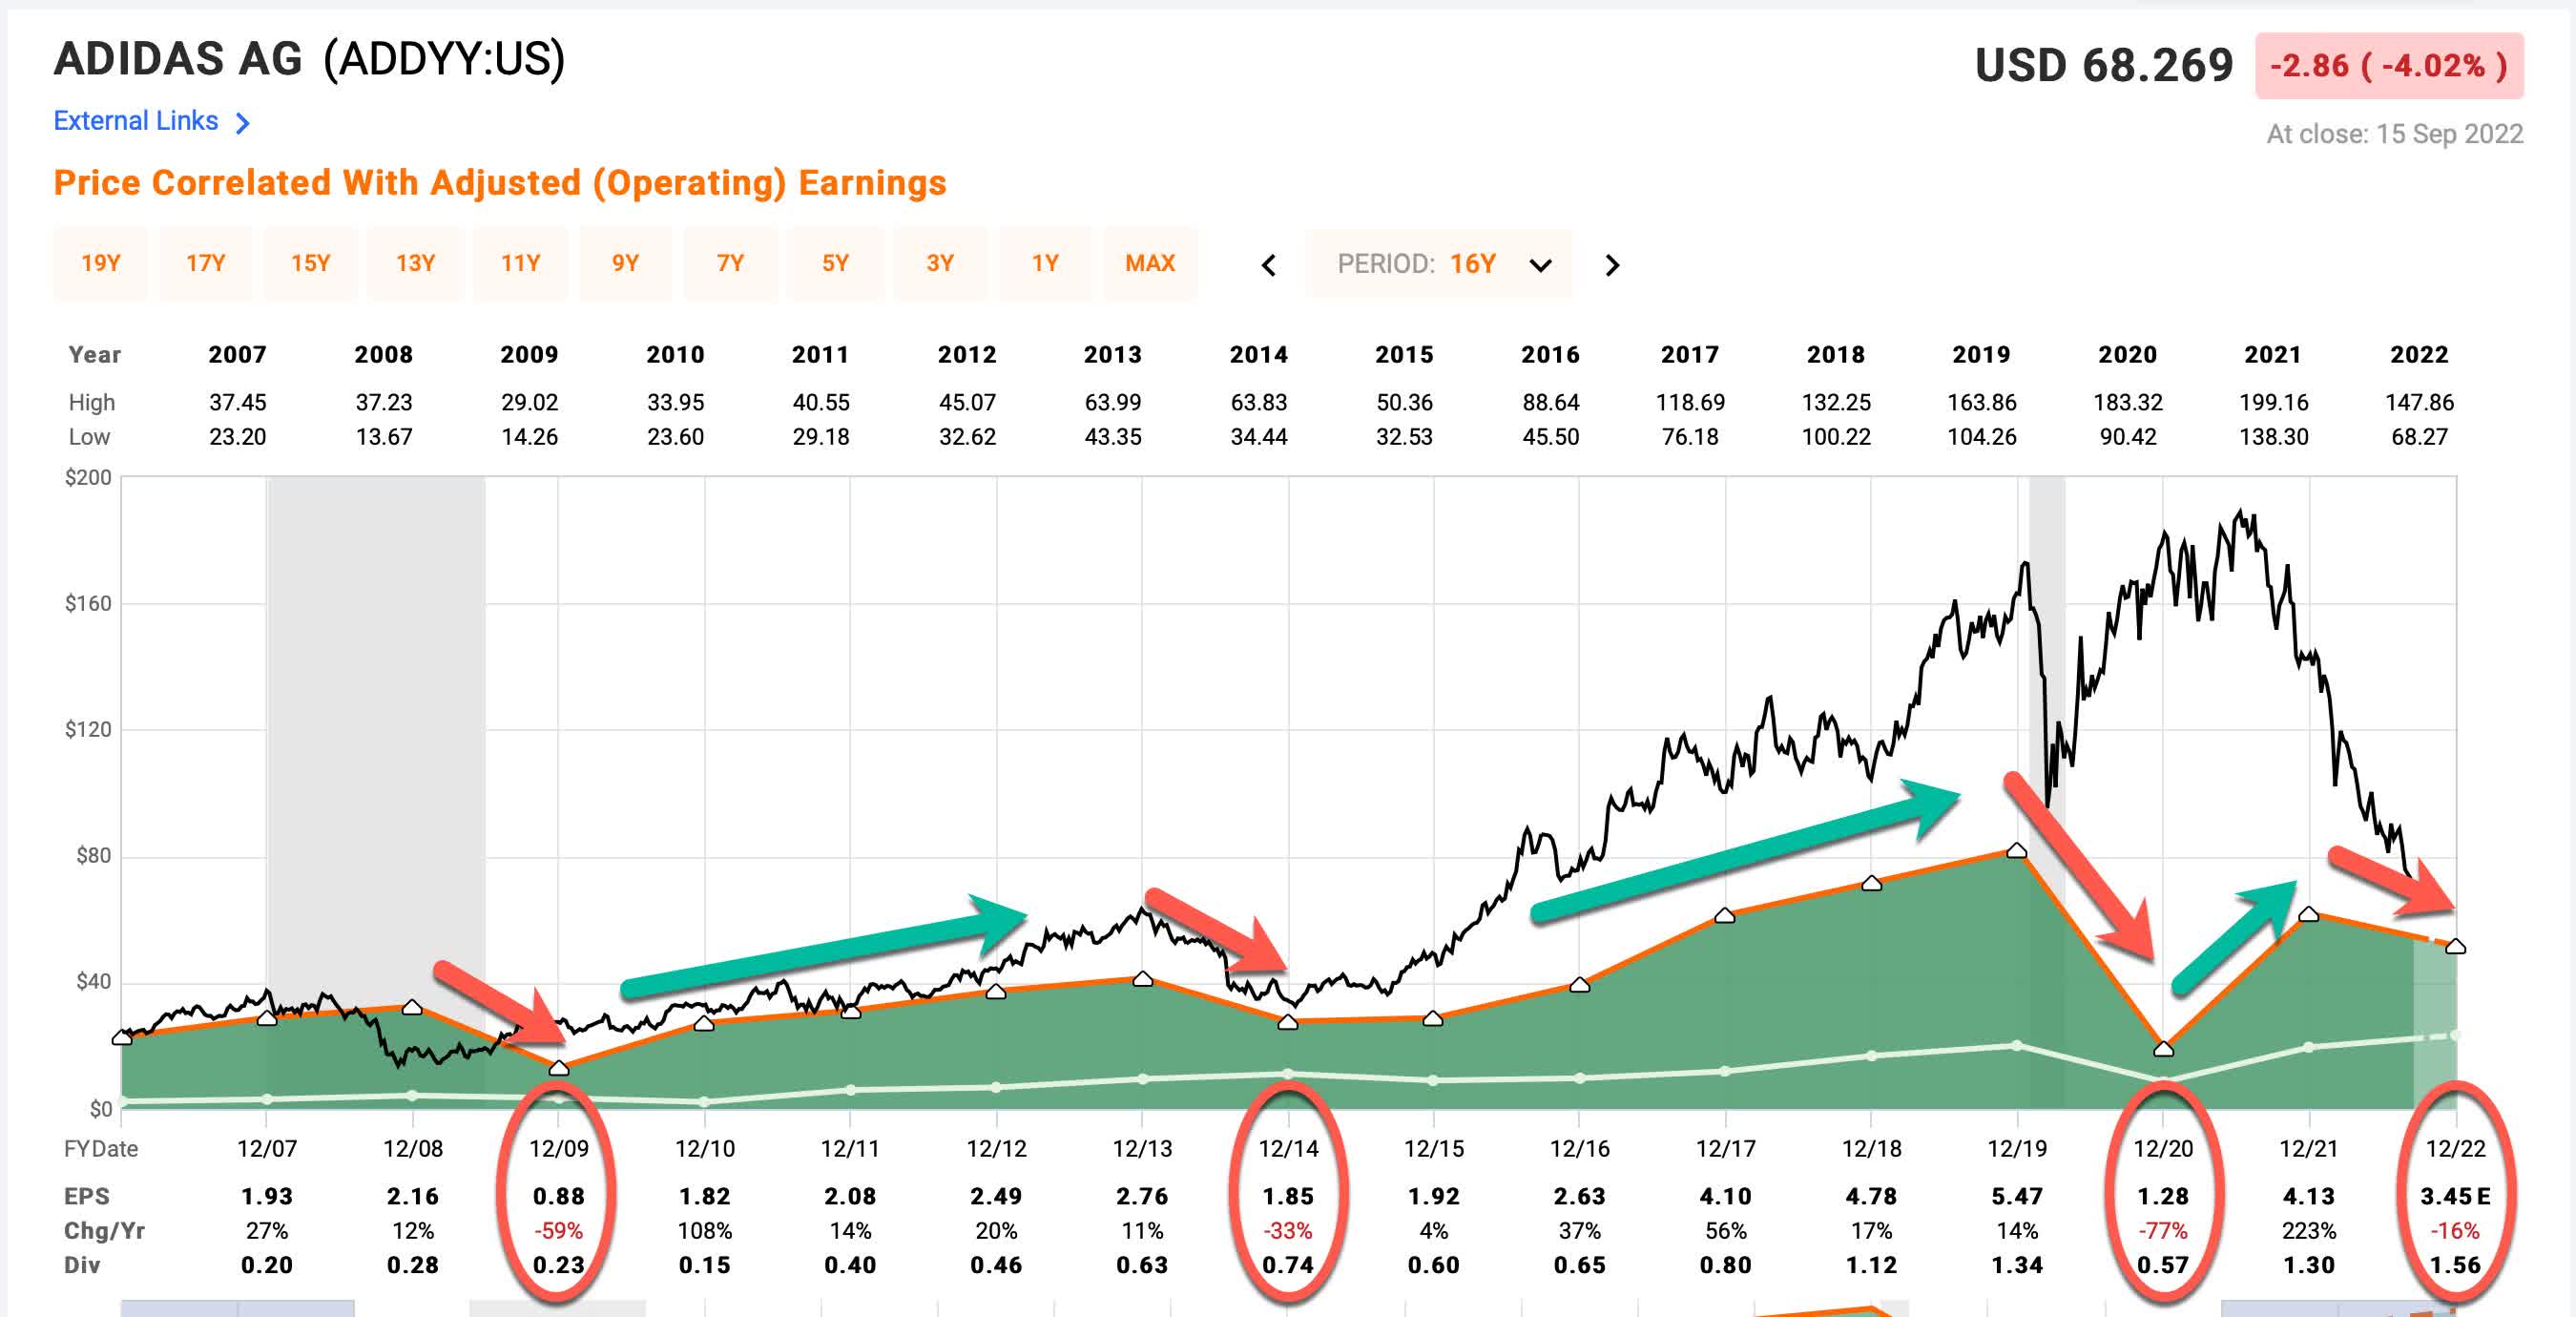
The dark green shaded area in the FAST Graph above represents adidas’s historical earnings per share. I’ve circled the years in red in which earnings were negative compared to the previous year. What I’m looking for here is whether there are any years in which EPS has fallen more than -50% off its highs, and we see two such years. One in 2009, when EPS fell -59% and one during COVID in 2020 when EPS fell -77%. It’s important to note here that I am tracking the US ADR, so these are priced in US dollars and so the strong US dollar we currently see is reflected in these declines. But what is most important is that these EPS declines are big enough to classify adidas as a cyclical business, and therefore it is best to not use earnings to value the stock because earnings can fluctuate a great deal. This can cause the stock to look very attractive at the beginning of a downturn, even though there is still likely a lot farther for the stock price to drop.
For example, look at adidas’s PEG ratio in January of 2008:
FAST Graphs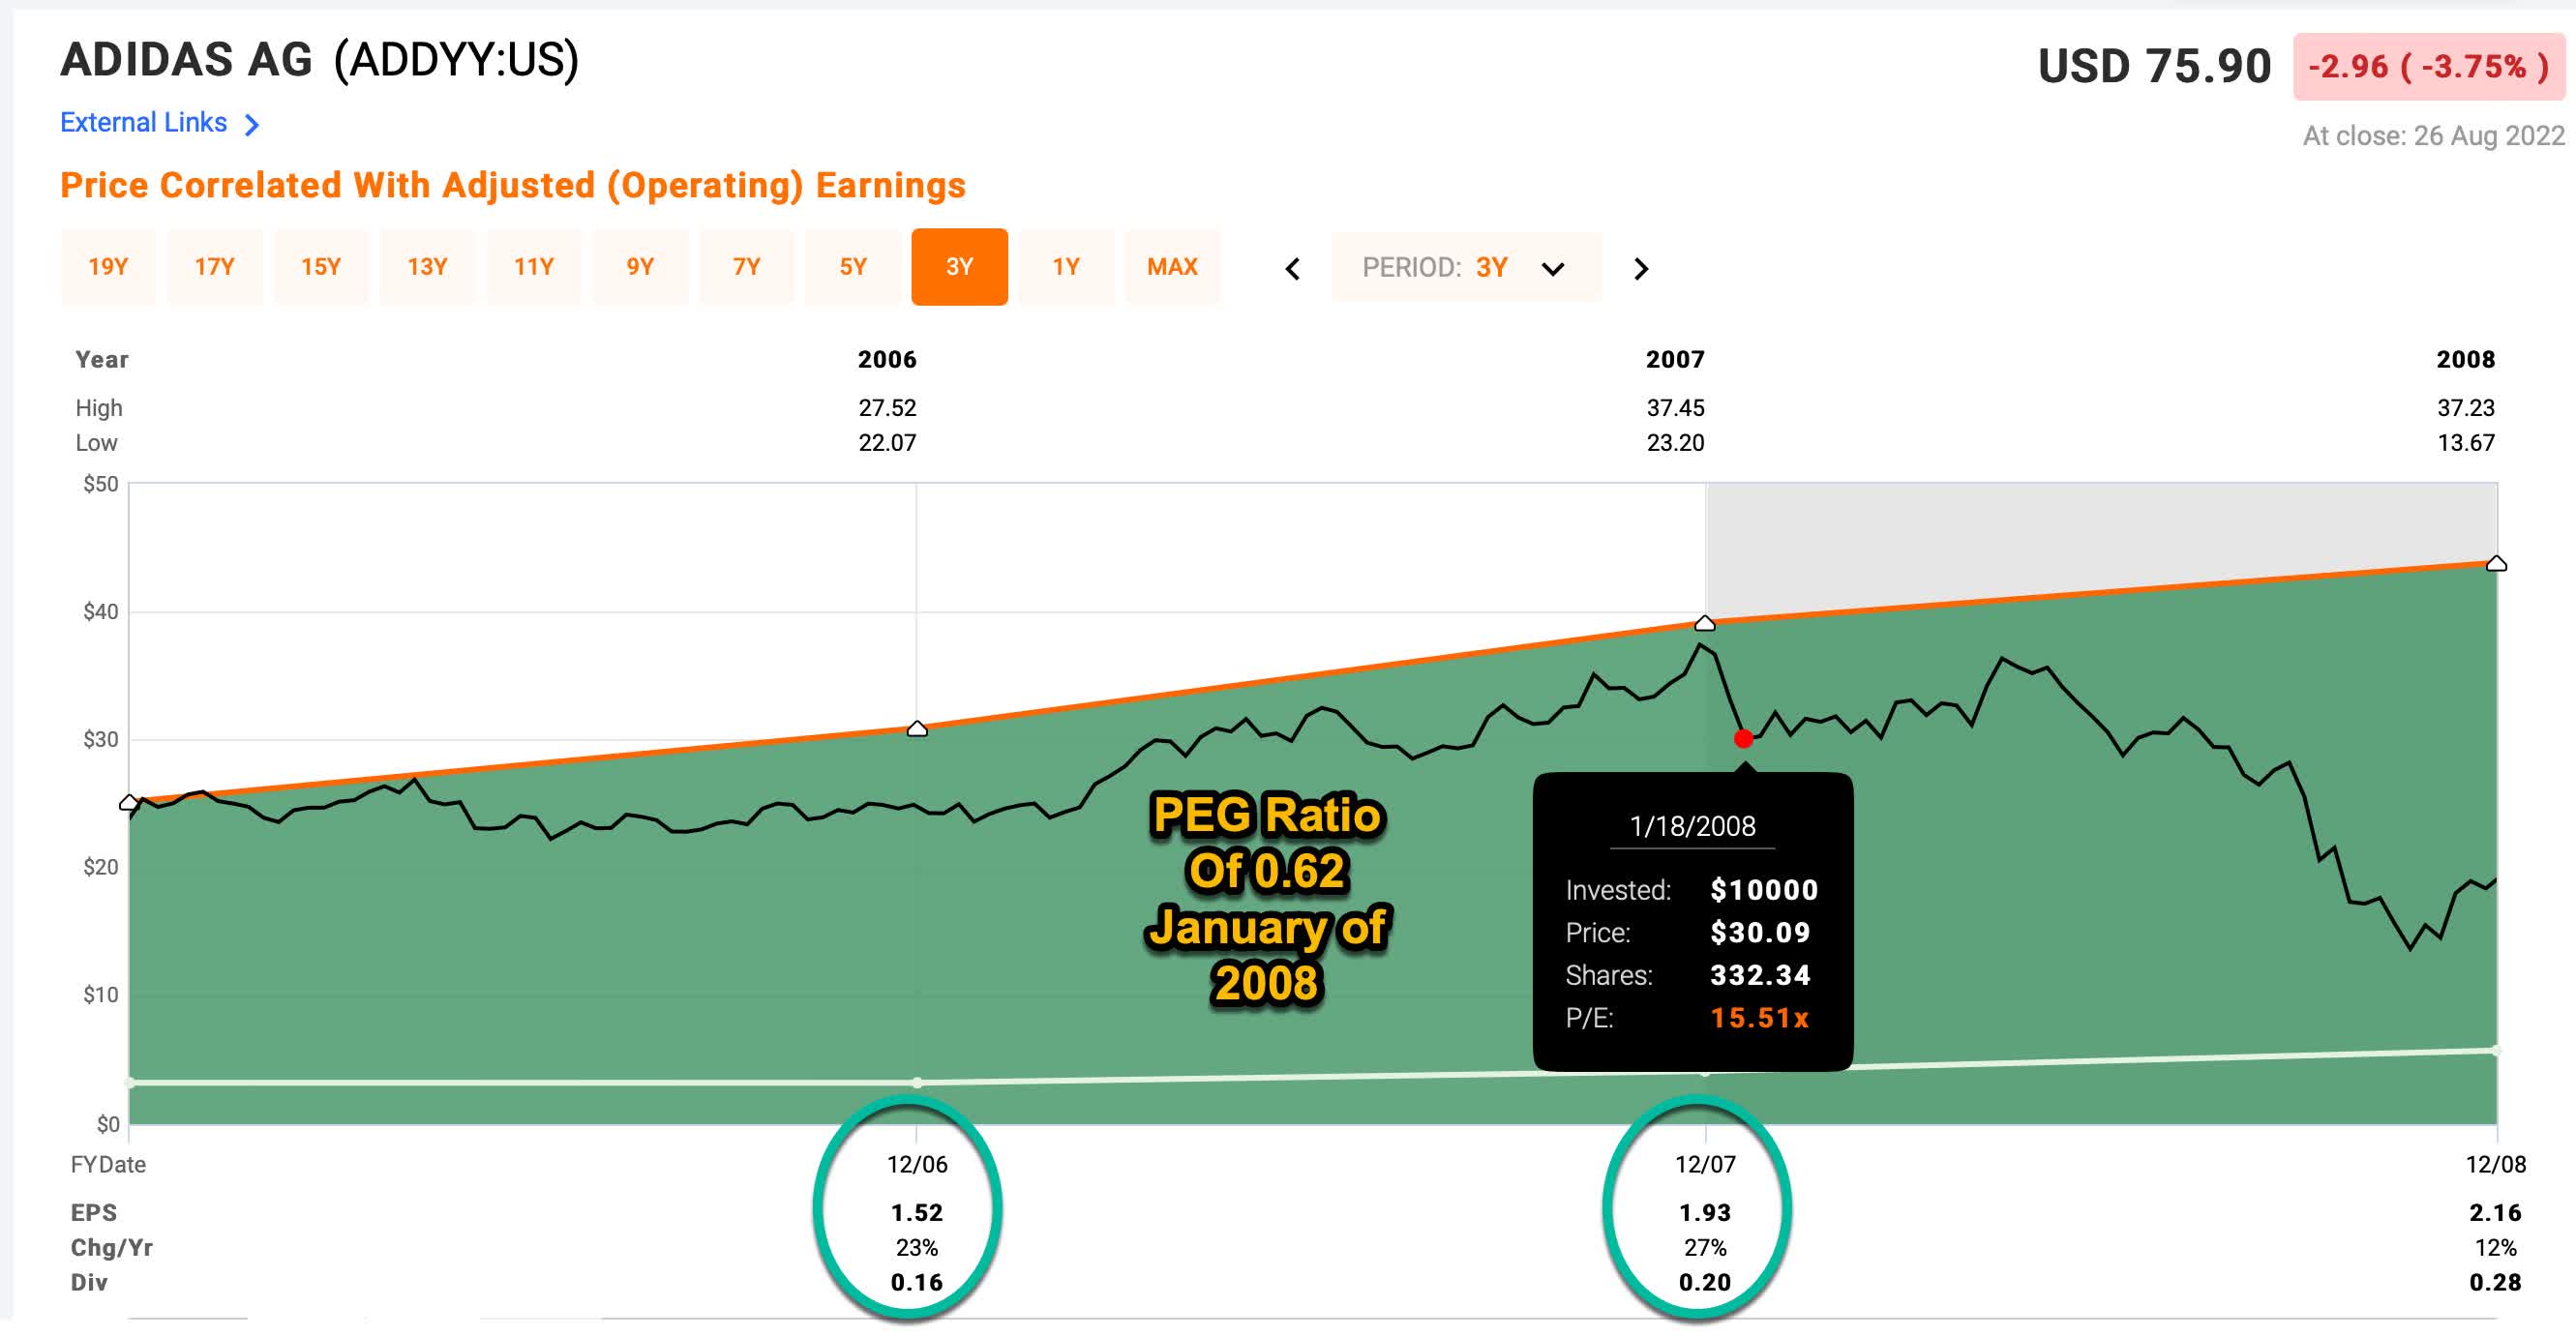
Above is a FAST Graph that covers ADDYY from 2006 to 2008. Notice that the business had an average 25% earnings growth the previous two years in 2006 and 2007 leading into a price drop in January 2008. At that point in time, the P/E Ratio was 15.51. This combination of fast earnings growth and reasonable P/E Ratio produces a very attractive PEG ratio of 0.62 (a PEG ratio under 1 is generally considered a good value). Using this time frame, adidas stock was not only attractively priced, but it also had a significant margin of safety. The problem, though, is that adidas’s business can be deeply cyclical at times, and during the GFC, in 2009, was one of those times.
FAST Graphs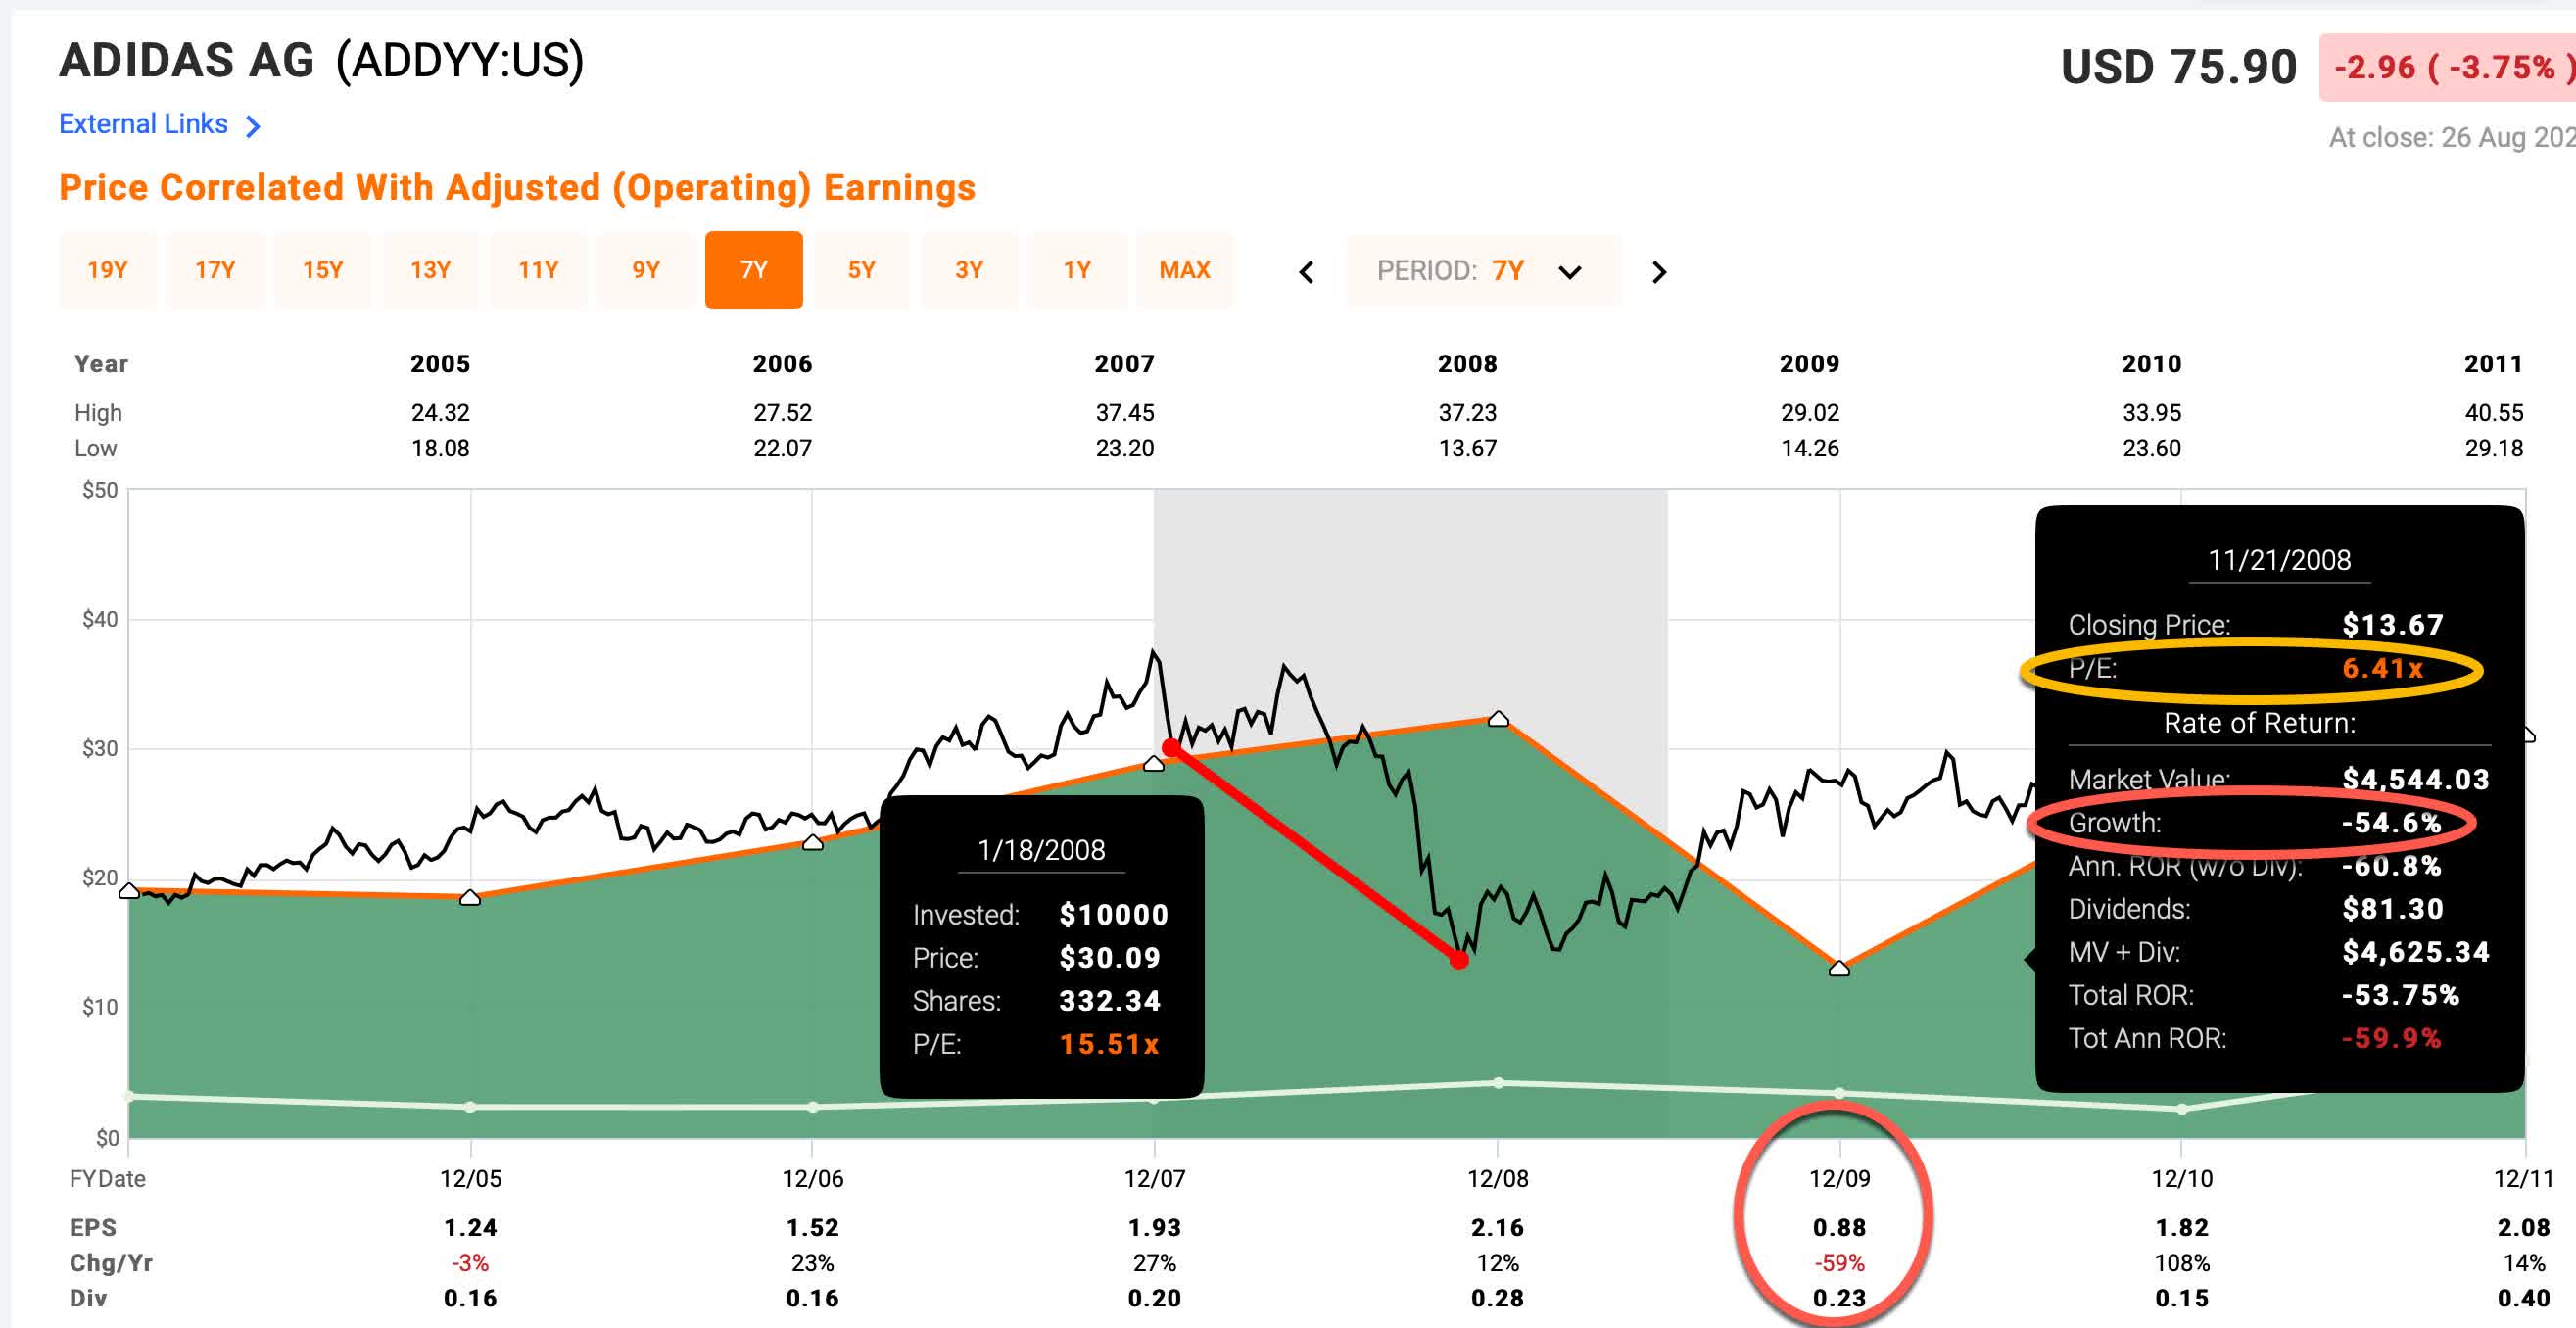
In less than a year, adidas’s stock price would fall about -55% to a P/E of around 6.41. The reason for that is the market was anticipating the -59% decline in earnings growth in 2009 adidas would eventually experience. At trough earnings, not only was adidas’s earnings growth now negative (instead of +25%), but the P/E if adidas had been trading at the same price as January 2008 was over 30 (instead of 15). So, if we were to apply 2009’s earnings to January 2008’s stock price, instead of the reasonable-looking 15 P/E, the P/E at that time would really have been 30 based on future earnings. This wide fluctuation in earnings is what makes it difficult to value stocks with deeply cyclical earnings via their earnings histories.
For that reason, when I classify a business’s earnings as “Deeply Cyclical”, I use historical price patterns to help guide my valuation process rather than an earnings-based valuation.
Quality Check
An additional check I usually do at this stage is to see whether both the earnings and the price have a pattern of recovering from previous down cycles in a timely manner. In this case, both the price and earnings are higher than the 2007 cyclical highs, and the price recovered and rose above the 2019 high. Earnings looked to be on track to do so as well after 2021, but they took a turn for the worst in 2022. Since I think the 2022 decline can be at least partially explained by external factors, I am willing to give adidas the benefit of the doubt in this case that without a new recession in Europe this year, they would have recovered earnings just fine.
At any rate, I think adidas should be categorized as a high-quality, deeply cyclical stock, that can often sell off deeply, but also recover in a timely manner. These are the sorts of cyclical stocks we want to invest in with this strategy. The question is what price is reasonable to buy the stock if we can’t really use earnings to value the stock?
adidas Stock’s Historical Price Cyclicality
Once I’ve established that a stock is a deep cyclical, the next thing I examine is what its historical deep drawdowns have looked like. In most cases, I require there be at least enough data to include two recessions.
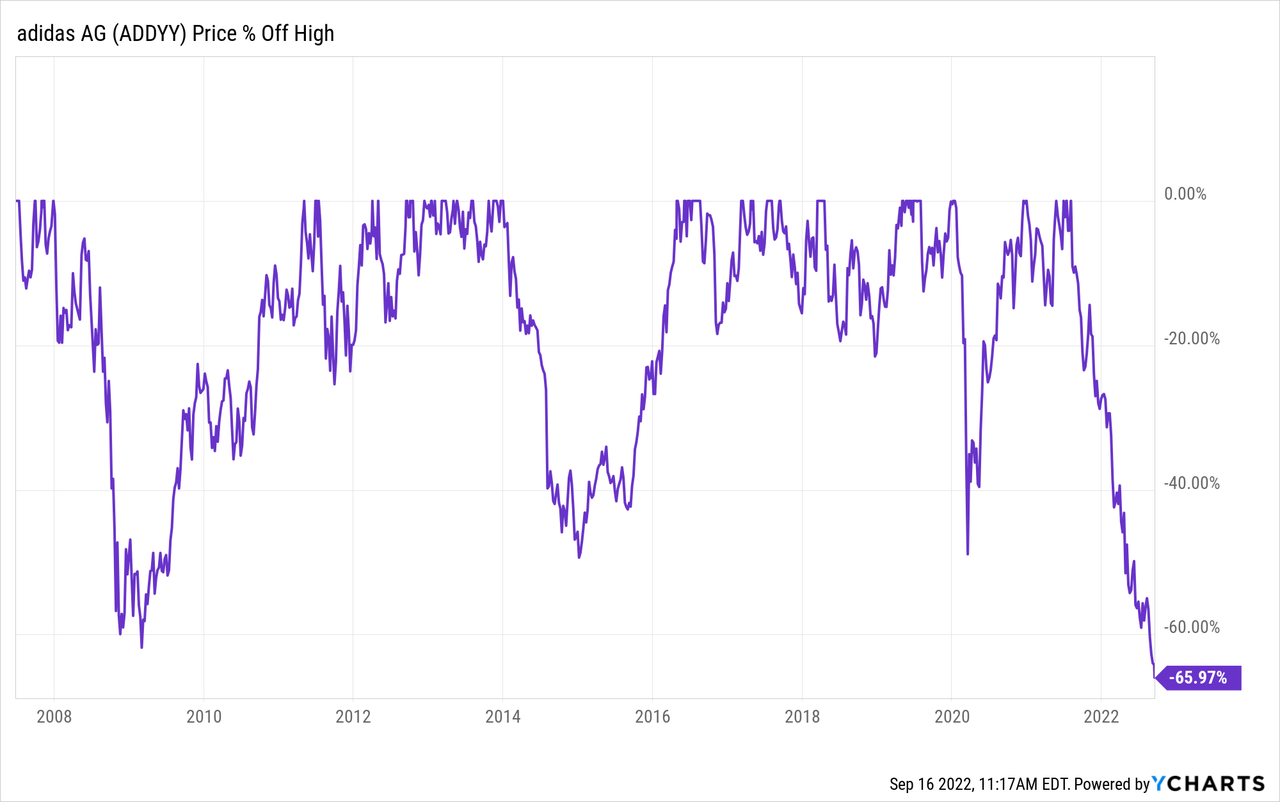
The above graph is of ADDYY’s historical stock price drawdowns. In it, we can see a general pattern of some drawdowns that bottom about -50% off their highs, and some that are deeper and bottom around -65% off their highs like in 2009. The recovery time off the bottom has typically been pretty fast, roughly 1-3 years before new price highs are made. If this pattern holds, it could provide the opportunity for very good returns, even if it takes a full 5 years for the stock price to recover.
The question now becomes: Is there a reason to think this time is different and the pattern might not hold?
For this, I have designed some impairment tests to check for the most common reasons a deeply cyclical stock might not recover its old highs in a timely manner.
Impairment Tests
My cyclical impairment tests are tests that I frame as a series of questions.
Are revenues during this cyclical peak higher than the last one?
Revenues that are weaker than the previous cycle can be a sign that the business is shrinking, and therefore might not reach its old highs again.
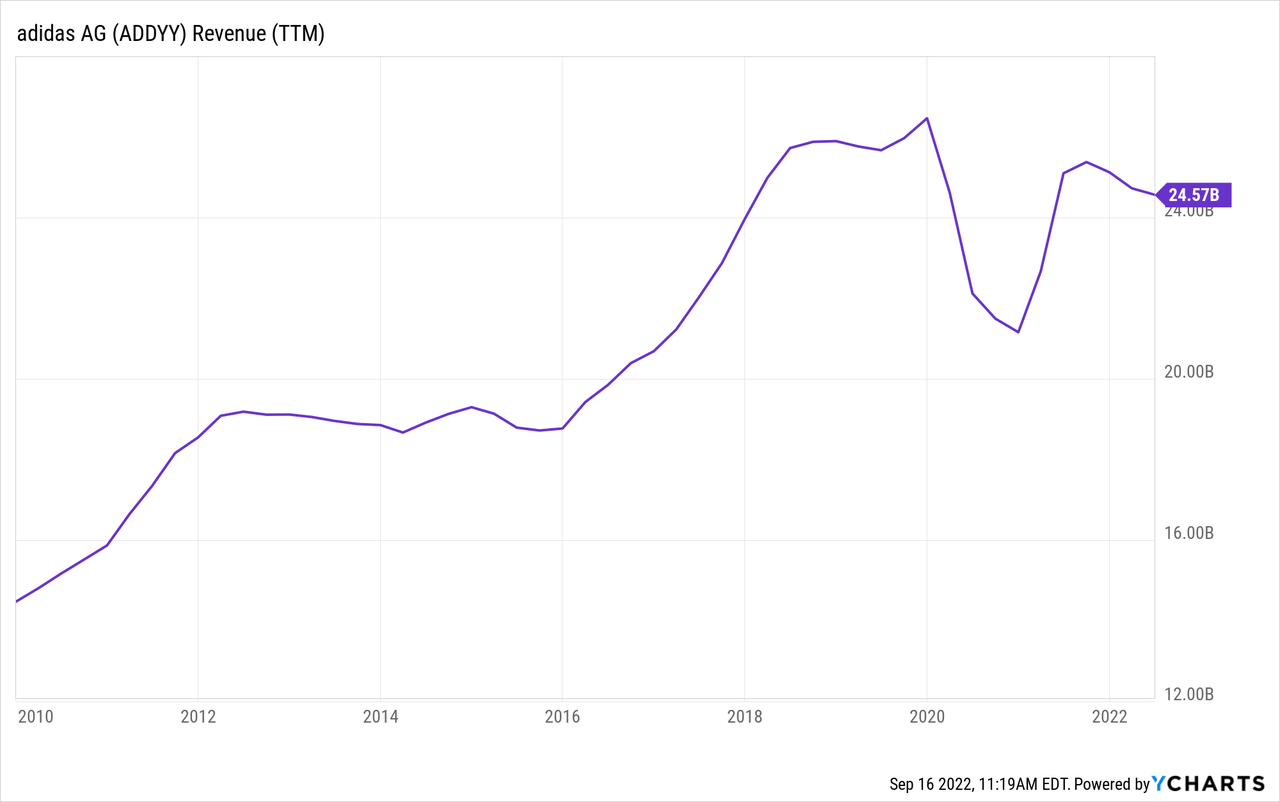
In the graph above, we can see that adidas’s revenues are about double what they were in 2010 (which was the limit of the Y-Charts data). This is a general sign of strength. That said, 2022 revenue didn’t quite return to pre-pandemic levels before retreating again. That could be a sign of weakness. However, given what is going on in Europe and China right now, I think this decline is explainable, and we initially saw a pretty strong revenue recovery in 2021, so while the current revenue weakness is worth noting, it’s not enough to keep me out of the stock because I do think 3-5 years from now it is likely to recover.
Could the business have a hidden fatal flaw?
Even though we only have 17 years of data on FAST Graphs for ADDYY, adidas has been around for long enough and gone through enough cycles that it’s safe to assume that their business model doesn’t have a fatal flaw. This rule typically applies to “new” business models, which often come along and try to convince us that the old rules no longer apply to them. It often takes a recession or two to truly test a business model, which is why I’m fairly strict about requiring these businesses have survived and recovered from at least two previous downcycles.
With some businesses, this can be obvious, but with others, not so much. What is important here is to focus on the time frame at hand, which, for this strategy is about 2-5 years into the future. We might see some disruption eventually coming in the far future, but if it’s too far in the future we might be missing an opportunity with a stock over the medium-term. When I bought Valero (VLO) and other refiners, I was aware that trends like work-from-home and electric vehicles would eventually lower fuel demand, but I judged that demand destruction probably wasn’t coming in a big way over the next 2-5 years and that it was more likely we would see a fuel demand recovery during that time. That resulted in a nice double for the stock price. If I would have like some far-off disruptive threat keep me out of Valero (and DINO), I would have missed out a huge upside opportunity.
I think with a business like adidas, there will always be lots of competition, both from Nike (NKE) and from newer start-ups. We should always assume that there are people working at the company who will find ways to compete and make adjustments as they need to, in this regard. But if we had a trend where everyone started wearing cowboy boots instead of sneakers, for example, that could potentially be a more serious problem. I tend to give adidas the benefit of the doubt on this because I haven’t seen clear signs of disruption that can’t be explained by other forces, yet… at least as far as I can tell.
Has adidas stock experienced a recent super-cycle?
Occasionally, stocks go through big super-cycles, valuations get thrown out the window by investors and the stock prices get bid up to crazy high levels. This can cause a problem for a strategy like mine that measures declines from peak prices because if the peak prices are ridiculously high, then a stock might fall -65% or more off its highs and still not exactly be a good value.
I don’t have a clear way to identify super-cycles. It’s kind of an “I’ll know it when I see it” sort of thing. But my quick way to check is to look at a log-scale version of a long-term historical price chart. Super-cycles tend to show up pretty well on these charts without giving as many false positives as a normal long-term price chart might.
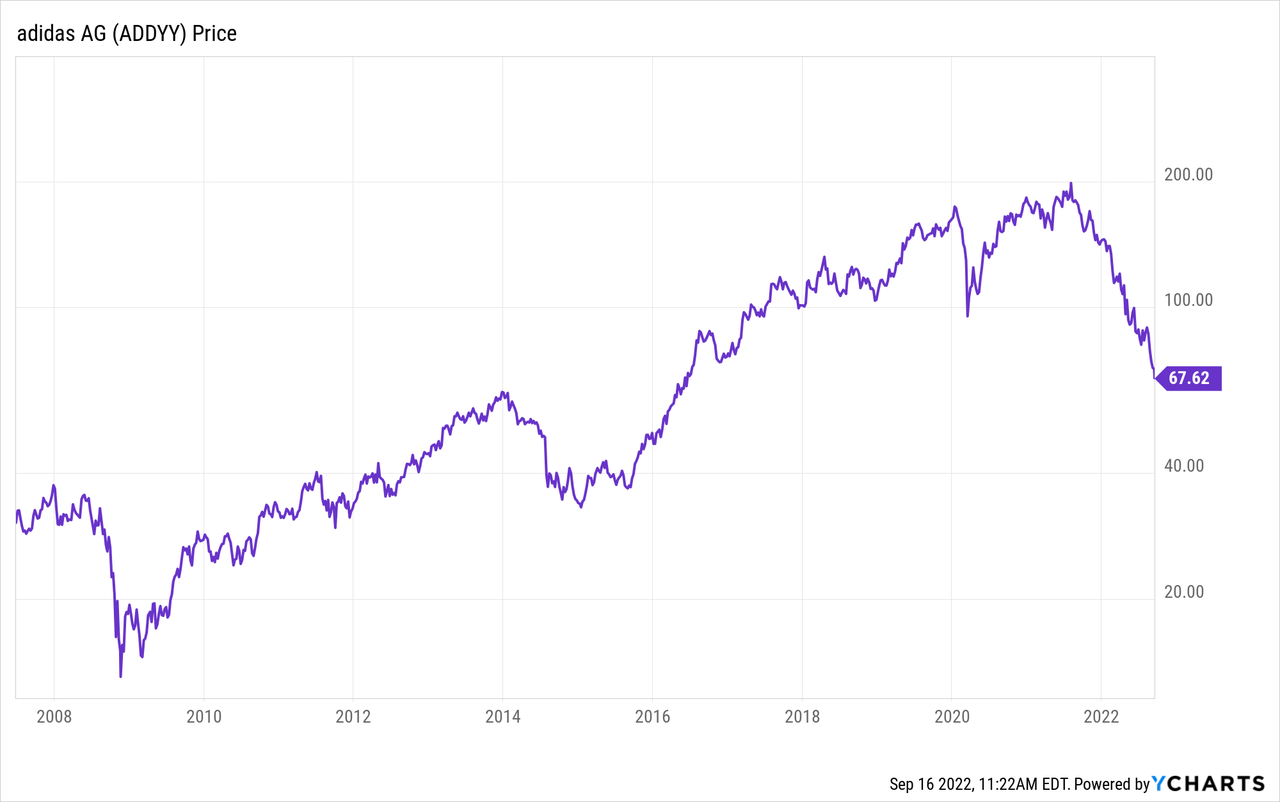
To me, this long-term log price chart doesn’t look like what I would call a supercycle; however, there is one important thing to point out regarding adidas stock’s peak P/E ratios.
While P/E ratios are not useful for valuing deeply cyclical businesses, examining and comparing peak P/E ratios before the earnings and price start to decline for different cycles can be useful to estimate if the valuation going into a downturn was higher during one cycle than another. If the valuation going into the downturn is much higher than the previous cycle, then we should probably expect a deeper decline in the stock price (or at least be prepared for it).
adidas’s peak P/E going into the 2008 decline was about 19. The peak P/E going into the 2020 decline was about 32, much higher. One reason for this is simply that bond interest rates were much lower in 2019 than they were in 2007, which caused many investors to be willing to pay more for stocks. So, how much this will affect the future peak P/E ratio is at least partially determined by where interest rates settle. The way I personally take this into account in this situation is that if we have a stock that we generally expect could fall -50% to -65% off its highs, because of the higher valuation going into the current decline, I am inclined to use the deeper historical decline as my guide (-65%), which is exactly what I’ve been doing with ADDYY and is part of the reason why I didn’t purchase the stock until last week.
Now, it’s possible (perhaps even likely) that because of the higher valuation going in, this stock falls deeper than -65% off its highs. Perhaps this time it falls -75% instead. We just have to use our judgment. For me, given that I don’t really have any other holding like adidas in my portfolio right now, and a -65% decline off their highs is pretty deep, along with the fact that the price already recovered once off the 2020 decline, makes me think that if the price does indeed fall a lot deeper, it could still make a pretty timely recovery if earnings eventually normalize, and I would be fine holding through that sort of deeper decline.
These are the sorts of considerations that go into setting the buy price for a high-quality deep cyclical stock. Some of it is logic, and some of it is just a general feel for what is going on in the macro environment as well. We are not aiming for precision here. One of the reasons I typically aim for very low prices is precisely because if I’m wrong about a few of small things, I can still do relatively well with my investment. I just might have to hold the stock longer or hold through a deeper drawdown than I would prefer.
Is management corrupt or incompetent?
This is an interesting one because whenever I heard an interview with their current CEO, I liked him and the way he thought about things. In fact, I think the reason this stock ended up tracking this stock in the first place was that I liked the CEO and the business, and even though it was expensive at the time, I thought it was worth tracking. However, it was recently announced the CEO would be leaving in 2023. I assume this is because of the negative earnings growth this year rather than some personal reason.
I don’t know enough about the internal workings of this business to tell whether the current weak earnings are something the CEO could have helped prevent and if he is just taking the fall for the poor performance of the stock or not. At any rate, we have new management coming in 2023.
How is the company’s debt-to-equity compared to previous cycles?
This is a shorthand way I use to look at debt over time for the same company since different industries have different typical debt loads. If a company has higher debt-to-equity than in past cycles, it could delay or impede a price recovery.
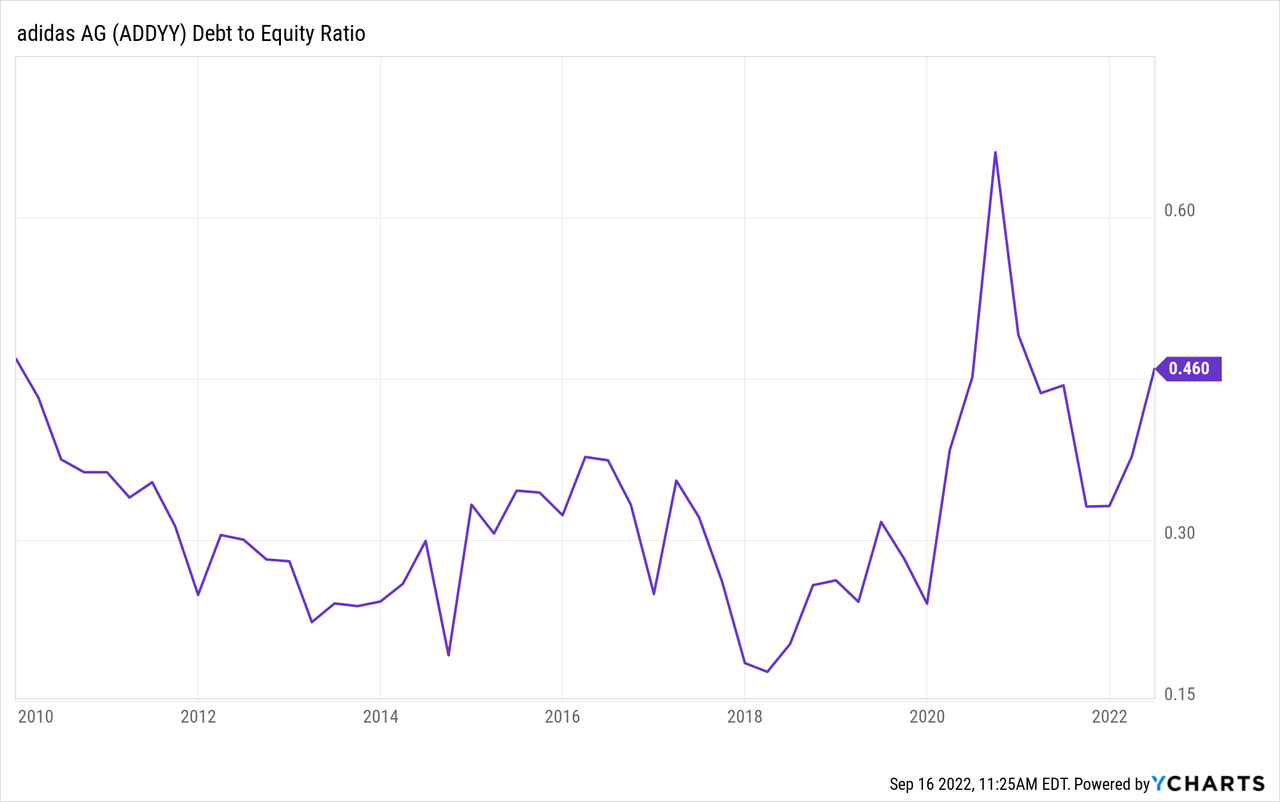
The debt-to-equity is relatively low and mostly in line with historical ranges. I usually look to see if this ratio is over 1, and whether if it is over 1, if that is unusual for the business historically. If it’s over 1 and that is unusual, then I might avoid buying the stock.
Has the price dropped enough to produce alpha in the past?
One of the underlying assumptions of the Deep Cycle strategy is that if the market was willing to pay a certain price for a stock in the past, if similar conditions occur in the future, then it’s reasonable to expect the market to pay that price in the future. This means that with this strategy generally what we aim for is for the stock price to recover its previous all-time highs, and that’s usually the point at which we take profits. Because of this structure, if we know how far off the highs we plan to buy the stock, then we can know our eventual absolute return. What we don’t know, is how long it will take the stock to recover. For that reason, it is important to look at how fast the stock has recovered in the past and how those returns compare to the S&P 500.
In this case, we know we want to aim to buy when the price is about -65% off the peak price and there is only one time in the past the stock has fallen that far, so I can simply share a Y-chart rather than post a big table with multiple years of information in it.
Y-Charts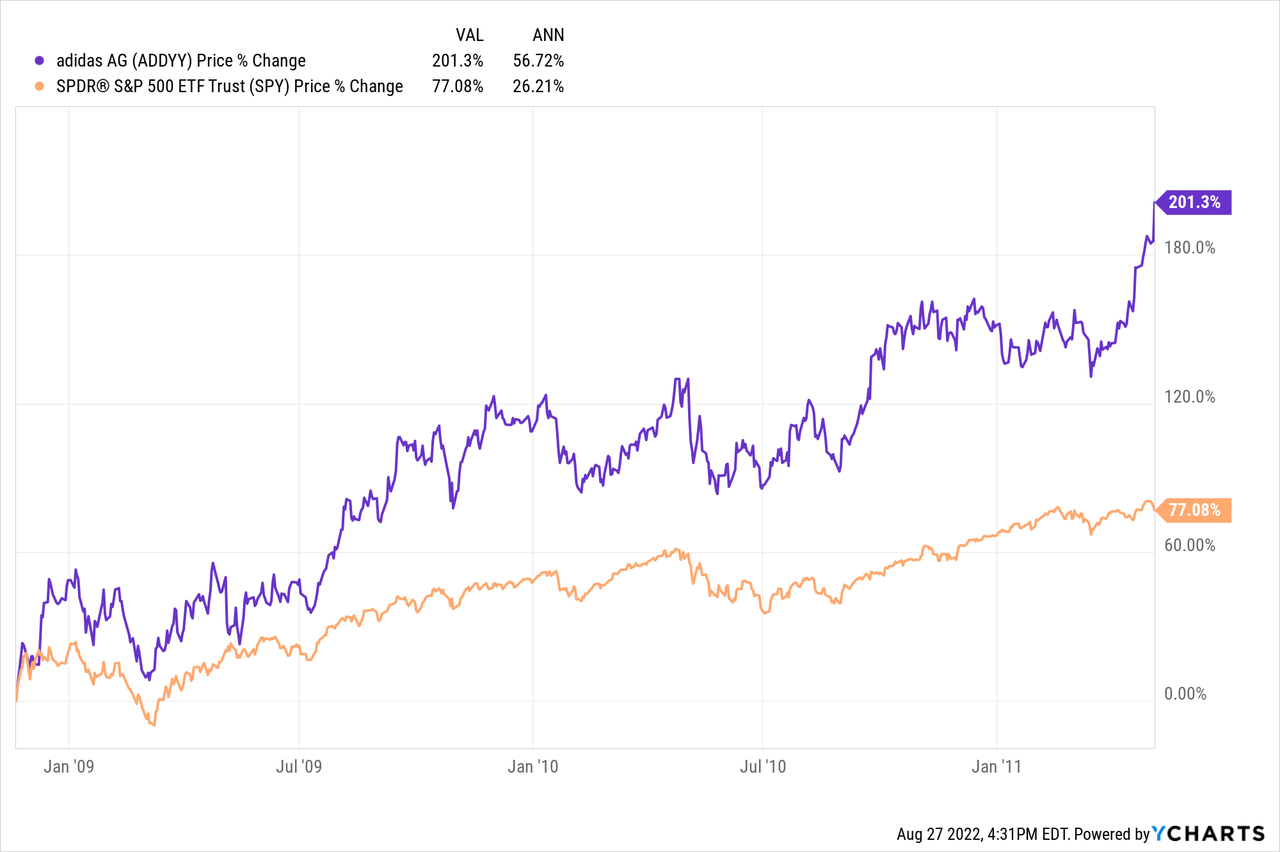
The above chart runs from November 2008 to May 2011. During that time, ADDYY produced a 200% return and recovered its previous price peak. The annualized returns were 56% compared to SPY’s 26% annualized returns. These are the types of returns we want to see during a backtest. Importantly, even if the recovery this time around is much slower, and it takes 5 years for the stock price to recover, that would produce a 24% CAGR, and if it took 10 years, it would produce a decent 11.61% CAGR. When the risk/reward is like this, it makes betting on the stock a very reasonable proposition as long as we think the business has a pretty good chance to eventually return to its historical trend.
Over time, I’ve had about an 80% positive return rate with this strategy, and about 20% of the time the stock price does not recover in a timely manner if purchased near the cyclical lows.
Conclusion
Based on the above strategy, ADDYY is a buy for the medium-term whenever the price is below $69.80, which it is currently below. Because deep cyclical stocks can be extremely volatile and also riskier than a very steady-earning business, I take positions that have an approximate portfolio weighting of 1%. This makes it easier to deal with the volatility and also spreads any company-specific risk around so that if adidas’s business really is facing a bigger sort of disruption than it appears, we will have limited our losses. However, we should expect roughly a 200% return from this investment over time, and even if it takes 5-10 years we should be able to get above average returns.
As I noted, we bought this stock in my marketplace service, The Cyclical Investor’s Club, last week. But I wanted to at least share an example to my public readers that while not all stocks I track will hit my deep buy prices, I do have high-quality stocks that do hit those prices on a regular basis. Often, the news isn’t pretty at the time they do so, but I try to look past that, and use long-term history as my guide for the future rather than short-term news and sentiment.
Be the first to comment